 Add to Chrome
 Add to Firefox
 Add to Edge
VideoPro: A Visual Analytics Approach for Interactive Video Programming
Aug 01, 2023


Constructing supervised machine learning models for real-world video analysis require substantial labeled data, which is costly to acquire due to scarce domain expertise and laborious manual inspection. While data programming shows promise in generating labeled data at scale with user-defined labeling functions, the high dimensional and complex temporal information in videos poses additional challenges for effectively composing and evaluating labeling functions. In this paper, we propose VideoPro, a visual analytics approach to support flexible and scalable video data programming for model steering with reduced human effort. We first extract human-understandable events from videos using computer vision techniques and treat them as atomic components of labeling functions. We further propose a two-stage template mining algorithm that characterizes the sequential patterns of these events to serve as labeling function templates for efficient data labeling. The visual interface of VideoPro facilitates multifaceted exploration, examination, and application of the labeling templates, allowing for effective programming of video data at scale. Moreover, users can monitor the impact of programming on model performance and make informed adjustments during the iterative programming process. We demonstrate the efficiency and effectiveness of our approach with two case studies and expert interviews.
CommonsenseVIS: Visualizing and Understanding Commonsense Reasoning Capabilities of Natural Language Models
Jul 23, 2023


Recently, large pretrained language models have achieved compelling performance on commonsense benchmarks. Nevertheless, it is unclear what commonsense knowledge the models learn and whether they solely exploit spurious patterns. Feature attributions are popular explainability techniques that identify important input concepts for model outputs. However, commonsense knowledge tends to be implicit and rarely explicitly presented in inputs. These methods cannot infer models' implicit reasoning over mentioned concepts. We present CommonsenseVIS, a visual explanatory system that utilizes external commonsense knowledge bases to contextualize model behavior for commonsense question-answering. Specifically, we extract relevant commonsense knowledge in inputs as references to align model behavior with human knowledge. Our system features multi-level visualization and interactive model probing and editing for different concepts and their underlying relations. Through a user study, we show that CommonsenseVIS helps NLP experts conduct a systematic and scalable visual analysis of models' relational reasoning over concepts in different situations.
PromptMagician: Interactive Prompt Engineering for Text-to-Image Creation
Jul 18, 2023Generative text-to-image models have gained great popularity among the public for their powerful capability to generate high-quality images based on natural language prompts. However, developing effective prompts for desired images can be challenging due to the complexity and ambiguity of natural language. This research proposes PromptMagician, a visual analysis system that helps users explore the image results and refine the input prompts. The backbone of our system is a prompt recommendation model that takes user prompts as input, retrieves similar prompt-image pairs from DiffusionDB, and identifies special (important and relevant) prompt keywords. To facilitate interactive prompt refinement, PromptMagician introduces a multi-level visualization for the cross-modal embedding of the retrieved images and recommended keywords, and supports users in specifying multiple criteria for personalized exploration. Two usage scenarios, a user study, and expert interviews demonstrate the effectiveness and usability of our system, suggesting it facilitates prompt engineering and improves the creativity support of the generative text-to-image model.
XNLI: Explaining and Diagnosing NLI-based Visual Data Analysis
Jan 25, 2023


Natural language interfaces (NLIs) enable users to flexibly specify analytical intentions in data visualization. However, diagnosing the visualization results without understanding the underlying generation process is challenging. Our research explores how to provide explanations for NLIs to help users locate the problems and further revise the queries. We present XNLI, an explainable NLI system for visual data analysis. The system introduces a Provenance Generator to reveal the detailed process of visual transformations, a suite of interactive widgets to support error adjustments, and a Hint Generator to provide query revision hints based on the analysis of user queries and interactions. Two usage scenarios of XNLI and a user study verify the effectiveness and usability of the system. Results suggest that XNLI can significantly enhance task accuracy without interrupting the NLI-based analysis process.
ShortcutLens: A Visual Analytics Approach for Exploring Shortcuts in Natural Language Understanding Dataset
Aug 17, 2022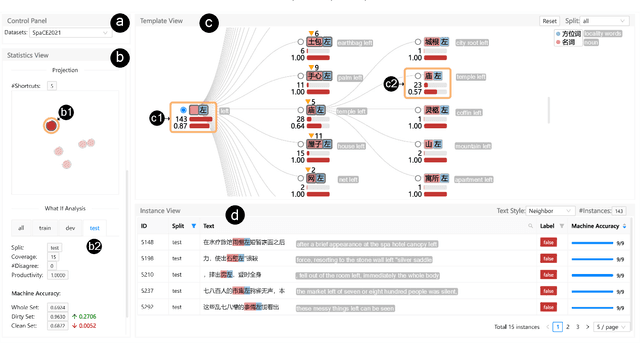
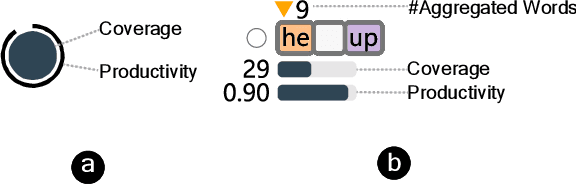
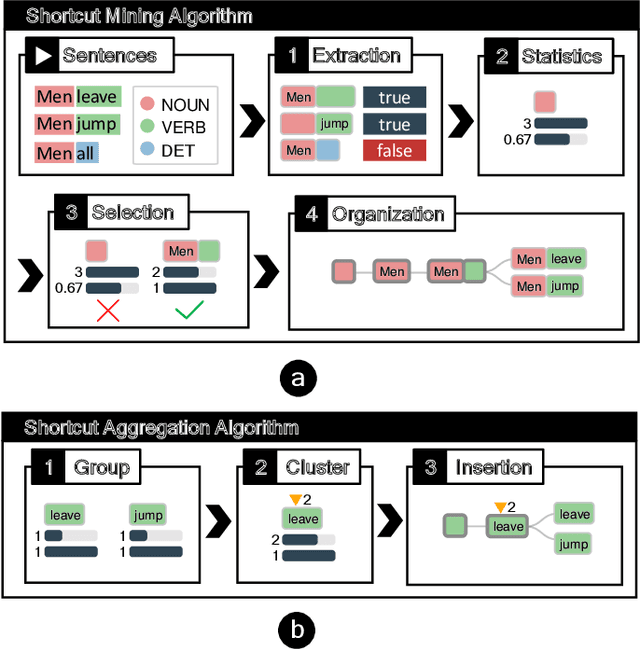
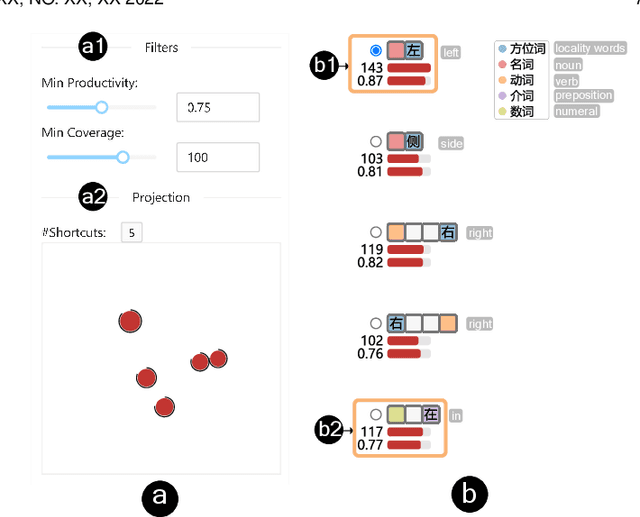
Benchmark datasets play an important role in evaluating Natural Language Understanding (NLU) models. However, shortcuts -- unwanted biases in the benchmark datasets -- can damage the effectiveness of benchmark datasets in revealing models' real capabilities. Since shortcuts vary in coverage, productivity, and semantic meaning, it is challenging for NLU experts to systematically understand and avoid them when creating benchmark datasets. In this paper, we develop a visual analytics system, ShortcutLens, to help NLU experts explore shortcuts in NLU benchmark datasets. The system allows users to conduct multi-level exploration of shortcuts. Specifically, Statistics View helps users grasp the statistics such as coverage and productivity of shortcuts in the benchmark dataset. Template View employs hierarchical and interpretable templates to summarize different types of shortcuts. Instance View allows users to check the corresponding instances covered by the shortcuts. We conduct case studies and expert interviews to evaluate the effectiveness and usability of the system. The results demonstrate that ShortcutLens supports users in gaining a better understanding of benchmark dataset issues through shortcuts, inspiring them to create challenging and pertinent benchmark datasets.
MultiViz: An Analysis Benchmark for Visualizing and Understanding Multimodal Models
Jun 30, 2022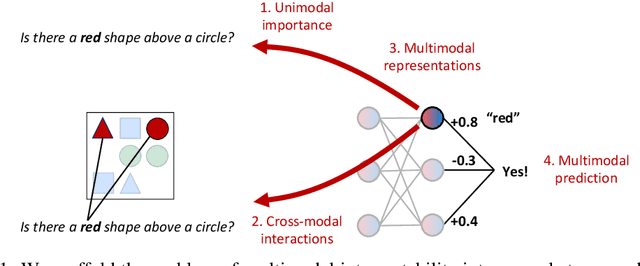
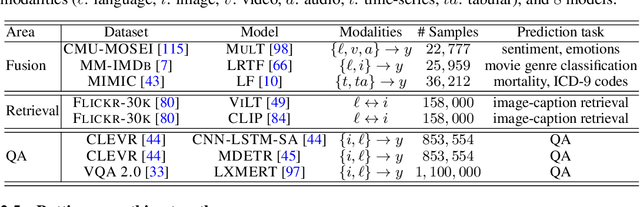
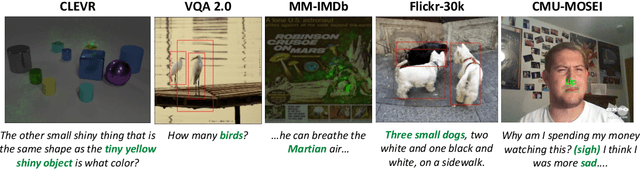
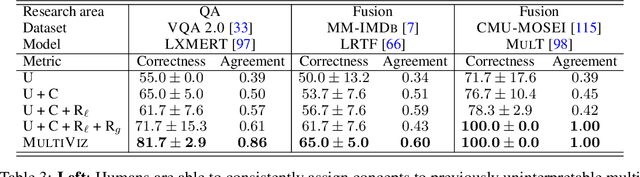
The promise of multimodal models for real-world applications has inspired research in visualizing and understanding their internal mechanics with the end goal of empowering stakeholders to visualize model behavior, perform model debugging, and promote trust in machine learning models. However, modern multimodal models are typically black-box neural networks, which makes it challenging to understand their internal mechanics. How can we visualize the internal modeling of multimodal interactions in these models? Our paper aims to fill this gap by proposing MultiViz, a method for analyzing the behavior of multimodal models by scaffolding the problem of interpretability into 4 stages: (1) unimodal importance: how each modality contributes towards downstream modeling and prediction, (2) cross-modal interactions: how different modalities relate with each other, (3) multimodal representations: how unimodal and cross-modal interactions are represented in decision-level features, and (4) multimodal prediction: how decision-level features are composed to make a prediction. MultiViz is designed to operate on diverse modalities, models, tasks, and research areas. Through experiments on 8 trained models across 6 real-world tasks, we show that the complementary stages in MultiViz together enable users to (1) simulate model predictions, (2) assign interpretable concepts to features, (3) perform error analysis on model misclassifications, and (4) use insights from error analysis to debug models. MultiViz is publicly available, will be regularly updated with new interpretation tools and metrics, and welcomes inputs from the community.
GestureLens: Visual Analysis of Gestures in Presentation Videos
Apr 23, 2022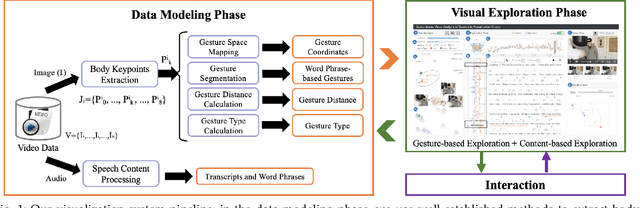
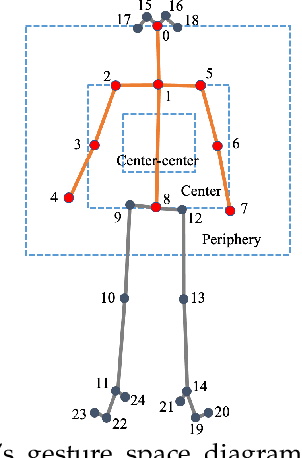
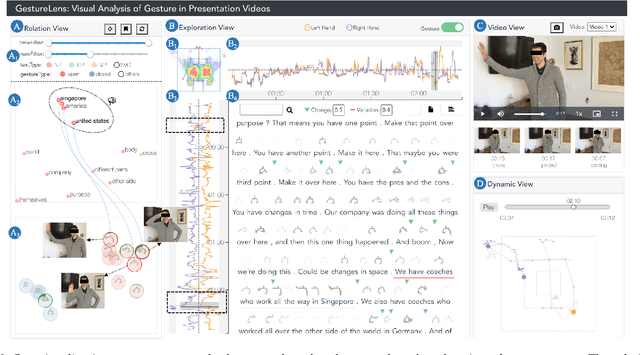
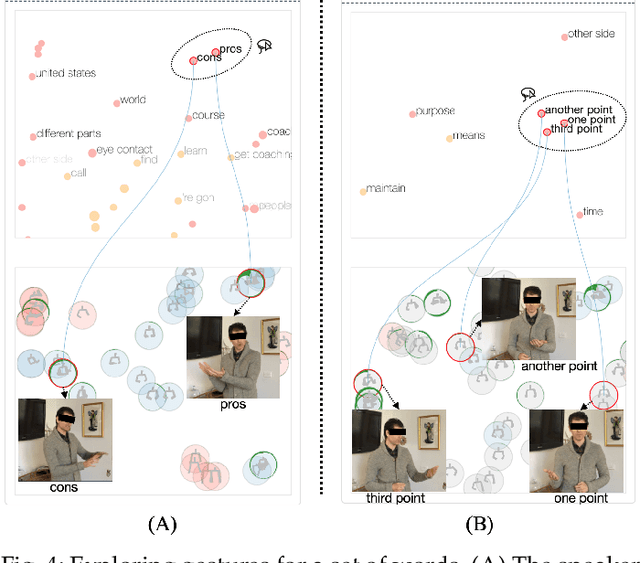
Appropriate gestures can enhance message delivery and audience engagement in both daily communication and public presentations. In this paper, we contribute a visual analytic approach that assists professional public speaking coaches in improving their practice of gesture training through analyzing presentation videos. Manually checking and exploring gesture usage in the presentation videos is often tedious and time-consuming. There lacks an efficient method to help users conduct gesture exploration, which is challenging due to the intrinsically temporal evolution of gestures and their complex correlation to speech content. In this paper, we propose GestureLens, a visual analytics system to facilitate gesture-based and content-based exploration of gesture usage in presentation videos. Specifically, the exploration view enables users to obtain a quick overview of the spatial and temporal distributions of gestures. The dynamic hand movements are firstly aggregated through a heatmap in the gesture space for uncovering spatial patterns, and then decomposed into two mutually perpendicular timelines for revealing temporal patterns. The relation view allows users to explicitly explore the correlation between speech content and gestures by enabling linked analysis and intuitive glyph designs. The video view and dynamic view show the context and overall dynamic movement of the selected gestures, respectively. Two usage scenarios and expert interviews with professional presentation coaches demonstrate the effectiveness and usefulness of GestureLens in facilitating gesture exploration and analysis of presentation videos.
Persua: A Visual Interactive System to Enhance the Persuasiveness of Arguments in Online Discussion
Apr 21, 2022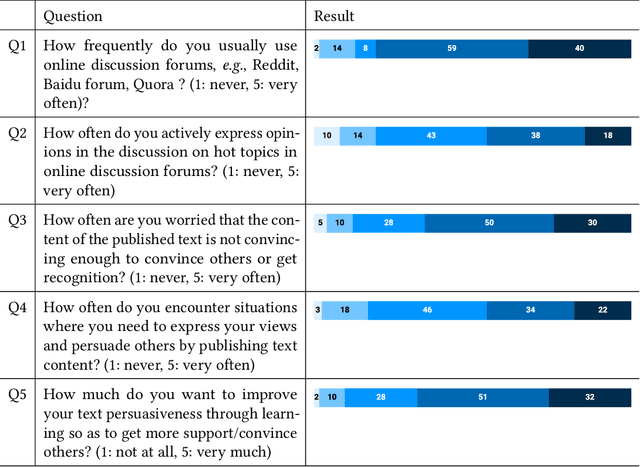
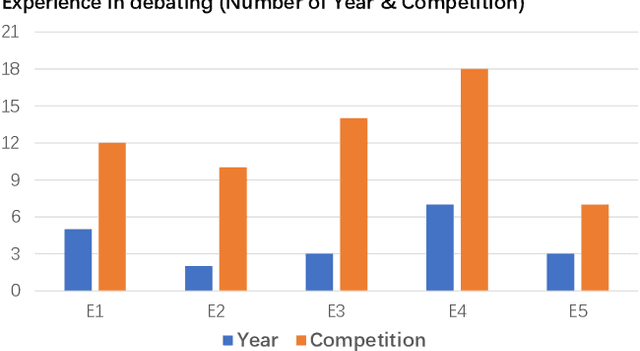
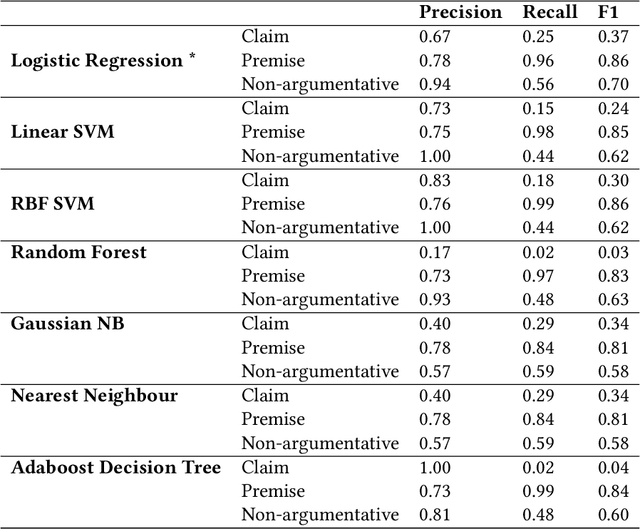
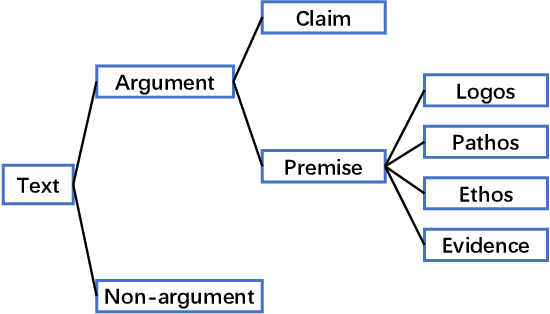
Persuading people to change their opinions is a common practice in online discussion forums on topics ranging from political campaigns to relationship consultation. Enhancing people's ability to write persuasive arguments could not only practice their critical thinking and reasoning but also contribute to the effectiveness and civility in online communication. It is, however, not an easy task in online discussion settings where written words are the primary communication channel. In this paper, we derived four design goals for a tool that helps users improve the persuasiveness of arguments in online discussions through a survey with 123 online forum users and interviews with five debating experts. To satisfy these design goals, we analyzed and built a labeled dataset of fine-grained persuasive strategies (i.e., logos, pathos, ethos, and evidence) in 164 arguments with high ratings on persuasiveness from ChangeMyView, a popular online discussion forum. We then designed an interactive visual system, Persua, which provides example-based guidance on persuasive strategies to enhance the persuasiveness of arguments. In particular, the system constructs portfolios of arguments based on different persuasive strategies applied to a given discussion topic. It then presents concrete examples based on the difference between the portfolios of user input and high-quality arguments in the dataset. A between-subjects study shows suggestive evidence that Persua encourages users to submit more times for feedback and helps users improve more on the persuasiveness of their arguments than a baseline system. Finally, a set of design considerations was summarized to guide future intelligent systems that improve the persuasiveness in text.
Interactive Data Analysis with Next-step Natural Language Query Recommendation
Jan 13, 2022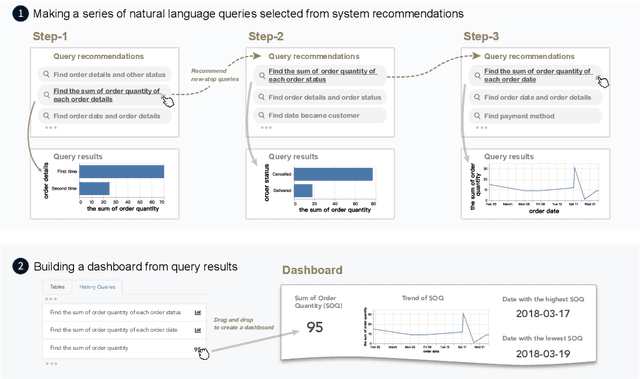
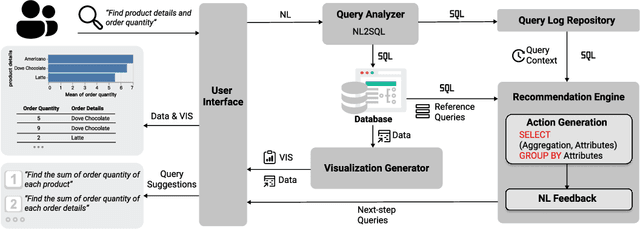

Natural language interfaces (NLIs) provide users with a convenient way to interactively analyze data through natural language queries. Nevertheless, interactive data analysis is a demanding process, especially for novice data analysts. When exploring large and complex datasets from different domains, data analysts do not necessarily have sufficient knowledge about data and application domains. It makes them unable to efficiently elicit a series of queries and extensively derive desirable data insights. In this paper, we develop an NLI with a step-wise query recommendation module to assist users in choosing appropriate next-step exploration actions. The system adopts a data-driven approach to generate step-wise semantically relevant and context-aware query suggestions for application domains of users' interest based on their query logs. Also, the system helps users organize query histories and results into a dashboard to communicate the discovered data insights. With a comparative user study, we show that our system can facilitate a more effective and systematic data analysis process than a baseline without the recommendation module.
NumGPT: Improving Numeracy Ability of Generative Pre-trained Models
Sep 07, 2021
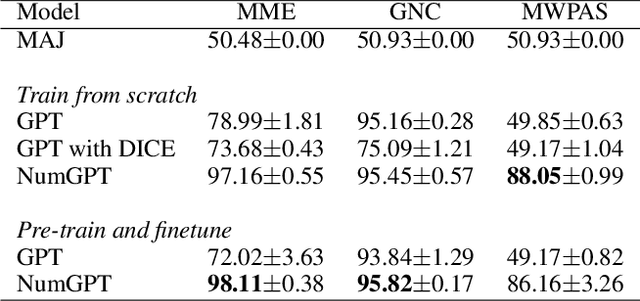
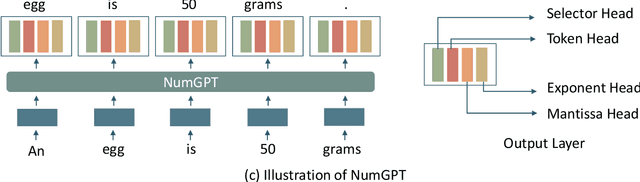
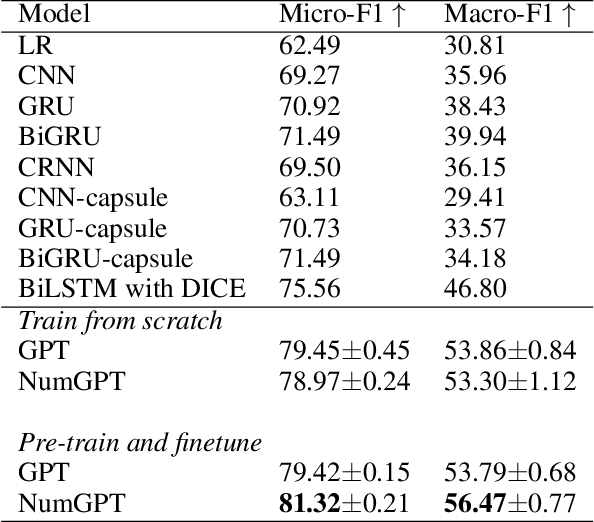
Existing generative pre-trained language models (e.g., GPT) focus on modeling the language structure and semantics of general texts. However, those models do not consider the numerical properties of numbers and cannot perform robustly on numerical reasoning tasks (e.g., math word problems and measurement estimation). In this paper, we propose NumGPT, a generative pre-trained model that explicitly models the numerical properties of numbers in texts. Specifically, it leverages a prototype-based numeral embedding to encode the mantissa of the number and an individual embedding to encode the exponent of the number. A numeral-aware loss function is designed to integrate numerals into the pre-training objective of NumGPT. We conduct extensive experiments on four different datasets to evaluate the numeracy ability of NumGPT. The experiment results show that NumGPT outperforms baseline models (e.g., GPT and GPT with DICE) on a range of numerical reasoning tasks such as measurement estimation, number comparison, math word problems, and magnitude classification. Ablation studies are also conducted to evaluate the impact of pre-training and model hyperparameters on the performance.