 Add to Chrome
 Add to Firefox
 Add to Edge
Plotqa
Papers and Code
Point-RFT: Improving Multimodal Reasoning with Visually Grounded Reinforcement Finetuning
May 26, 2025
Recent advances in large language models have significantly improved textual reasoning through the effective use of Chain-of-Thought (CoT) and reinforcement learning. However, extending these successes to vision-language tasks remains challenging due to inherent limitations in text-only CoT, such as visual hallucinations and insufficient multimodal integration. In this paper, we introduce Point-RFT, a multimodal reasoning framework explicitly designed to leverage visually grounded CoT reasoning for visual document understanding. Our approach consists of two stages: First, we conduct format finetuning using a curated dataset of 71K diverse visual reasoning problems, each annotated with detailed, step-by-step rationales explicitly grounded to corresponding visual elements. Second, we employ reinforcement finetuning targeting visual document understanding. On ChartQA, our approach improves accuracy from 70.88% (format-finetuned baseline) to 90.04%, surpassing the 83.92% accuracy achieved by reinforcement finetuning relying solely on text-based CoT. The result shows that our grounded CoT is more effective for multimodal reasoning compared with the text-only CoT. Moreover, Point-RFT exhibits superior generalization capability across several out-of-domain visual document reasoning benchmarks, including CharXiv, PlotQA, IconQA, TabMWP, etc., and highlights its potential in complex real-world scenarios.
Charting the Future: Using Chart Question-Answering for Scalable Evaluation of LLM-Driven Data Visualizations
Sep 27, 2024


We propose a novel framework that leverages Visual Question Answering (VQA) models to automate the evaluation of LLM-generated data visualizations. Traditional evaluation methods often rely on human judgment, which is costly and unscalable, or focus solely on data accuracy, neglecting the effectiveness of visual communication. By employing VQA models, we assess data representation quality and the general communicative clarity of charts. Experiments were conducted using two leading VQA benchmark datasets, ChartQA and PlotQA, with visualizations generated by OpenAI's GPT-3.5 Turbo and Meta's Llama 3.1 70B-Instruct models. Our results indicate that LLM-generated charts do not match the accuracy of the original non-LLM-generated charts based on VQA performance measures. Moreover, while our results demonstrate that few-shot prompting significantly boosts the accuracy of chart generation, considerable progress remains to be made before LLMs can fully match the precision of human-generated graphs. This underscores the importance of our work, which expedites the research process by enabling rapid iteration without the need for human annotation, thus accelerating advancements in this field.
GoT-CQA: Graph-of-Thought Guided Compositional Reasoning for Chart Question Answering
Sep 04, 2024


Chart Question Answering (CQA) aims at answering questions based on the visual chart content, which plays an important role in chart sumarization, business data analysis, and data report generation. CQA is a challenging multi-modal task because of the strong context dependence and complex reasoning requirement. The former refers to answering this question strictly based on the analysis of the visual content or internal data of the given chart, while the latter emphasizes the various logical and numerical reasoning involved in answer prediction process. In this paper, we pay more attention on the complex reasoning in CQA task, and propose a novel Graph-of-Thought (GoT) guided compositional reasoning model called GoT-CQA to overcome this problem. At first, we transform the chart-oriented question into a directed acyclic GoT composed of multiple operator nodes, including localization, numerical and logical operator. It intuitively reflects the human brain's solution process to this question. After that, we design an efficient auto-compositional reasoning framework guided by the GoT, to excute the multi-step reasoning operations in various types of questions. Comprehensive experiments on ChartQA and PlotQA-D datasets show that GoT-CQA achieves outstanding performance, especially in complex human-written and reasoning questions, comparing with the latest popular baselines.
VProChart: Answering Chart Question through Visual Perception Alignment Agent and Programmatic Solution Reasoning
Sep 03, 2024


Charts are widely used for data visualization across various fields, including education, research, and business. Chart Question Answering (CQA) is an emerging task focused on the automatic interpretation and reasoning of data presented in charts. However, chart images are inherently difficult to interpret, and chart-related questions often involve complex logical and numerical reasoning, which hinders the performance of existing models. This paper introduces VProChart, a novel framework designed to address these challenges in CQA by integrating a lightweight Visual Perception Alignment Agent (VPAgent) and a Programmatic Solution Reasoning approach. VPAgent aligns and models chart elements based on principles of human visual perception, enhancing the understanding of chart context. The Programmatic Solution Reasoning approach leverages large language models (LLMs) to transform natural language reasoning questions into structured solution programs, facilitating precise numerical and logical reasoning. Extensive experiments on benchmark datasets such as ChartQA and PlotQA demonstrate that VProChart significantly outperforms existing methods, highlighting its capability in understanding and reasoning with charts.
Synthesize Step-by-Step: Tools, Templates and LLMs as Data Generators for Reasoning-Based Chart VQA
Mar 28, 2024


Understanding data visualizations like charts and plots requires reasoning about both visual elements and numerics. Although strong in extractive questions, current chart visual question answering (chart VQA) models suffer on complex reasoning questions. In this work, we address the lack of reasoning ability by data augmentation. We leverage Large Language Models (LLMs), which have shown to have strong reasoning ability, as an automatic data annotator that generates question-answer annotations for chart images. The key innovation in our method lies in the Synthesize Step-by-Step strategy: our LLM-based data generator learns to decompose the complex question into step-by-step sub-questions (rationales), which are then used to derive the final answer using external tools, i.e. Python. This step-wise generation procedure is trained on synthetic data generated using a template-based QA generation pipeline. Experimental results highlight the significance of the proposed step-by-step generation. By training with the LLM-augmented data (LAMENDA), we significantly enhance the chart VQA models, achieving the state-of-the-art accuracy on the ChartQA and PlotQA datasets. In particular, our approach improves the accuracy of the previous state-of-the-art approach from 38% to 54% on the human-written questions in the ChartQA dataset, which needs strong reasoning. We hope our work underscores the potential of synthetic data and encourages further exploration of data augmentation using LLMs for reasoning-heavy tasks.
Chart-based Reasoning: Transferring Capabilities from LLMs to VLMs
Mar 19, 2024


Vision-language models (VLMs) are achieving increasingly strong performance on multimodal tasks. However, reasoning capabilities remain limited particularly for smaller VLMs, while those of large-language models (LLMs) have seen numerous improvements. We propose a technique to transfer capabilities from LLMs to VLMs. On the recently introduced ChartQA, our method obtains state-of-the-art performance when applied on the PaLI3-5B VLM by \citet{chen2023pali3}, while also enabling much better performance on PlotQA and FigureQA. We first improve the chart representation by continuing the pre-training stage using an improved version of the chart-to-table translation task by \citet{liu2023deplot}. We then propose constructing a 20x larger dataset than the original training set. To improve general reasoning capabilities and improve numerical operations, we synthesize reasoning traces using the table representation of charts. Lastly, our model is fine-tuned using the multitask loss introduced by \citet{hsieh2023distilling}. Our variant ChartPaLI-5B outperforms even 10x larger models such as PaLIX-55B without using an upstream OCR system, while keeping inference time constant compared to the PaLI3-5B baseline. When rationales are further refined with a simple program-of-thought prompt \cite{chen2023program}, our model outperforms the recently introduced Gemini Ultra and GPT-4V.
DCQA: Document-Level Chart Question Answering towards Complex Reasoning and Common-Sense Understanding
Oct 29, 2023


Visually-situated languages such as charts and plots are omnipresent in real-world documents. These graphical depictions are human-readable and are often analyzed in visually-rich documents to address a variety of questions that necessitate complex reasoning and common-sense responses. Despite the growing number of datasets that aim to answer questions over charts, most only address this task in isolation, without considering the broader context of document-level question answering. Moreover, such datasets lack adequate common-sense reasoning information in their questions. In this work, we introduce a novel task named document-level chart question answering (DCQA). The goal of this task is to conduct document-level question answering, extracting charts or plots in the document via document layout analysis (DLA) first and subsequently performing chart question answering (CQA). The newly developed benchmark dataset comprises 50,010 synthetic documents integrating charts in a wide range of styles (6 styles in contrast to 3 for PlotQA and ChartQA) and includes 699,051 questions that demand a high degree of reasoning ability and common-sense understanding. Besides, we present the development of a potent question-answer generation engine that employs table data, a rich color set, and basic question templates to produce a vast array of reasoning question-answer pairs automatically. Based on DCQA, we devise an OCR-free transformer for document-level chart-oriented understanding, capable of DLA and answering complex reasoning and common-sense questions over charts in an OCR-free manner. Our DCQA dataset is expected to foster research on understanding visualizations in documents, especially for scenarios that require complex reasoning for charts in the visually-rich document. We implement and evaluate a set of baselines, and our proposed method achieves comparable results.
MatCha: Enhancing Visual Language Pretraining with Math Reasoning and Chart Derendering
Dec 19, 2022


Visual language data such as plots, charts, and infographics are ubiquitous in the human world. However, state-of-the-art vision-language models do not perform well on these data. We propose MatCha (Math reasoning and Chart derendering pretraining) to enhance visual language models' capabilities in jointly modeling charts/plots and language data. Specifically, we propose several pretraining tasks that cover plot deconstruction and numerical reasoning which are the key capabilities in visual language modeling. We perform the MatCha pretraining starting from Pix2Struct, a recently proposed image-to-text visual language model. On standard benchmarks such as PlotQA and ChartQA, the MatCha model outperforms state-of-the-art methods by as much as nearly 20%. We also examine how well MatCha pretraining transfers to domains such as screenshots, textbook diagrams, and document figures and observe overall improvement, verifying the usefulness of MatCha pretraining on broader visual language tasks.
Classification-Regression for Chart Comprehension
Nov 29, 2021
Charts are a popular and effective form of data visualization. Chart question answering (CQA) is a task used for assessing chart comprehension, which is fundamentally different from understanding natural images. CQA requires analyzing the relationships between the textual and the visual components of a chart, in order to answer general questions or infer numerical values. Most existing CQA datasets and it models are based on simplifying assumptions that often enable surpassing human performance. In this work, we further explore the reasons behind this outcome and propose a new model that jointly learns classification and regression. Our language-vision set up with co-attention transformers captures the complex interactions between the question and the textual elements, which commonly exist in real-world charts. We validate these conclusions with extensive experiments and breakdowns on the realistic PlotQA dataset, outperforming previous approaches by a large margin, while showing competitive performance on FigureQA. Our model's edge is particularly emphasized on questions with out-of-vocabulary answers, many of which require regression. We hope that this work will stimulate further research towards solving the challenging and highly practical task of chart comprehension.
A Systematic Evaluation of Object Detection Networks for Scientific Plots
Jul 05, 2020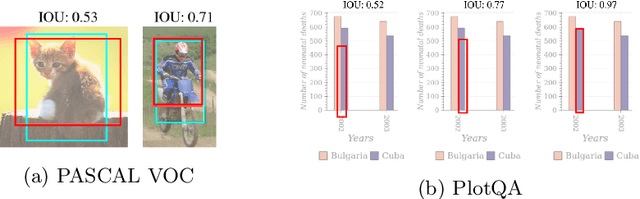
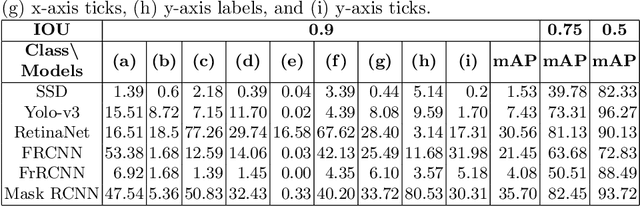
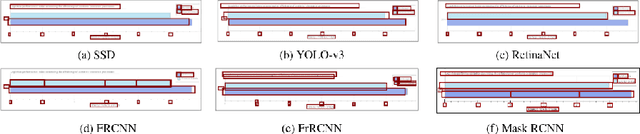
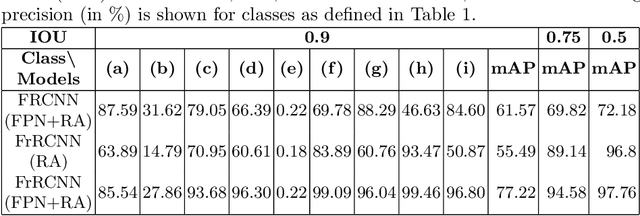
Are existing object detection methods adequate for detecting text and visual elements in scientific plots which are arguably different than the objects found in natural images? To answer this question, we train and compare the accuracy of Fast/Faster R-CNN, SSD, YOLO and RetinaNet on the PlotQA dataset with over 220,000 scientific plots. At the standard IOU setting of 0.5, most networks perform well with mAP scores greater than 80% in detecting the relatively simple objects in plots. However, the performance drops drastically when evaluated at a stricter IOU of 0.9 with the best model giving a mAP of 35.70%. Note that such a stricter evaluation is essential when dealing with scientific plots where even minor localisation errors can lead to large errors in downstream numerical inferences. Given this poor performance, we propose minor modifications to existing models by combining ideas from different object detection networks. While this significantly improves the performance, there are still 2 main issues: (i) performance on text objects which are essential for reasoning is very poor, and (ii) inference time is unacceptably large considering the simplicity of plots. Based on these experiments and results, we identify the following considerations for improving object detection on plots: (a) small inference time, (b) higher precision on text objects, and (c) more accurate localisation with a custom loss function with non-negligible loss values at high IOU (> 0.8). We propose a network which meets all these considerations: It is 16x faster than the best performing competitor and significantly improves upon the accuracy of existing models with a mAP of 93.44%@0.9 IOU.