 Add to Chrome
 Add to Firefox
 Add to Edge
Power Scheduler: A Batch Size and Token Number Agnostic Learning Rate Scheduler
Aug 23, 2024


Finding the optimal learning rate for language model pretraining is a challenging task. This is not only because there is a complicated correlation between learning rate, batch size, number of training tokens, model size, and other hyperparameters but also because it is prohibitively expensive to perform a hyperparameter search for large language models with Billions or Trillions of parameters. Recent studies propose using small proxy models and small corpus to perform hyperparameter searches and transposing the optimal parameters to large models and large corpus. While the zero-shot transferability is theoretically and empirically proven for model size related hyperparameters, like depth and width, the zero-shot transfer from small corpus to large corpus is underexplored. In this paper, we study the correlation between optimal learning rate, batch size, and number of training tokens for the recently proposed WSD scheduler. After thousands of small experiments, we found a power-law relationship between variables and demonstrated its transferability across model sizes. Based on the observation, we propose a new learning rate scheduler, Power scheduler, that is agnostic about the number of training tokens and batch size. The experiment shows that combining the Power scheduler with Maximum Update Parameterization (muP) can consistently achieve impressive performance with one set of hyperparameters regardless of the number of training tokens, batch size, model size, and even model architecture. Our 3B dense and MoE models trained with the Power scheduler achieve comparable performance as state-of-the-art small language models. We open-source these pretrained models at https://ibm.biz/BdKhLa.
Scaling Granite Code Models to 128K Context
Jul 18, 2024This paper introduces long-context Granite code models that support effective context windows of up to 128K tokens. Our solution for scaling context length of Granite 3B/8B code models from 2K/4K to 128K consists of a light-weight continual pretraining by gradually increasing its RoPE base frequency with repository-level file packing and length-upsampled long-context data. Additionally, we also release instruction-tuned models with long-context support which are derived by further finetuning the long context base models on a mix of permissively licensed short and long-context instruction-response pairs. While comparing to the original short-context Granite code models, our long-context models achieve significant improvements on long-context tasks without any noticeable performance degradation on regular code completion benchmarks (e.g., HumanEval). We release all our long-context Granite code models under an Apache 2.0 license for both research and commercial use.
Granite Code Models: A Family of Open Foundation Models for Code Intelligence
May 07, 2024


Large Language Models (LLMs) trained on code are revolutionizing the software development process. Increasingly, code LLMs are being integrated into software development environments to improve the productivity of human programmers, and LLM-based agents are beginning to show promise for handling complex tasks autonomously. Realizing the full potential of code LLMs requires a wide range of capabilities, including code generation, fixing bugs, explaining and documenting code, maintaining repositories, and more. In this work, we introduce the Granite series of decoder-only code models for code generative tasks, trained with code written in 116 programming languages. The Granite Code models family consists of models ranging in size from 3 to 34 billion parameters, suitable for applications ranging from complex application modernization tasks to on-device memory-constrained use cases. Evaluation on a comprehensive set of tasks demonstrates that Granite Code models consistently reaches state-of-the-art performance among available open-source code LLMs. The Granite Code model family was optimized for enterprise software development workflows and performs well across a range of coding tasks (e.g. code generation, fixing and explanation), making it a versatile all around code model. We release all our Granite Code models under an Apache 2.0 license for both research and commercial use.
LAB: Large-Scale Alignment for ChatBots
Mar 06, 2024


This work introduces LAB (Large-scale Alignment for chatBots), a novel methodology designed to overcome the scalability challenges in the instruction-tuning phase of large language model (LLM) training. Leveraging a taxonomy-guided synthetic data generation process and a multi-phase tuning framework, LAB significantly reduces reliance on expensive human annotations and proprietary models like GPT-4. We demonstrate that LAB-trained models can achieve competitive performance across several benchmarks compared to models trained with traditional human-annotated or GPT-4 generated synthetic data. Thus offering a scalable, cost-effective solution for enhancing LLM capabilities and instruction-following behaviors without the drawbacks of catastrophic forgetting, marking a step forward in the efficient training of LLMs for a wide range of applications.
Neural Population Geometry Reveals the Role of Stochasticity in Robust Perception
Nov 12, 2021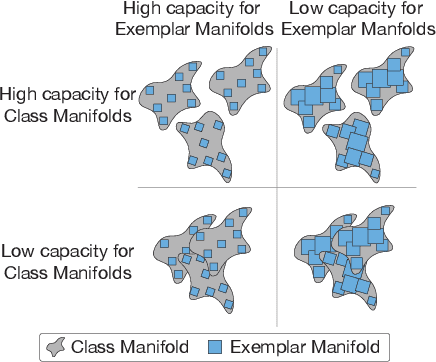
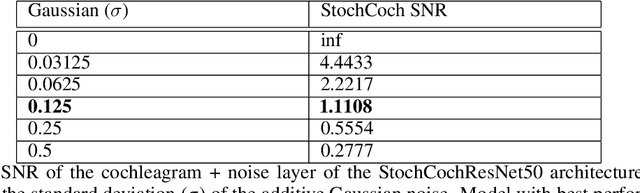
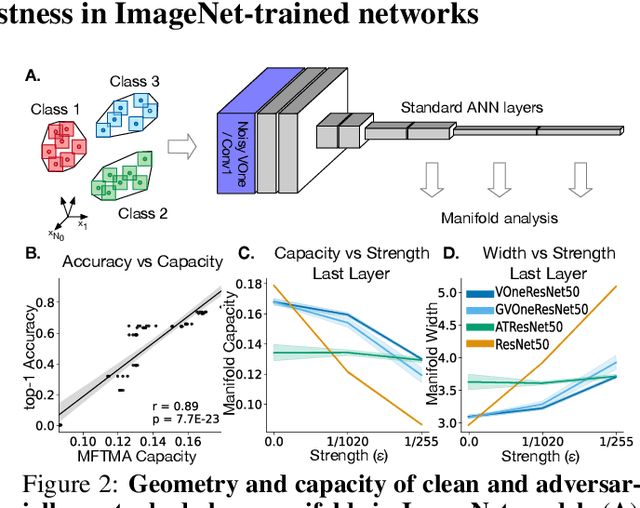
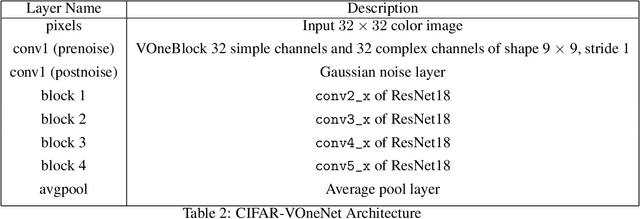
Adversarial examples are often cited by neuroscientists and machine learning researchers as an example of how computational models diverge from biological sensory systems. Recent work has proposed adding biologically-inspired components to visual neural networks as a way to improve their adversarial robustness. One surprisingly effective component for reducing adversarial vulnerability is response stochasticity, like that exhibited by biological neurons. Here, using recently developed geometrical techniques from computational neuroscience, we investigate how adversarial perturbations influence the internal representations of standard, adversarially trained, and biologically-inspired stochastic networks. We find distinct geometric signatures for each type of network, revealing different mechanisms for achieving robust representations. Next, we generalize these results to the auditory domain, showing that neural stochasticity also makes auditory models more robust to adversarial perturbations. Geometric analysis of the stochastic networks reveals overlap between representations of clean and adversarially perturbed stimuli, and quantitatively demonstrates that competing geometric effects of stochasticity mediate a tradeoff between adversarial and clean performance. Our results shed light on the strategies of robust perception utilized by adversarially trained and stochastic networks, and help explain how stochasticity may be beneficial to machine and biological computation.
Object-Centric Diagnosis of Visual Reasoning
Dec 21, 2020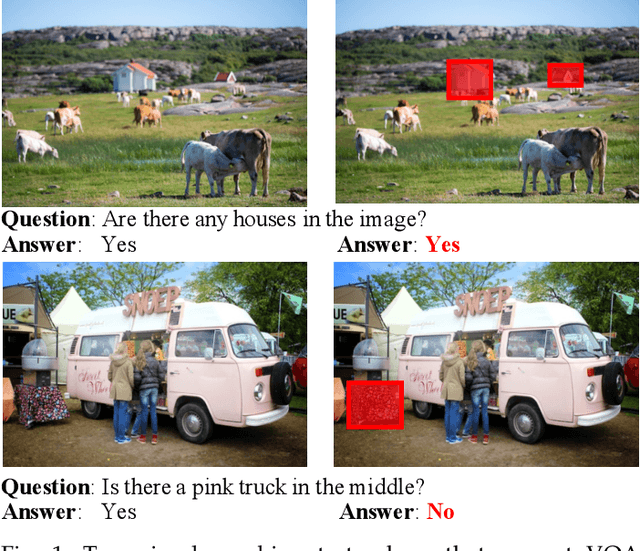
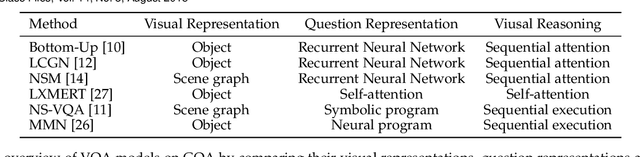
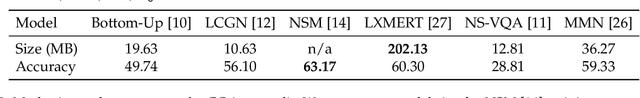
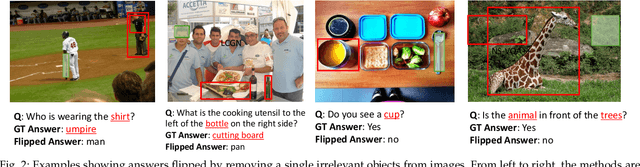
When answering questions about an image, it not only needs knowing what -- understanding the fine-grained contents (e.g., objects, relationships) in the image, but also telling why -- reasoning over grounding visual cues to derive the answer for a question. Over the last few years, we have seen significant progress on visual question answering. Though impressive as the accuracy grows, it still lags behind to get knowing whether these models are undertaking grounding visual reasoning or just leveraging spurious correlations in the training data. Recently, a number of works have attempted to answer this question from perspectives such as grounding and robustness. However, most of them are either focusing on the language side or coarsely studying the pixel-level attention maps. In this paper, by leveraging the step-wise object grounding annotations provided in the GQA dataset, we first present a systematical object-centric diagnosis of visual reasoning on grounding and robustness, particularly on the vision side. According to the extensive comparisons across different models, we find that even models with high accuracy are not good at grounding objects precisely, nor robust to visual content perturbations. In contrast, symbolic and modular models have a relatively better grounding and robustness, though at the cost of accuracy. To reconcile these different aspects, we further develop a diagnostic model, namely Graph Reasoning Machine. Our model replaces purely symbolic visual representation with probabilistic scene graph and then applies teacher-forcing training for the visual reasoning module. The designed model improves the performance on all three metrics over the vanilla neural-symbolic model while inheriting the transparency. Further ablation studies suggest that this improvement is mainly due to more accurate image understanding and proper intermediate reasoning supervisions.
Improving the Reconstruction of Disentangled Representation Learners via Multi-Stage Modelling
Oct 25, 2020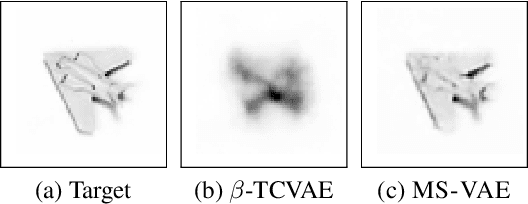
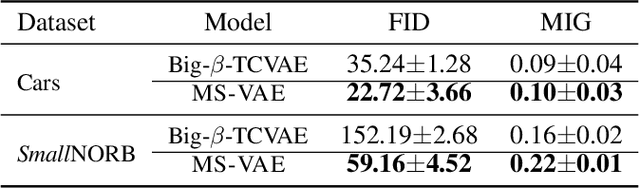
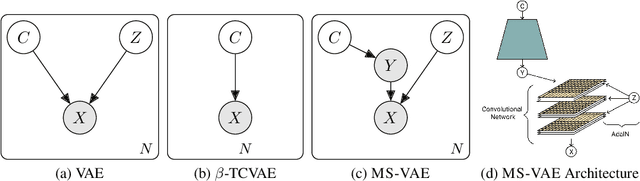
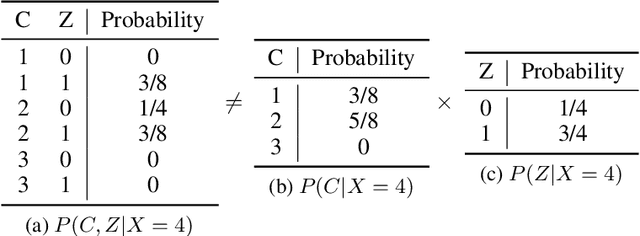
Current autoencoder-based disentangled representation learning methods achieve disentanglement by penalizing the (aggregate) posterior to encourage statistical independence of the latent factors. This approach introduces a trade-off between disentangled representation learning and reconstruction quality since the model does not have enough capacity to learn correlated latent variables that capture detail information present in most image data. To overcome this trade-off, we present a novel multi-stage modelling approach where the disentangled factors are first learned using a preexisting disentangled representation learning method (such as $\beta$-TCVAE); then, the low-quality reconstruction is improved with another deep generative model that is trained to model the missing correlated latent variables, adding detail information while maintaining conditioning on the previously learned disentangled factors. Taken together, our multi-stage modelling approach results in a single, coherent probabilistic model that is theoretically justified by the principal of D-separation and can be realized with a variety of model classes including likelihood-based models such as variational autoencoders, implicit models such as generative adversarial networks, and tractable models like normalizing flows or mixtures of Gaussians. We demonstrate that our multi-stage model has much higher reconstruction quality than current state-of-the-art methods with equivalent disentanglement performance across multiple standard benchmarks.
not-so-BigGAN: Generating High-Fidelity Images on a Small Compute Budget
Sep 09, 2020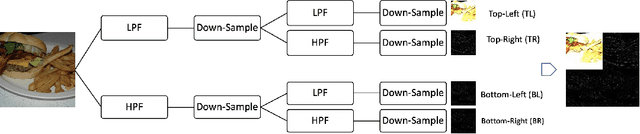
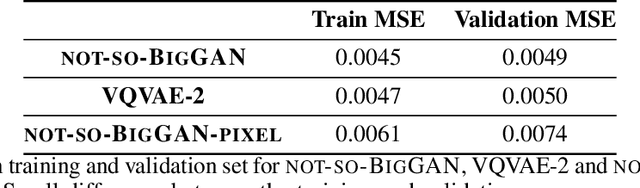
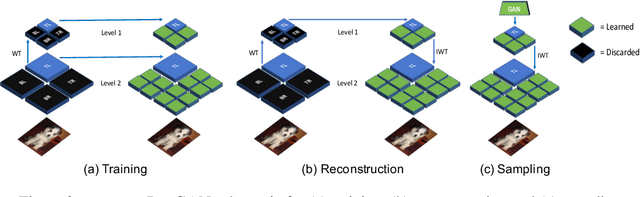
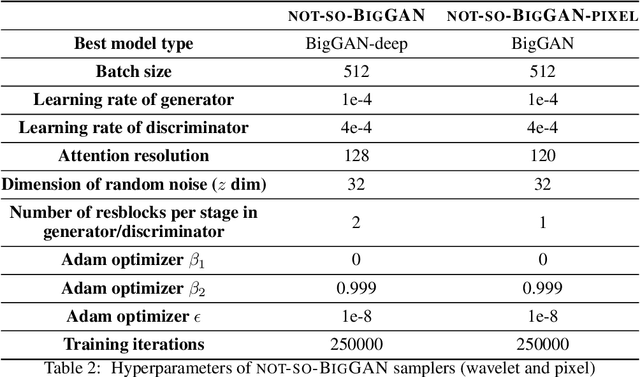
BigGAN is the state-of-the-art in high-resolution image generation, successfully leveraging advancements in scalable computing and theoretical understanding of generative adversarial methods to set new records in conditional image generation. A major part of BigGAN's success is due to its use of large mini-batch sizes during training in high dimensions. While effective, this technique requires an incredible amount of compute resources and/or time (256 TPU-v3 Cores), putting the model out of reach for the larger research community. In this paper, we present not-so-BigGAN, a simple and scalable framework for training deep generative models on high-dimensional natural images. Instead of modelling the image in pixel space like in BigGAN, not-so-BigGAN uses wavelet transformations to bypass the curse of dimensionality, reducing the overall compute requirement significantly. Through extensive empirical evaluation, we demonstrate that for a fixed compute budget, not-so-BigGAN converges several times faster than BigGAN, reaching competitive image quality with an order of magnitude lower compute budget (4 Telsa-V100 GPUs).
SimVAE: Simulator-Assisted Training forInterpretable Generative Models
Nov 19, 2019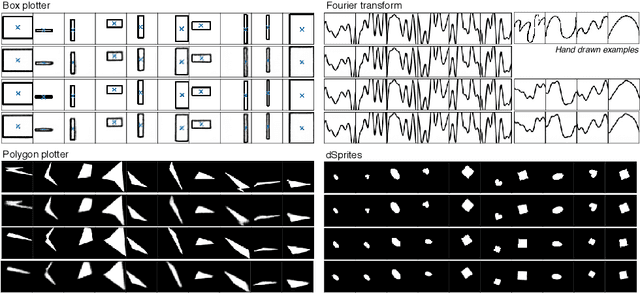
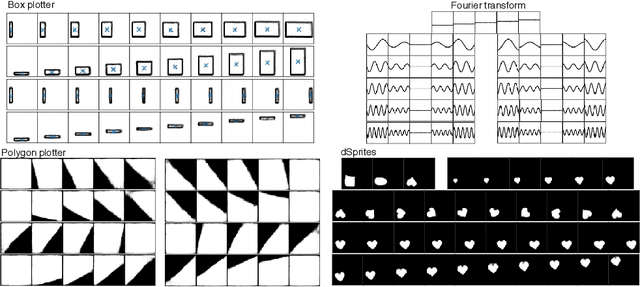
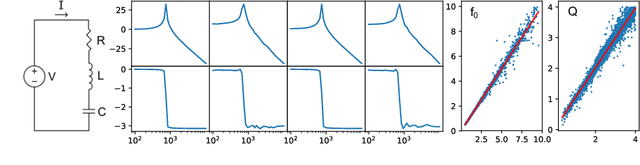
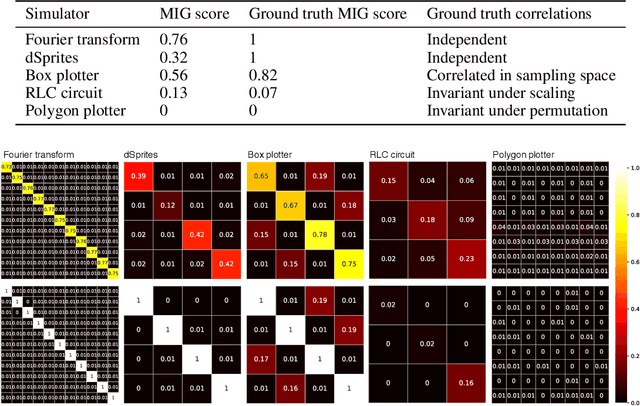
This paper presents a simulator-assisted training method (SimVAE) for variational autoencoders (VAE) that leads to a disentangled and interpretable latent space. Training SimVAE is a two-step process in which first a deep generator network(decoder) is trained to approximate the simulator. During this step, the simulator acts as the data source or as a teacher network. Then an inference network (encoder)is trained to invert the decoder. As such, upon complete training, the encoder represents an approximately inverted simulator. By decoupling the training of the encoder and decoder we bypass some of the difficulties that arise in training generative models such as VAEs and generative adversarial networks (GANs). We show applications of our approach in a variety of domains such as circuit design, graphics de-rendering and other natural science problems that involve inference via simulation.
Measuring and Understanding Sensory Representations within Deep Networks Using a Numerical Optimization Framework
Feb 17, 2015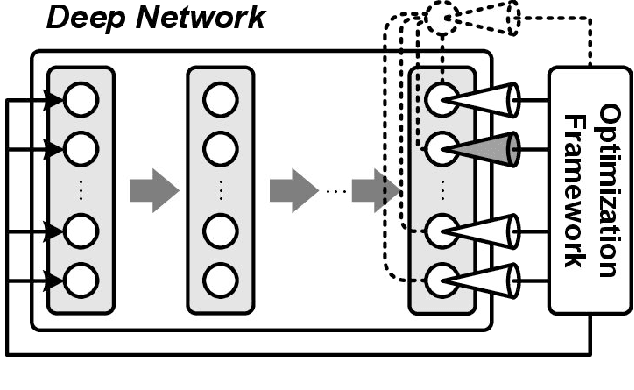
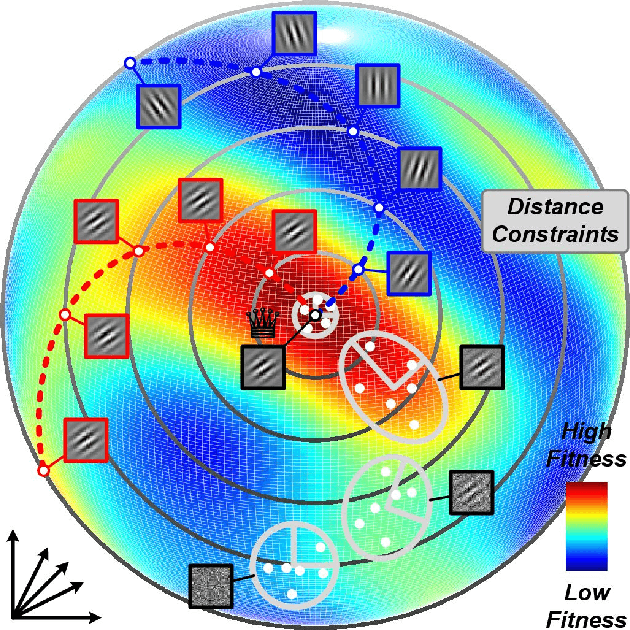
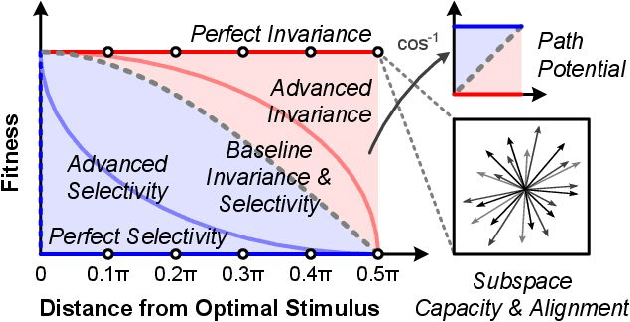
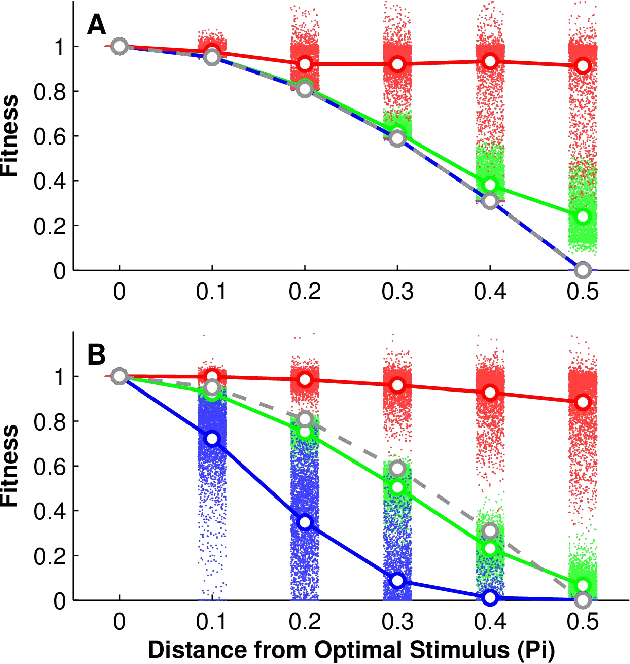
A central challenge in sensory neuroscience is describing how the activity of populations of neurons can represent useful features of the external environment. However, while neurophysiologists have long been able to record the responses of neurons in awake, behaving animals, it is another matter entirely to say what a given neuron does. A key problem is that in many sensory domains, the space of all possible stimuli that one might encounter is effectively infinite; in vision, for instance, natural scenes are combinatorially complex, and an organism will only encounter a tiny fraction of possible stimuli. As a result, even describing the response properties of sensory neurons is difficult, and investigations of neuronal functions are almost always critically limited by the number of stimuli that can be considered. In this paper, we propose a closed-loop, optimization-based experimental framework for characterizing the response properties of sensory neurons, building on past efforts in closed-loop experimental methods, and leveraging recent advances in artificial neural networks to serve as as a proving ground for our techniques. Specifically, using deep convolutional neural networks, we asked whether modern black-box optimization techniques can be used to interrogate the "tuning landscape" of an artificial neuron in a deep, nonlinear system, without imposing significant constraints on the space of stimuli under consideration. We introduce a series of measures to quantify the tuning landscapes, and show how these relate to the performances of the networks in an object recognition task. To the extent that deep convolutional neural networks increasingly serve as de facto working hypotheses for biological vision, we argue that developing a unified approach for studying both artificial and biological systems holds great potential to advance both fields together.