 Add to Chrome
 Add to Firefox
 Add to Edge
Towards Conversational Diagnostic AI
Jan 11, 2024At the heart of medicine lies the physician-patient dialogue, where skillful history-taking paves the way for accurate diagnosis, effective management, and enduring trust. Artificial Intelligence (AI) systems capable of diagnostic dialogue could increase accessibility, consistency, and quality of care. However, approximating clinicians' expertise is an outstanding grand challenge. Here, we introduce AMIE (Articulate Medical Intelligence Explorer), a Large Language Model (LLM) based AI system optimized for diagnostic dialogue. AMIE uses a novel self-play based simulated environment with automated feedback mechanisms for scaling learning across diverse disease conditions, specialties, and contexts. We designed a framework for evaluating clinically-meaningful axes of performance including history-taking, diagnostic accuracy, management reasoning, communication skills, and empathy. We compared AMIE's performance to that of primary care physicians (PCPs) in a randomized, double-blind crossover study of text-based consultations with validated patient actors in the style of an Objective Structured Clinical Examination (OSCE). The study included 149 case scenarios from clinical providers in Canada, the UK, and India, 20 PCPs for comparison with AMIE, and evaluations by specialist physicians and patient actors. AMIE demonstrated greater diagnostic accuracy and superior performance on 28 of 32 axes according to specialist physicians and 24 of 26 axes according to patient actors. Our research has several limitations and should be interpreted with appropriate caution. Clinicians were limited to unfamiliar synchronous text-chat which permits large-scale LLM-patient interactions but is not representative of usual clinical practice. While further research is required before AMIE could be translated to real-world settings, the results represent a milestone towards conversational diagnostic AI.
Towards Accurate Differential Diagnosis with Large Language Models
Nov 30, 2023


An accurate differential diagnosis (DDx) is a cornerstone of medical care, often reached through an iterative process of interpretation that combines clinical history, physical examination, investigations and procedures. Interactive interfaces powered by Large Language Models (LLMs) present new opportunities to both assist and automate aspects of this process. In this study, we introduce an LLM optimized for diagnostic reasoning, and evaluate its ability to generate a DDx alone or as an aid to clinicians. 20 clinicians evaluated 302 challenging, real-world medical cases sourced from the New England Journal of Medicine (NEJM) case reports. Each case report was read by two clinicians, who were randomized to one of two assistive conditions: either assistance from search engines and standard medical resources, or LLM assistance in addition to these tools. All clinicians provided a baseline, unassisted DDx prior to using the respective assistive tools. Our LLM for DDx exhibited standalone performance that exceeded that of unassisted clinicians (top-10 accuracy 59.1% vs 33.6%, [p = 0.04]). Comparing the two assisted study arms, the DDx quality score was higher for clinicians assisted by our LLM (top-10 accuracy 51.7%) compared to clinicians without its assistance (36.1%) (McNemar's Test: 45.7, p < 0.01) and clinicians with search (44.4%) (4.75, p = 0.03). Further, clinicians assisted by our LLM arrived at more comprehensive differential lists than those without its assistance. Our study suggests that our LLM for DDx has potential to improve clinicians' diagnostic reasoning and accuracy in challenging cases, meriting further real-world evaluation for its ability to empower physicians and widen patients' access to specialist-level expertise.
Predicting Risk of Developing Diabetic Retinopathy using Deep Learning
Aug 10, 2020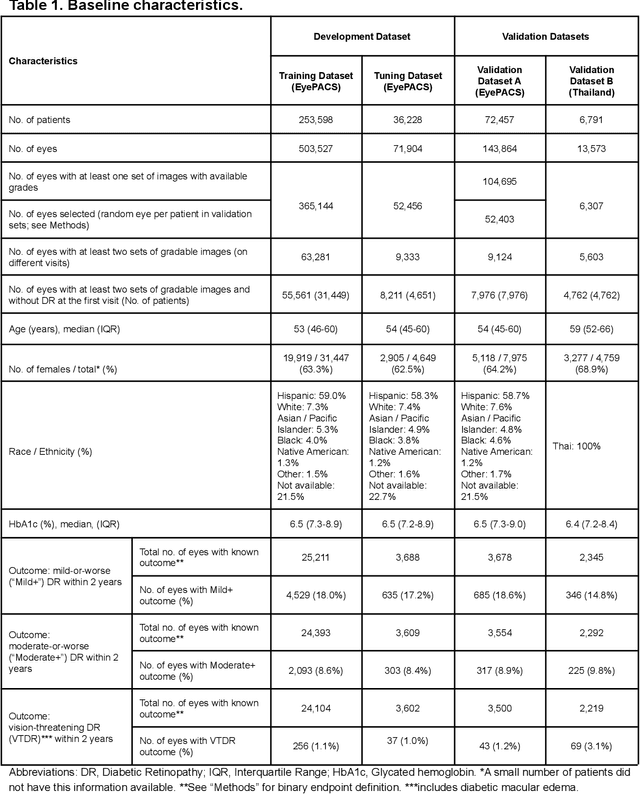
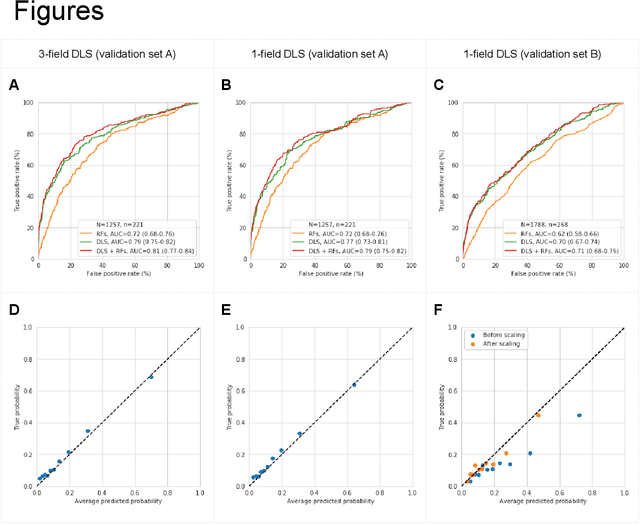
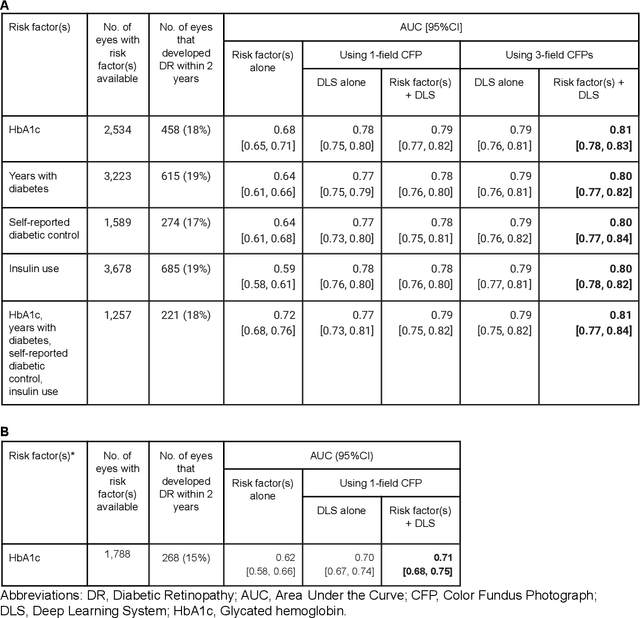
Diabetic retinopathy (DR) screening is instrumental in preventing blindness, but faces a scaling challenge as the number of diabetic patients rises. Risk stratification for the development of DR may help optimize screening intervals to reduce costs while improving vision-related outcomes. We created and validated two versions of a deep learning system (DLS) to predict the development of mild-or-worse ("Mild+") DR in diabetic patients undergoing DR screening. The two versions used either three-fields or a single field of color fundus photographs (CFPs) as input. The training set was derived from 575,431 eyes, of which 28,899 had known 2-year outcome, and the remaining were used to augment the training process via multi-task learning. Validation was performed on both an internal validation set (set A; 7,976 eyes; 3,678 with known outcome) and an external validation set (set B; 4,762 eyes; 2,345 with known outcome). For predicting 2-year development of DR, the 3-field DLS had an area under the receiver operating characteristic curve (AUC) of 0.79 (95%CI, 0.78-0.81) on validation set A. On validation set B (which contained only a single field), the 1-field DLS's AUC was 0.70 (95%CI, 0.67-0.74). The DLS was prognostic even after adjusting for available risk factors (p<0.001). When added to the risk factors, the 3-field DLS improved the AUC from 0.72 (95%CI, 0.68-0.76) to 0.81 (95%CI, 0.77-0.84) in validation set A, and the 1-field DLS improved the AUC from 0.62 (95%CI, 0.58-0.66) to 0.71 (95%CI, 0.68-0.75) in validation set B. The DLSs in this study identified prognostic information for DR development from CFPs. This information is independent of and more informative than the available risk factors.
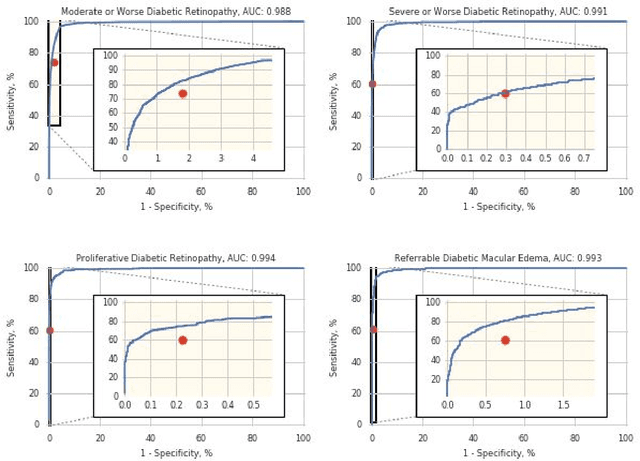
Predicting optical coherence tomography-derived diabetic macular edema grades from fundus photographs using deep learning
Oct 18, 2018
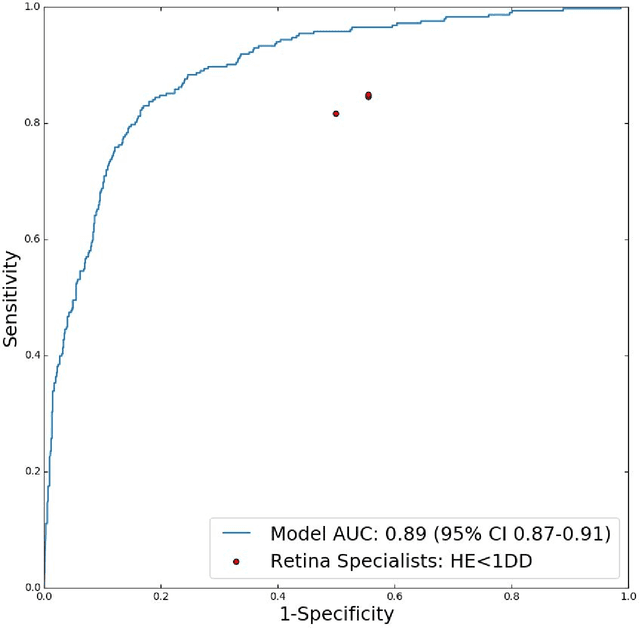
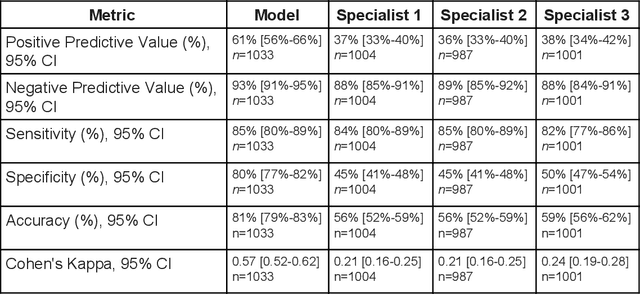
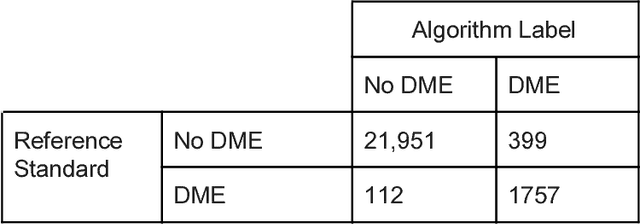
Diabetic eye disease is one of the fastest growing causes of preventable blindness. With the advent of anti-VEGF (vascular endothelial growth factor) therapies, it has become increasingly important to detect center-involved diabetic macular edema. However, center-involved diabetic macular edema is diagnosed using optical coherence tomography (OCT), which is not generally available at screening sites because of cost and workflow constraints. Instead, screening programs rely on the detection of hard exudates as a proxy for DME on color fundus photographs, often resulting in high false positive or false negative calls. To improve the accuracy of DME screening, we trained a deep learning model to use color fundus photographs to predict DME grades derived from OCT exams. Our "OCT-DME" model had an AUC of 0.89 (95% CI: 0.87-0.91), which corresponds to a sensitivity of 85% at a specificity of 80%. In comparison, three retinal specialists had similar sensitivities (82-85%), but only half the specificity (45-50%, p<0.001 for each comparison with model). The positive predictive value (PPV) of the OCT-DME model was 61% (95% CI: 56-66%), approximately double the 36-38% by the retina specialists. In addition, we used saliency and other techniques to examine how the model is making its prediction. The ability of deep learning algorithms to make clinically relevant predictions that generally require sophisticated 3D-imaging equipment from simple 2D images has broad relevance to many other applications in medical imaging.
Deep Learning vs. Human Graders for Classifying Severity Levels of Diabetic Retinopathy in a Real-World Nationwide Screening Program
Oct 18, 2018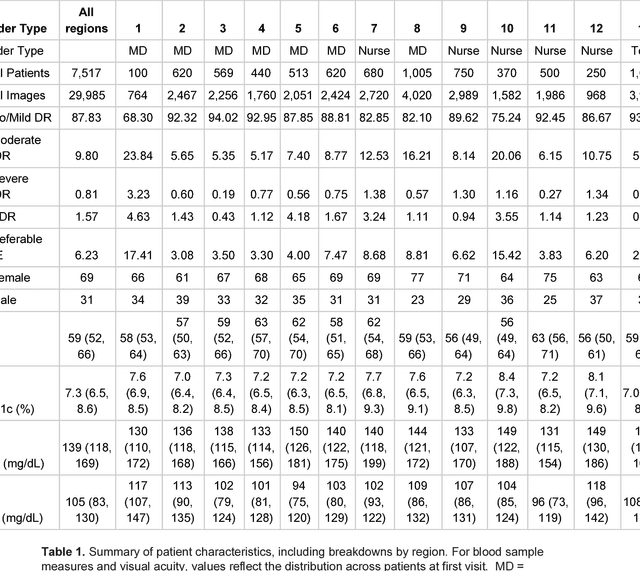
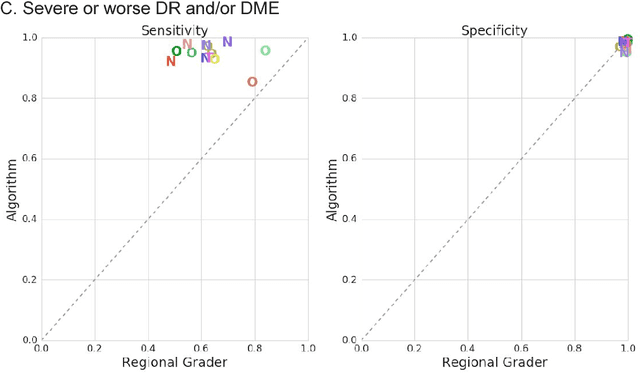
Deep learning algorithms have been used to detect diabetic retinopathy (DR) with specialist-level accuracy. This study aims to validate one such algorithm on a large-scale clinical population, and compare the algorithm performance with that of human graders. 25,326 gradable retinal images of patients with diabetes from the community-based, nation-wide screening program of DR in Thailand were analyzed for DR severity and referable diabetic macular edema (DME). Grades adjudicated by a panel of international retinal specialists served as the reference standard. Across different severity levels of DR for determining referable disease, deep learning significantly reduced the false negative rate (by 23%) at the cost of slightly higher false positive rates (2%). Deep learning algorithms may serve as a valuable tool for DR screening.