 Add to Chrome
 Add to Firefox
 Add to Edge
Preserving Product Fidelity in Large Scale Image Recontextualization with Diffusion Models
Mar 11, 2025


We present a framework for high-fidelity product image recontextualization using text-to-image diffusion models and a novel data augmentation pipeline. This pipeline leverages image-to-video diffusion, in/outpainting & negatives to create synthetic training data, addressing limitations of real-world data collection for this task. Our method improves the quality and diversity of generated images by disentangling product representations and enhancing the model's understanding of product characteristics. Evaluation on the ABO dataset and a private product dataset, using automated metrics and human assessment, demonstrates the effectiveness of our framework in generating realistic and compelling product visualizations, with implications for applications such as e-commerce and virtual product showcasing.
Evolving symbolic density functionals
Mar 25, 2022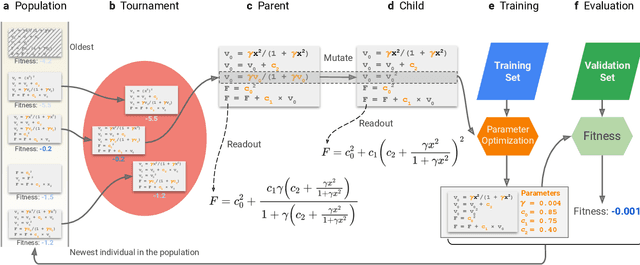
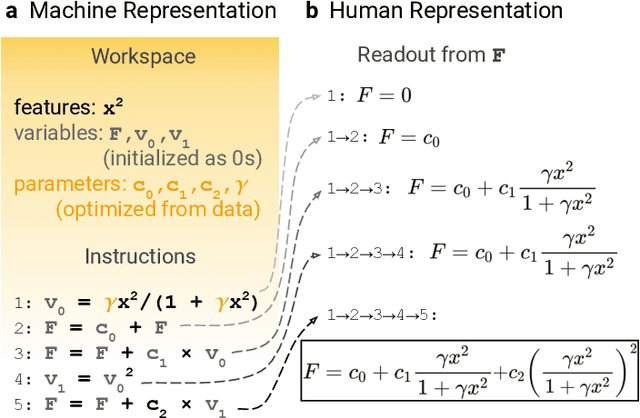
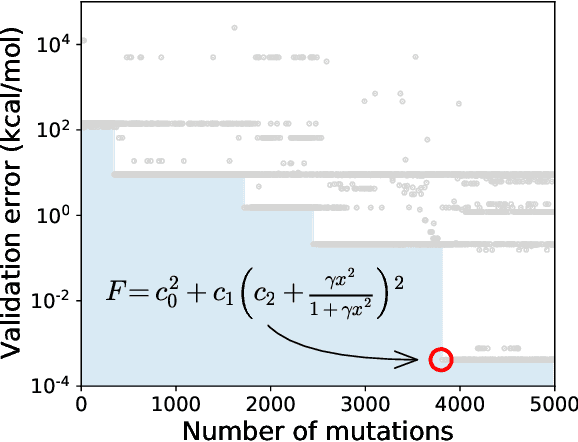
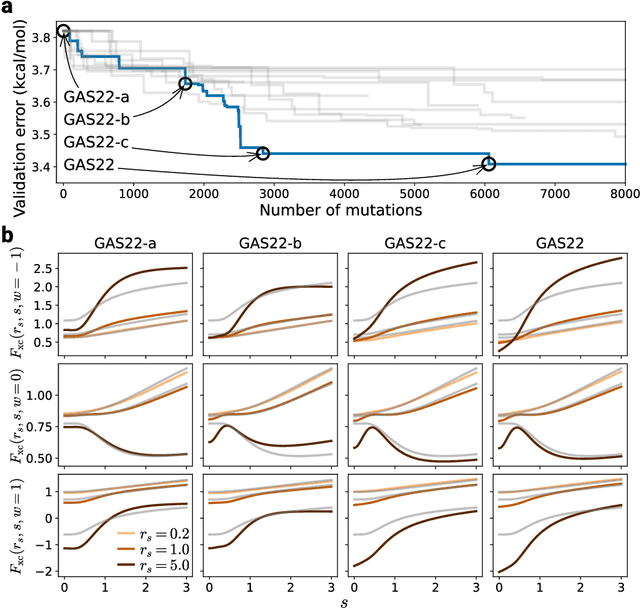
Systematic development of accurate density functionals has been a decades-long challenge for scientists. Despite the emerging application of machine learning (ML) in approximating functionals, the resulting ML functionals usually contain more than tens of thousands parameters, which makes a huge gap in the formulation with the conventional human-designed symbolic functionals. We propose a new framework, Symbolic Functional Evolutionary Search (SyFES), that automatically constructs accurate functionals in the symbolic form, which is more explainable to humans, cheaper to evaluate, and easier to integrate to existing density functional theory codes than other ML functionals. We first show that without prior knowledge, SyFES reconstructed a known functional from scratch. We then demonstrate that evolving from an existing functional $\omega$B97M-V, SyFES found a new functional, GAS22 (Google Accelerated Science 22), that performs better on main-group chemistry. Our framework opens a new direction in leveraging computing power for the systematic development of symbolic density functionals.
Scientific Discovery by Generating Counterfactuals using Image Translation
Jul 10, 2020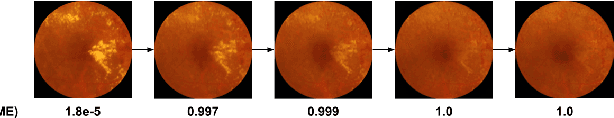
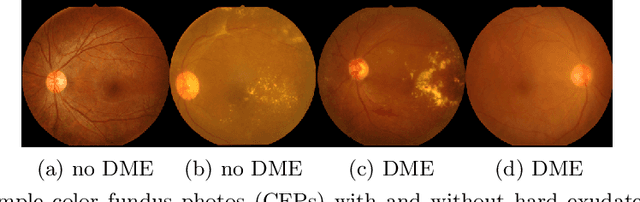
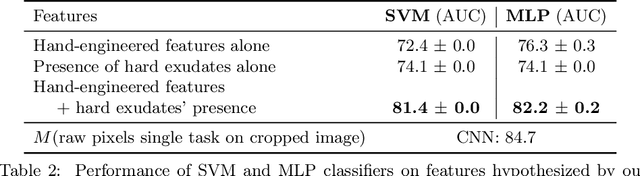
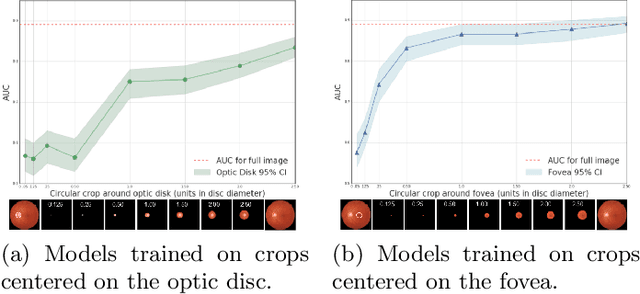
Model explanation techniques play a critical role in understanding the source of a model's performance and making its decisions transparent. Here we investigate if explanation techniques can also be used as a mechanism for scientific discovery. We make three contributions: first, we propose a framework to convert predictions from explanation techniques to a mechanism of discovery. Second, we show how generative models in combination with black-box predictors can be used to generate hypotheses (without human priors) that can be critically examined. Third, with these techniques we study classification models for retinal images predicting Diabetic Macular Edema (DME), where recent work showed that a CNN trained on these images is likely learning novel features in the image. We demonstrate that the proposed framework is able to explain the underlying scientific mechanism, thus bridging the gap between the model's performance and human understanding.
* Accepted at MICCAI 2020. This version combines camera-ready and supplement
It's easy to fool yourself: Case studies on identifying bias and confounding in bio-medical datasets
Dec 12, 2019
Confounding variables are a well known source of nuisance in biomedical studies. They present an even greater challenge when we combine them with black-box machine learning techniques that operate on raw data. This work presents two case studies. In one, we discovered biases arising from systematic errors in the data generation process. In the other, we found a spurious source of signal unrelated to the prediction task at hand. In both cases, our prediction models performed well but under careful examination hidden confounders and biases were revealed. These are cautionary tales on the limits of using machine learning techniques on raw data from scientific experiments.
Predicting optical coherence tomography-derived diabetic macular edema grades from fundus photographs using deep learning
Oct 18, 2018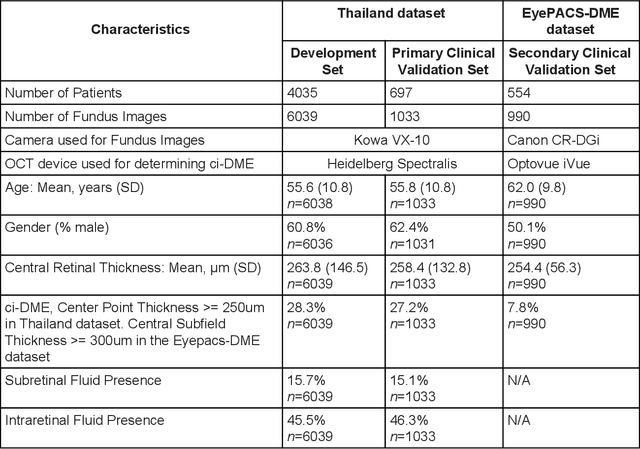
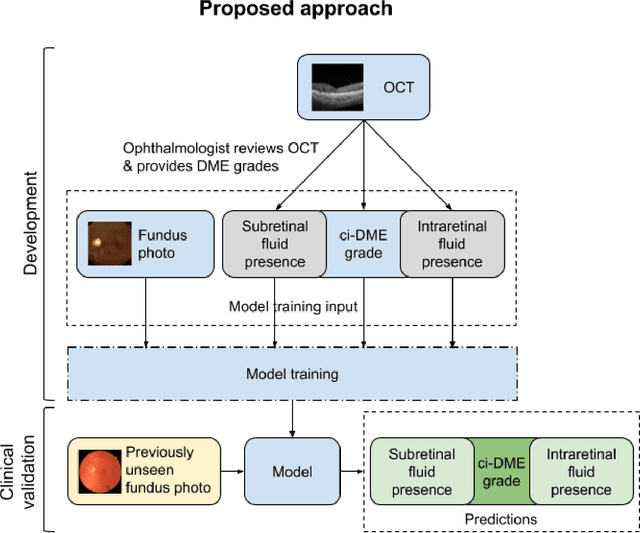
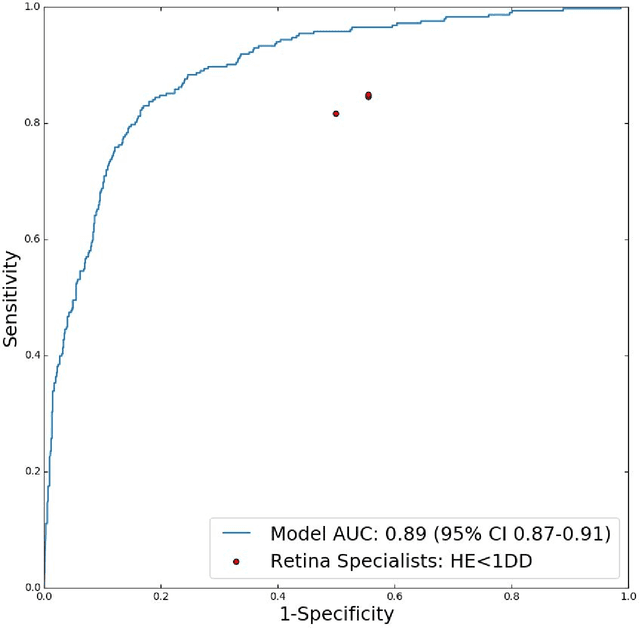
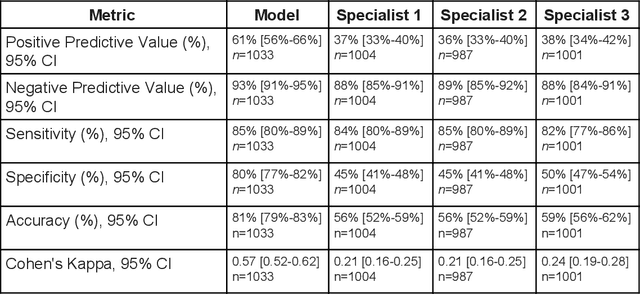
Diabetic eye disease is one of the fastest growing causes of preventable blindness. With the advent of anti-VEGF (vascular endothelial growth factor) therapies, it has become increasingly important to detect center-involved diabetic macular edema. However, center-involved diabetic macular edema is diagnosed using optical coherence tomography (OCT), which is not generally available at screening sites because of cost and workflow constraints. Instead, screening programs rely on the detection of hard exudates as a proxy for DME on color fundus photographs, often resulting in high false positive or false negative calls. To improve the accuracy of DME screening, we trained a deep learning model to use color fundus photographs to predict DME grades derived from OCT exams. Our "OCT-DME" model had an AUC of 0.89 (95% CI: 0.87-0.91), which corresponds to a sensitivity of 85% at a specificity of 80%. In comparison, three retinal specialists had similar sensitivities (82-85%), but only half the specificity (45-50%, p<0.001 for each comparison with model). The positive predictive value (PPV) of the OCT-DME model was 61% (95% CI: 56-66%), approximately double the 36-38% by the retina specialists. In addition, we used saliency and other techniques to examine how the model is making its prediction. The ability of deep learning algorithms to make clinically relevant predictions that generally require sophisticated 3D-imaging equipment from simple 2D images has broad relevance to many other applications in medical imaging.