 Add to Chrome
 Add to Firefox
 Add to Edge
Predicting Risk of Developing Diabetic Retinopathy using Deep Learning
Aug 10, 2020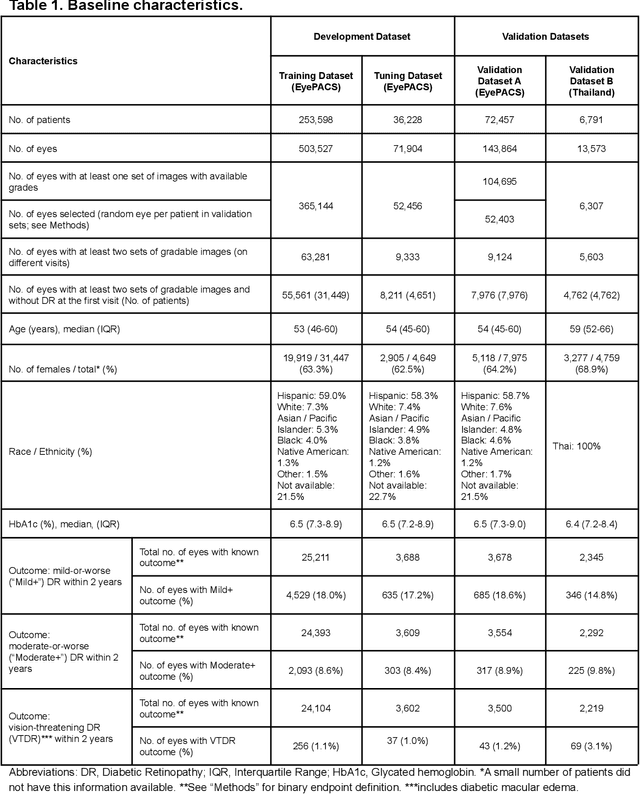
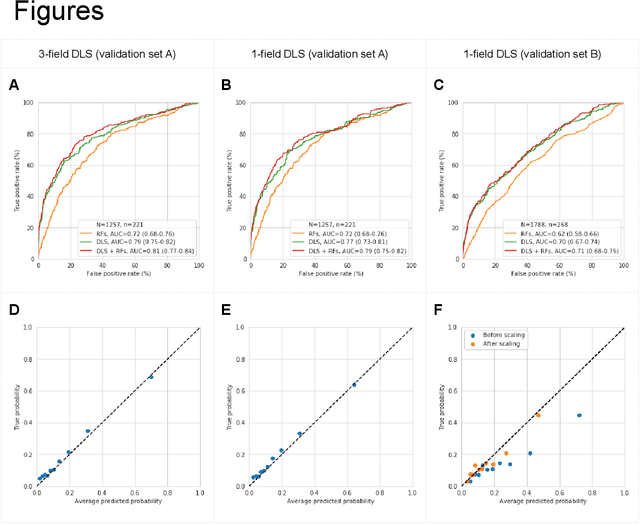
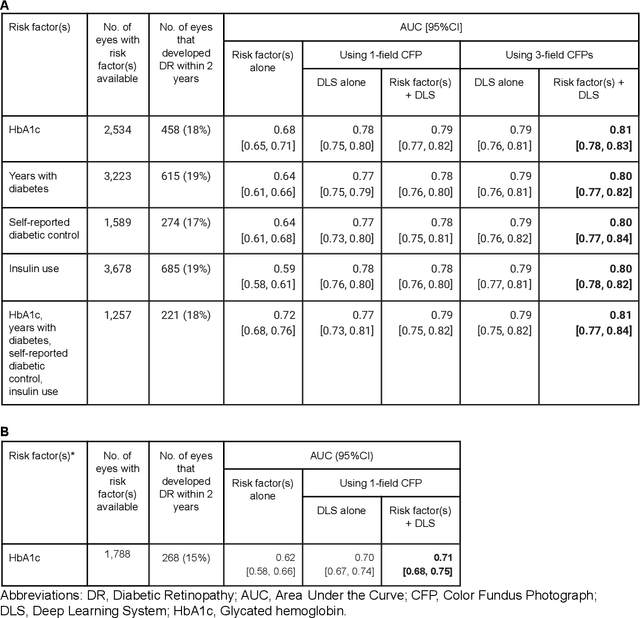
Diabetic retinopathy (DR) screening is instrumental in preventing blindness, but faces a scaling challenge as the number of diabetic patients rises. Risk stratification for the development of DR may help optimize screening intervals to reduce costs while improving vision-related outcomes. We created and validated two versions of a deep learning system (DLS) to predict the development of mild-or-worse ("Mild+") DR in diabetic patients undergoing DR screening. The two versions used either three-fields or a single field of color fundus photographs (CFPs) as input. The training set was derived from 575,431 eyes, of which 28,899 had known 2-year outcome, and the remaining were used to augment the training process via multi-task learning. Validation was performed on both an internal validation set (set A; 7,976 eyes; 3,678 with known outcome) and an external validation set (set B; 4,762 eyes; 2,345 with known outcome). For predicting 2-year development of DR, the 3-field DLS had an area under the receiver operating characteristic curve (AUC) of 0.79 (95%CI, 0.78-0.81) on validation set A. On validation set B (which contained only a single field), the 1-field DLS's AUC was 0.70 (95%CI, 0.67-0.74). The DLS was prognostic even after adjusting for available risk factors (p<0.001). When added to the risk factors, the 3-field DLS improved the AUC from 0.72 (95%CI, 0.68-0.76) to 0.81 (95%CI, 0.77-0.84) in validation set A, and the 1-field DLS improved the AUC from 0.62 (95%CI, 0.58-0.66) to 0.71 (95%CI, 0.68-0.75) in validation set B. The DLSs in this study identified prognostic information for DR development from CFPs. This information is independent of and more informative than the available risk factors.
Predicting Progression of Age-related Macular Degeneration from Fundus Images using Deep Learning
Apr 10, 2019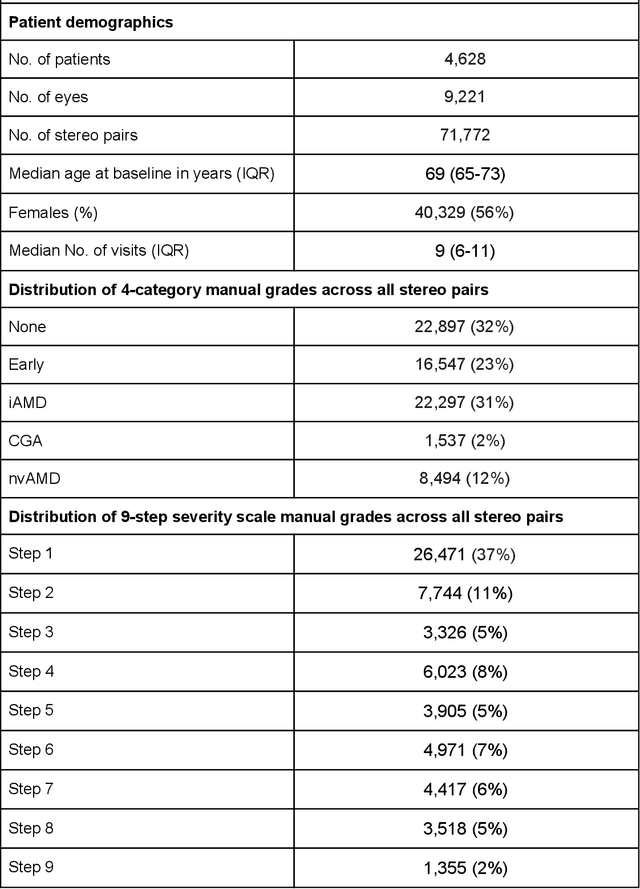
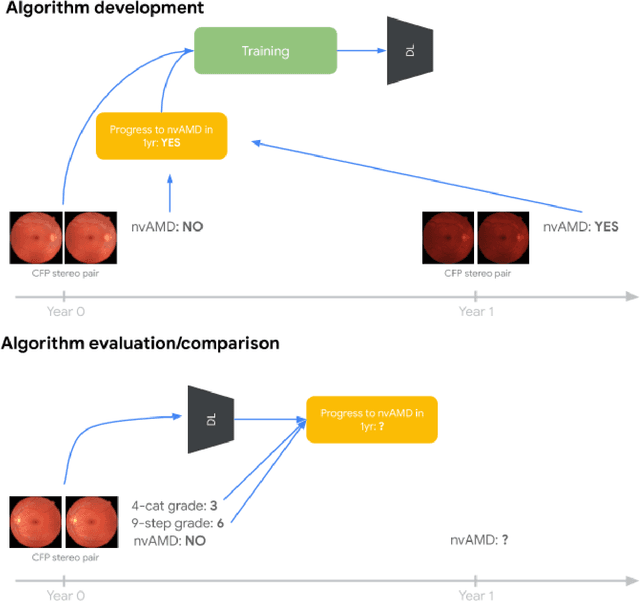
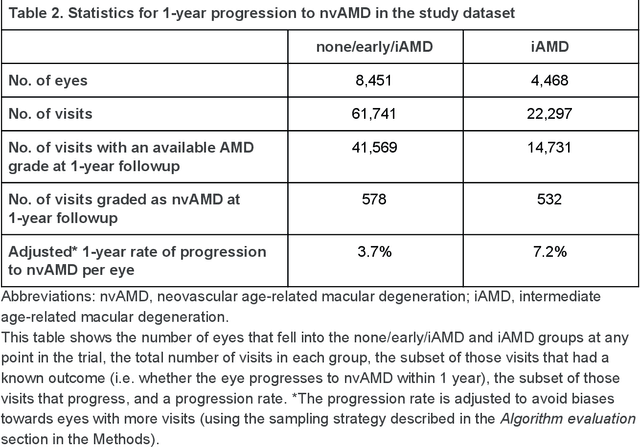
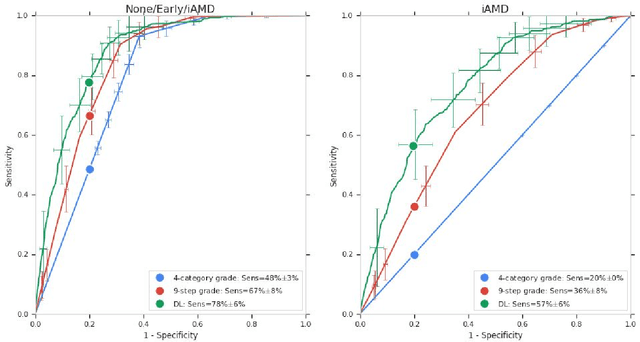
Background: Patients with neovascular age-related macular degeneration (AMD) can avoid vision loss via certain therapy. However, methods to predict the progression to neovascular age-related macular degeneration (nvAMD) are lacking. Purpose: To develop and validate a deep learning (DL) algorithm to predict 1-year progression of eyes with no, early, or intermediate AMD to nvAMD, using color fundus photographs (CFP). Design: Development and validation of a DL algorithm. Methods: We trained a DL algorithm to predict 1-year progression to nvAMD, and used 10-fold cross-validation to evaluate this approach on two groups of eyes in the Age-Related Eye Disease Study (AREDS): none/early/intermediate AMD, and intermediate AMD (iAMD) only. We compared the DL algorithm to the manually graded 4-category and 9-step scales in the AREDS dataset. Main outcome measures: Performance of the DL algorithm was evaluated using the sensitivity at 80% specificity for progression to nvAMD. Results: The DL algorithm's sensitivity for predicting progression to nvAMD from none/early/iAMD (78+/-6%) was higher than manual grades from the 9-step scale (67+/-8%) or the 4-category scale (48+/-3%). For predicting progression specifically from iAMD, the DL algorithm's sensitivity (57+/-6%) was also higher compared to the 9-step grades (36+/-8%) and the 4-category grades (20+/-0%). Conclusions: Our DL algorithm performed better in predicting progression to nvAMD than manual grades. Future investigations are required to test the application of this DL algorithm in a real-world clinical setting.