 Add to Chrome
 Add to Firefox
 Add to Edge
Improved Multimodal Fusion for Small Datasets with Auxiliary Supervision
Apr 01, 2023Prostate cancer is one of the leading causes of cancer-related death in men worldwide. Like many cancers, diagnosis involves expert integration of heterogeneous patient information such as imaging, clinical risk factors, and more. For this reason, there have been many recent efforts toward deep multimodal fusion of image and non-image data for clinical decision tasks. Many of these studies propose methods to fuse learned features from each patient modality, providing significant downstream improvements with techniques like cross-modal attention gating, Kronecker product fusion, orthogonality regularization, and more. While these enhanced fusion operations can improve upon feature concatenation, they often come with an extremely high learning capacity, meaning they are likely to overfit when applied even to small or low-dimensional datasets. Rather than designing a highly expressive fusion operation, we propose three simple methods for improved multimodal fusion with small datasets that aid optimization by generating auxiliary sources of supervision during training: extra supervision, clinical prediction, and dense fusion. We validate the proposed approaches on prostate cancer diagnosis from paired histopathology imaging and tabular clinical features. The proposed methods are straightforward to implement and can be applied to any classification task with paired image and non-image data.
Detecting hidden signs of diabetes in external eye photographs
Nov 23, 2020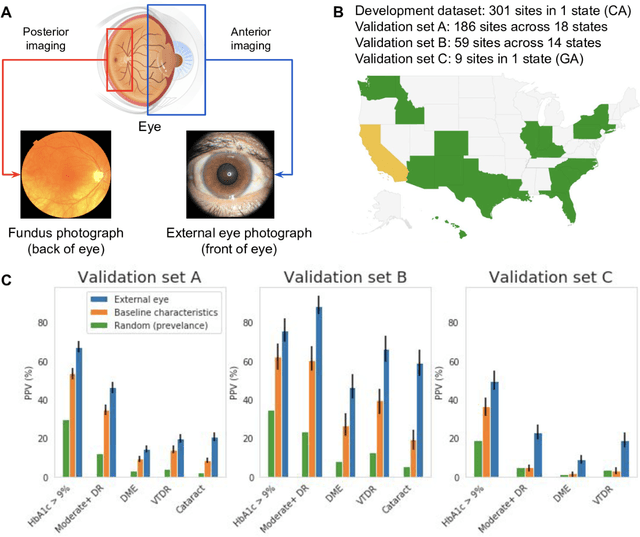
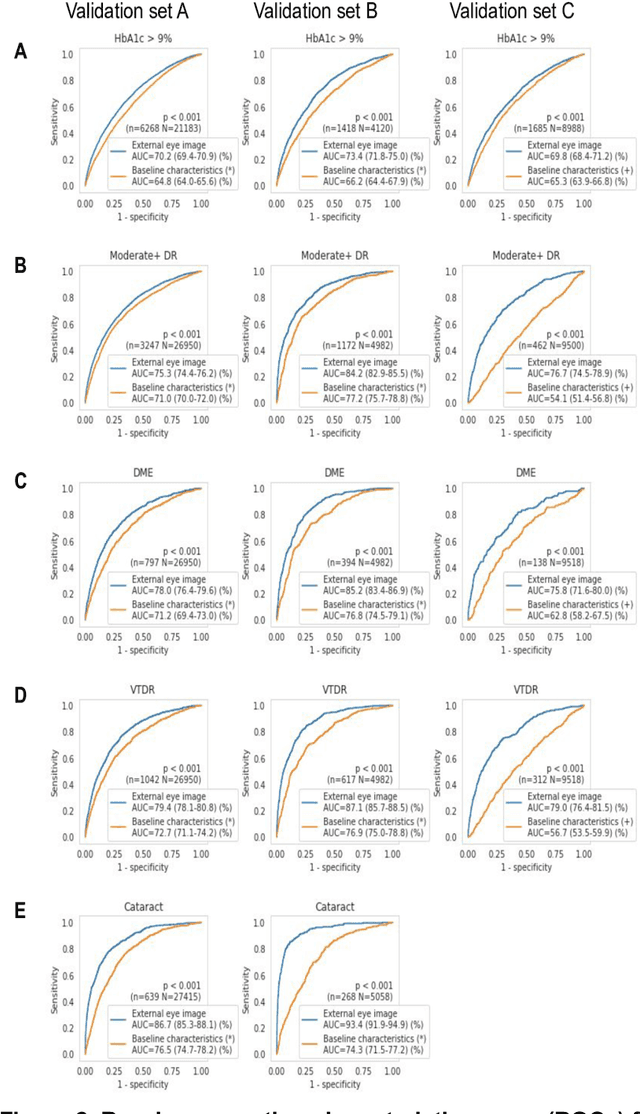
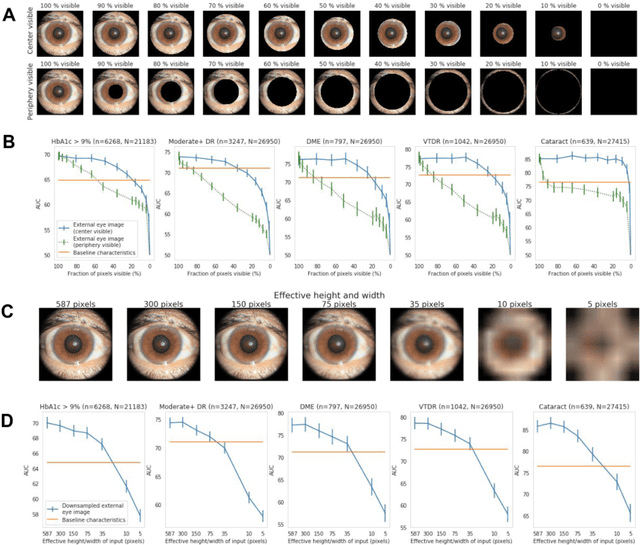
Diabetes-related retinal conditions can be detected by examining the posterior of the eye. By contrast, examining the anterior of the eye can reveal conditions affecting the front of the eye, such as changes to the eyelids, cornea, or crystalline lens. In this work, we studied whether external photographs of the front of the eye can reveal insights into both diabetic retinal diseases and blood glucose control. We developed a deep learning system (DLS) using external eye photographs of 145,832 patients with diabetes from 301 diabetic retinopathy (DR) screening sites in one US state, and evaluated the DLS on three validation sets containing images from 198 sites in 18 other US states. In validation set A (n=27,415 patients, all undilated), the DLS detected poor blood glucose control (HbA1c > 9%) with an area under receiver operating characteristic curve (AUC) of 70.2; moderate-or-worse DR with an AUC of 75.3; diabetic macular edema with an AUC of 78.0; and vision-threatening DR with an AUC of 79.4. For all 4 prediction tasks, the DLS's AUC was higher (p<0.001) than using available self-reported baseline characteristics (age, sex, race/ethnicity, years with diabetes). In terms of positive predictive value, the predicted top 5% of patients had a 67% chance of having HbA1c > 9%, and a 20% chance of having vision threatening diabetic retinopathy. The results generalized to dilated pupils (validation set B, 5,058 patients) and to a different screening service (validation set C, 10,402 patients). Our results indicate that external eye photographs contain information useful for healthcare providers managing patients with diabetes, and may help prioritize patients for in-person screening. Further work is needed to validate these findings on different devices and patient populations (those without diabetes) to evaluate its utility for remote diagnosis and management.
Underspecification Presents Challenges for Credibility in Modern Machine Learning
Nov 06, 2020

ML models often exhibit unexpectedly poor behavior when they are deployed in real-world domains. We identify underspecification as a key reason for these failures. An ML pipeline is underspecified when it can return many predictors with equivalently strong held-out performance in the training domain. Underspecification is common in modern ML pipelines, such as those based on deep learning. Predictors returned by underspecified pipelines are often treated as equivalent based on their training domain performance, but we show here that such predictors can behave very differently in deployment domains. This ambiguity can lead to instability and poor model behavior in practice, and is a distinct failure mode from previously identified issues arising from structural mismatch between training and deployment domains. We show that this problem appears in a wide variety of practical ML pipelines, using examples from computer vision, medical imaging, natural language processing, clinical risk prediction based on electronic health records, and medical genomics. Our results show the need to explicitly account for underspecification in modeling pipelines that are intended for real-world deployment in any domain.
Improving Medical Annotation Quality to Decrease Labeling Burden Using Stratified Noisy Cross-Validation
Sep 22, 2020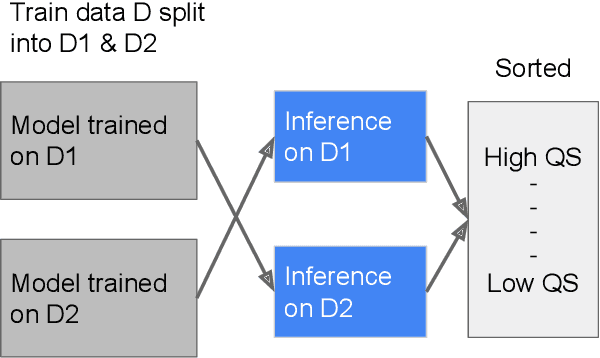
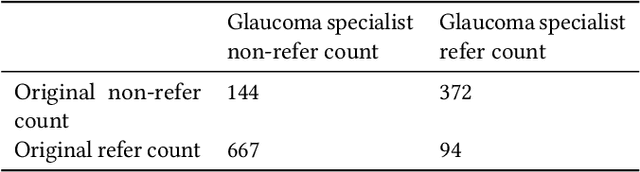
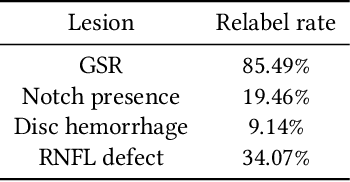
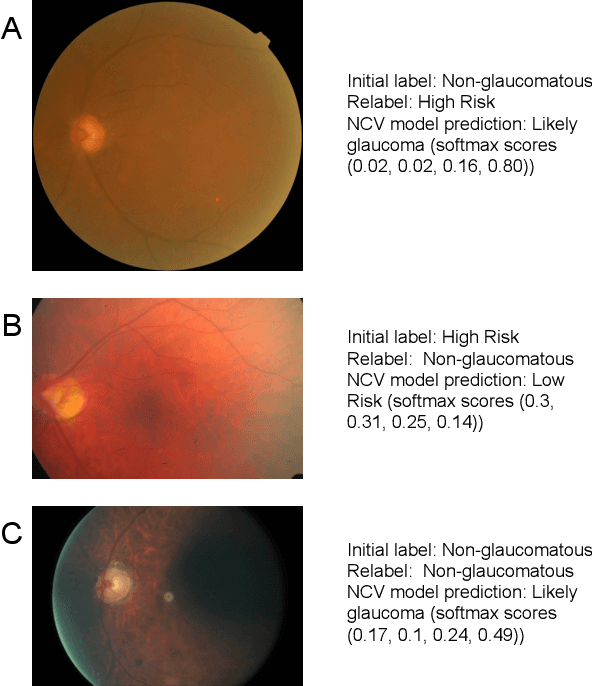
As machine learning has become increasingly applied to medical imaging data, noise in training labels has emerged as an important challenge. Variability in diagnosis of medical images is well established; in addition, variability in training and attention to task among medical labelers may exacerbate this issue. Methods for identifying and mitigating the impact of low quality labels have been studied, but are not well characterized in medical imaging tasks. For instance, Noisy Cross-Validation splits the training data into halves, and has been shown to identify low-quality labels in computer vision tasks; but it has not been applied to medical imaging tasks specifically. In this work we introduce Stratified Noisy Cross-Validation (SNCV), an extension of noisy cross validation. SNCV can provide estimates of confidence in model predictions by assigning a quality score to each example; stratify labels to handle class imbalance; and identify likely low-quality labels to analyze the causes. We assess performance of SNCV on diagnosis of glaucoma suspect risk from retinal fundus photographs, a clinically important yet nuanced labeling task. Using training data from a previously-published deep learning model, we compute a continuous quality score (QS) for each training example. We relabel 1,277 low-QS examples using a trained glaucoma specialist; the new labels agree with the SNCV prediction over the initial label >85% of the time, indicating that low-QS examples mostly reflect labeler errors. We then quantify the impact of training with only high-QS labels, showing that strong model performance may be obtained with many fewer examples. By applying the method to randomly sub-sampled training dataset, we show that our method can reduce labelling burden by approximately 50% while achieving model performance non-inferior to using the full dataset on multiple held-out test sets.
Predicting Risk of Developing Diabetic Retinopathy using Deep Learning
Aug 10, 2020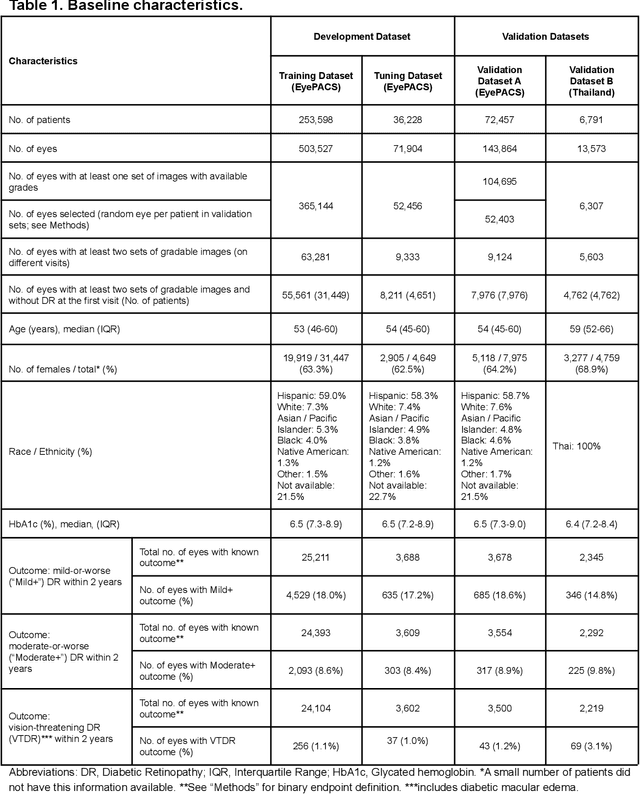
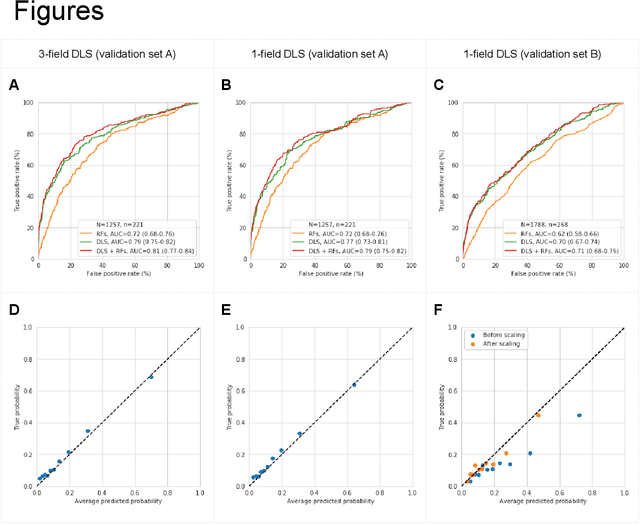
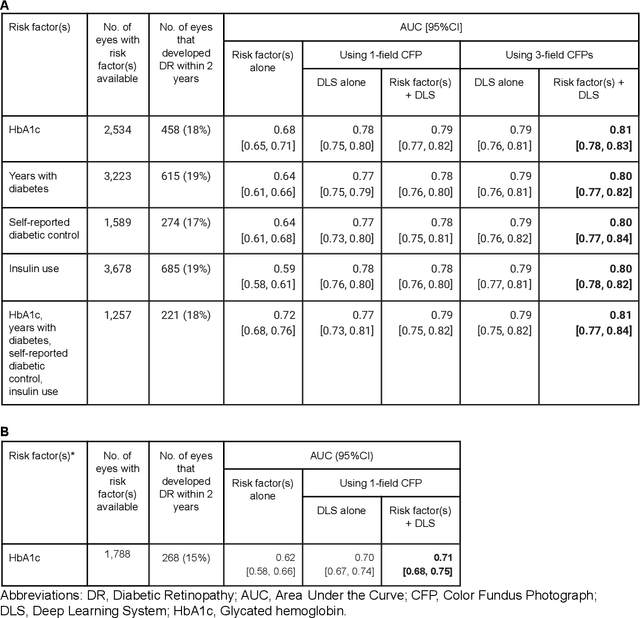
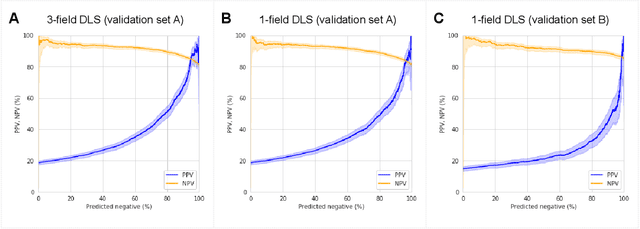
Diabetic retinopathy (DR) screening is instrumental in preventing blindness, but faces a scaling challenge as the number of diabetic patients rises. Risk stratification for the development of DR may help optimize screening intervals to reduce costs while improving vision-related outcomes. We created and validated two versions of a deep learning system (DLS) to predict the development of mild-or-worse ("Mild+") DR in diabetic patients undergoing DR screening. The two versions used either three-fields or a single field of color fundus photographs (CFPs) as input. The training set was derived from 575,431 eyes, of which 28,899 had known 2-year outcome, and the remaining were used to augment the training process via multi-task learning. Validation was performed on both an internal validation set (set A; 7,976 eyes; 3,678 with known outcome) and an external validation set (set B; 4,762 eyes; 2,345 with known outcome). For predicting 2-year development of DR, the 3-field DLS had an area under the receiver operating characteristic curve (AUC) of 0.79 (95%CI, 0.78-0.81) on validation set A. On validation set B (which contained only a single field), the 1-field DLS's AUC was 0.70 (95%CI, 0.67-0.74). The DLS was prognostic even after adjusting for available risk factors (p<0.001). When added to the risk factors, the 3-field DLS improved the AUC from 0.72 (95%CI, 0.68-0.76) to 0.81 (95%CI, 0.77-0.84) in validation set A, and the 1-field DLS improved the AUC from 0.62 (95%CI, 0.58-0.66) to 0.71 (95%CI, 0.68-0.75) in validation set B. The DLSs in this study identified prognostic information for DR development from CFPs. This information is independent of and more informative than the available risk factors.
Detecting Anemia from Retinal Fundus Images
Apr 12, 2019
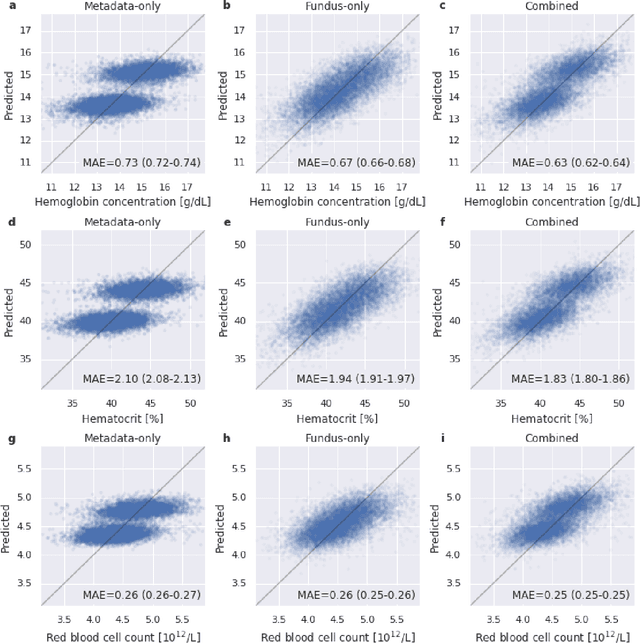
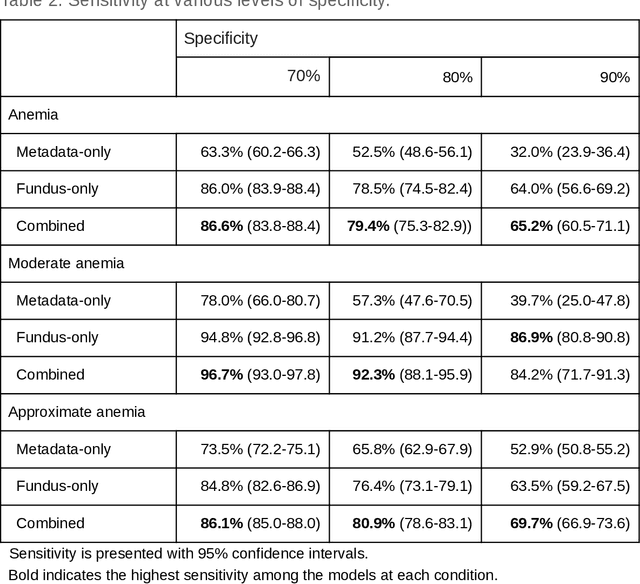
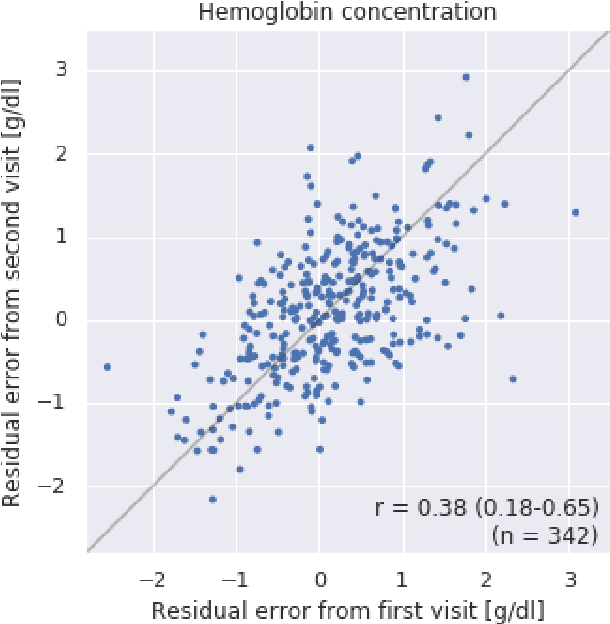
Despite its high prevalence, anemia is often undetected due to the invasiveness and cost of screening and diagnostic tests. Though some non-invasive approaches have been developed, they are less accurate than invasive methods, resulting in an unmet need for more accurate non-invasive methods. Here, we show that deep learning-based algorithms can detect anemia and quantify several related blood measurements using retinal fundus images both in isolation and in combination with basic metadata such as patient demographics. On a validation dataset of 11,388 patients from the UK Biobank, our algorithms achieved a mean absolute error of 0.63 g/dL (95% confidence interval (CI) 0.62-0.64) in quantifying hemoglobin concentration and an area under receiver operating characteristic curve (AUC) of 0.88 (95% CI 0.86-0.89) in detecting anemia. This work shows the potential of automated non-invasive anemia screening based on fundus images, particularly in diabetic patients, who may have regular retinal imaging and are at increased risk of further morbidity and mortality from anemia.