 Add to Chrome
 Add to Firefox
 Add to Edge
Advancing Multimodal Medical Capabilities of Gemini
May 06, 2024


Many clinical tasks require an understanding of specialized data, such as medical images and genomics, which is not typically found in general-purpose large multimodal models. Building upon Gemini's multimodal models, we develop several models within the new Med-Gemini family that inherit core capabilities of Gemini and are optimized for medical use via fine-tuning with 2D and 3D radiology, histopathology, ophthalmology, dermatology and genomic data. Med-Gemini-2D sets a new standard for AI-based chest X-ray (CXR) report generation based on expert evaluation, exceeding previous best results across two separate datasets by an absolute margin of 1% and 12%, where 57% and 96% of AI reports on normal cases, and 43% and 65% on abnormal cases, are evaluated as "equivalent or better" than the original radiologists' reports. We demonstrate the first ever large multimodal model-based report generation for 3D computed tomography (CT) volumes using Med-Gemini-3D, with 53% of AI reports considered clinically acceptable, although additional research is needed to meet expert radiologist reporting quality. Beyond report generation, Med-Gemini-2D surpasses the previous best performance in CXR visual question answering (VQA) and performs well in CXR classification and radiology VQA, exceeding SoTA or baselines on 17 of 20 tasks. In histopathology, ophthalmology, and dermatology image classification, Med-Gemini-2D surpasses baselines across 18 out of 20 tasks and approaches task-specific model performance. Beyond imaging, Med-Gemini-Polygenic outperforms the standard linear polygenic risk score-based approach for disease risk prediction and generalizes to genetically correlated diseases for which it has never been trained. Although further development and evaluation are necessary in the safety-critical medical domain, our results highlight the potential of Med-Gemini across a wide range of medical tasks.
Discovering novel systemic biomarkers in photos of the external eye
Jul 19, 2022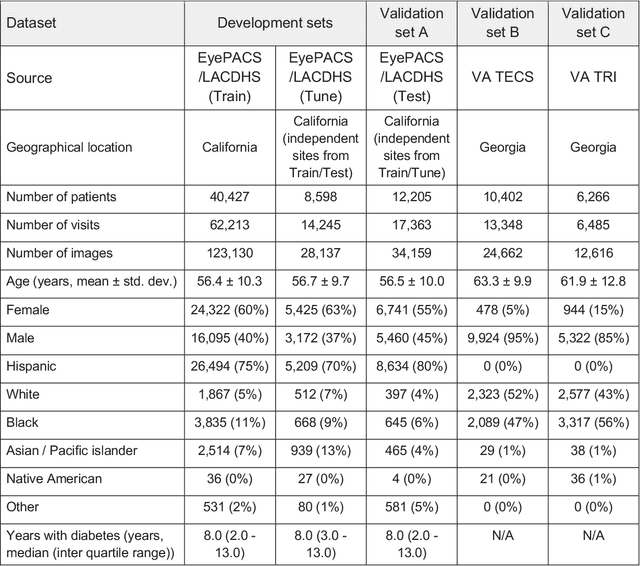
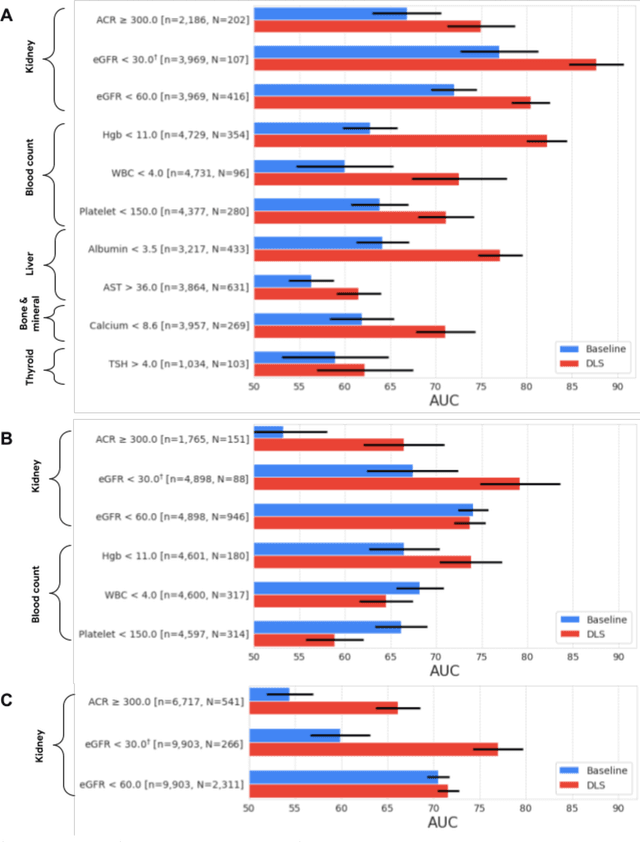
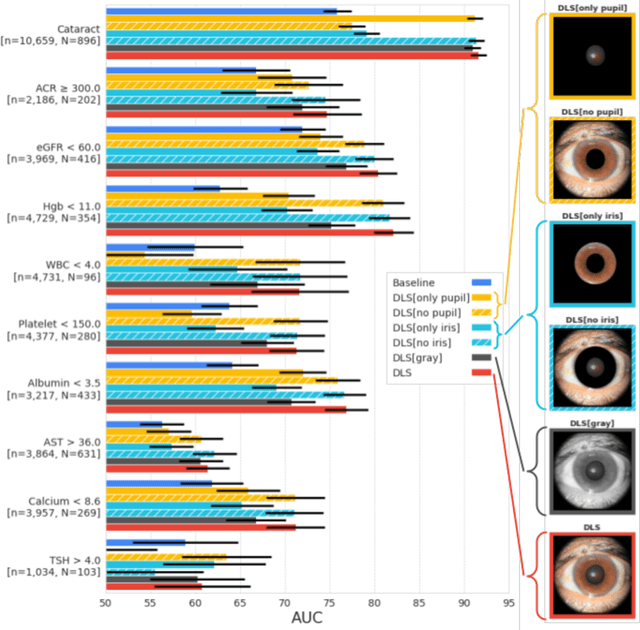
External eye photos were recently shown to reveal signs of diabetic retinal disease and elevated HbA1c. In this paper, we evaluate if external eye photos contain information about additional systemic medical conditions. We developed a deep learning system (DLS) that takes external eye photos as input and predicts multiple systemic parameters, such as those related to the liver (albumin, AST); kidney (eGFR estimated using the race-free 2021 CKD-EPI creatinine equation, the urine ACR); bone & mineral (calcium); thyroid (TSH); and blood count (Hgb, WBC, platelets). Development leveraged 151,237 images from 49,015 patients with diabetes undergoing diabetic eye screening in 11 sites across Los Angeles county, CA. Evaluation focused on 9 pre-specified systemic parameters and leveraged 3 validation sets (A, B, C) spanning 28,869 patients with and without diabetes undergoing eye screening in 3 independent sites in Los Angeles County, CA, and the greater Atlanta area, GA. We compared against baseline models incorporating available clinicodemographic variables (e.g. age, sex, race/ethnicity, years with diabetes). Relative to the baseline, the DLS achieved statistically significant superior performance at detecting AST>36, calcium<8.6, eGFR<60, Hgb<11, platelets<150, ACR>=300, and WBC<4 on validation set A (a patient population similar to the development sets), where the AUC of DLS exceeded that of the baseline by 5.2-19.4%. On validation sets B and C, with substantial patient population differences compared to the development sets, the DLS outperformed the baseline for ACR>=300 and Hgb<11 by 7.3-13.2%. Our findings provide further evidence that external eye photos contain important biomarkers of systemic health spanning multiple organ systems. Further work is needed to investigate whether and how these biomarkers can be translated into clinical impact.
Detecting hidden signs of diabetes in external eye photographs
Nov 23, 2020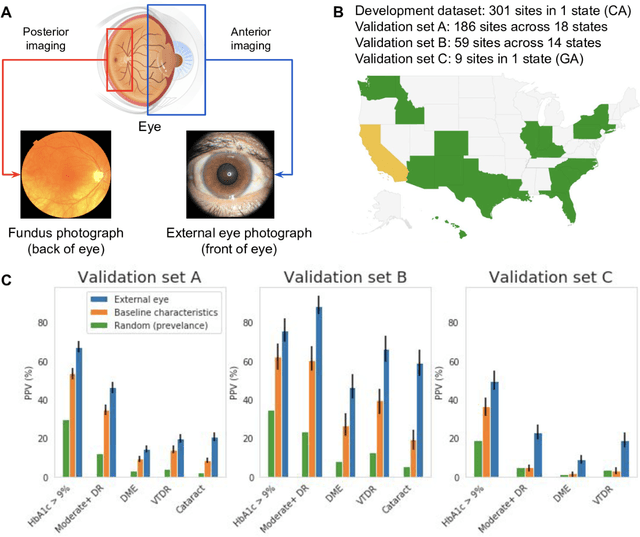
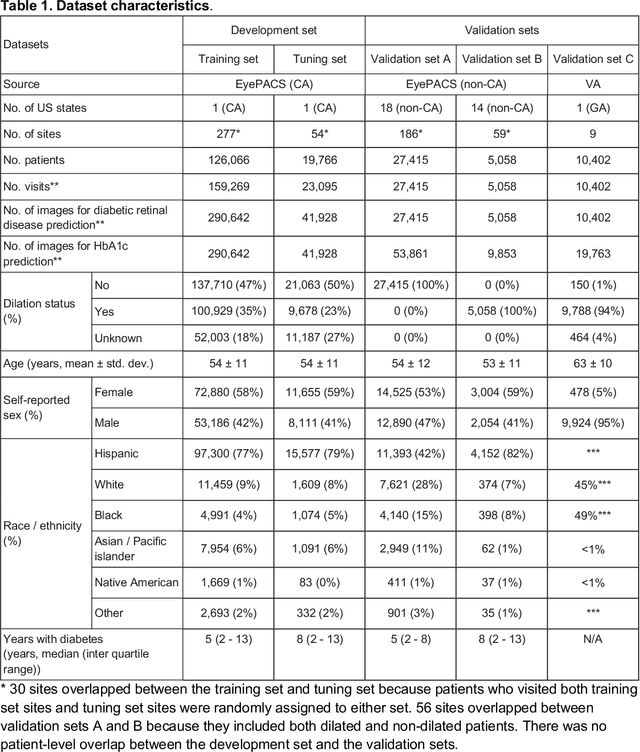
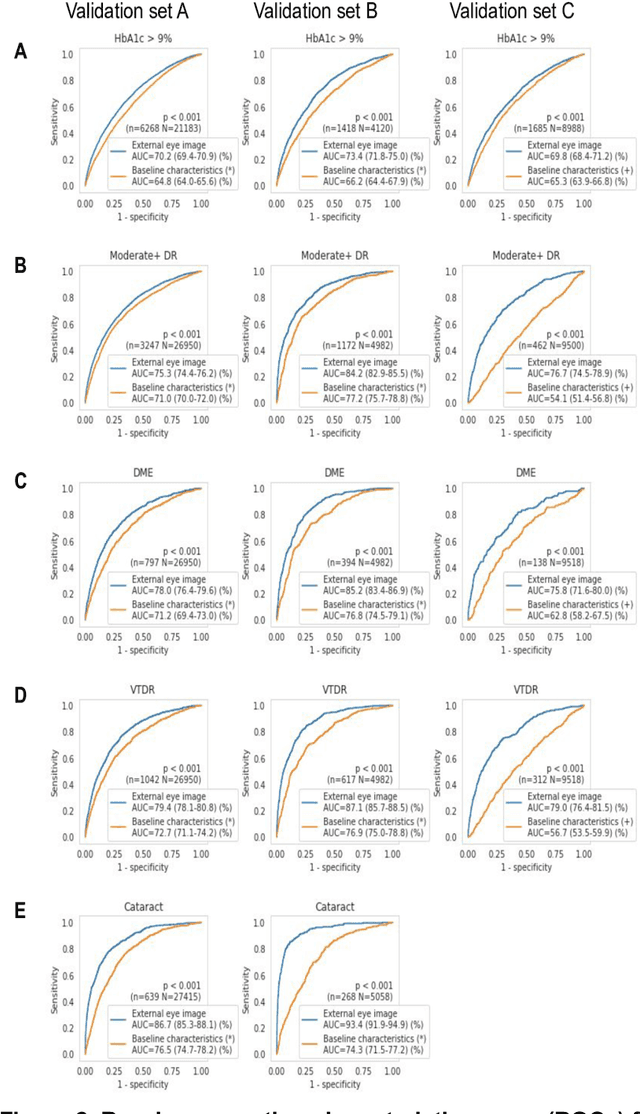
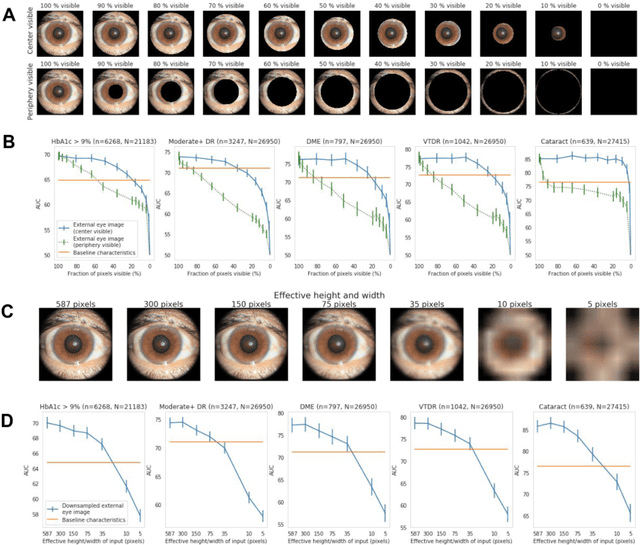
Diabetes-related retinal conditions can be detected by examining the posterior of the eye. By contrast, examining the anterior of the eye can reveal conditions affecting the front of the eye, such as changes to the eyelids, cornea, or crystalline lens. In this work, we studied whether external photographs of the front of the eye can reveal insights into both diabetic retinal diseases and blood glucose control. We developed a deep learning system (DLS) using external eye photographs of 145,832 patients with diabetes from 301 diabetic retinopathy (DR) screening sites in one US state, and evaluated the DLS on three validation sets containing images from 198 sites in 18 other US states. In validation set A (n=27,415 patients, all undilated), the DLS detected poor blood glucose control (HbA1c > 9%) with an area under receiver operating characteristic curve (AUC) of 70.2; moderate-or-worse DR with an AUC of 75.3; diabetic macular edema with an AUC of 78.0; and vision-threatening DR with an AUC of 79.4. For all 4 prediction tasks, the DLS's AUC was higher (p<0.001) than using available self-reported baseline characteristics (age, sex, race/ethnicity, years with diabetes). In terms of positive predictive value, the predicted top 5% of patients had a 67% chance of having HbA1c > 9%, and a 20% chance of having vision threatening diabetic retinopathy. The results generalized to dilated pupils (validation set B, 5,058 patients) and to a different screening service (validation set C, 10,402 patients). Our results indicate that external eye photographs contain information useful for healthcare providers managing patients with diabetes, and may help prioritize patients for in-person screening. Further work is needed to validate these findings on different devices and patient populations (those without diabetes) to evaluate its utility for remote diagnosis and management.
Predicting Risk of Developing Diabetic Retinopathy using Deep Learning
Aug 10, 2020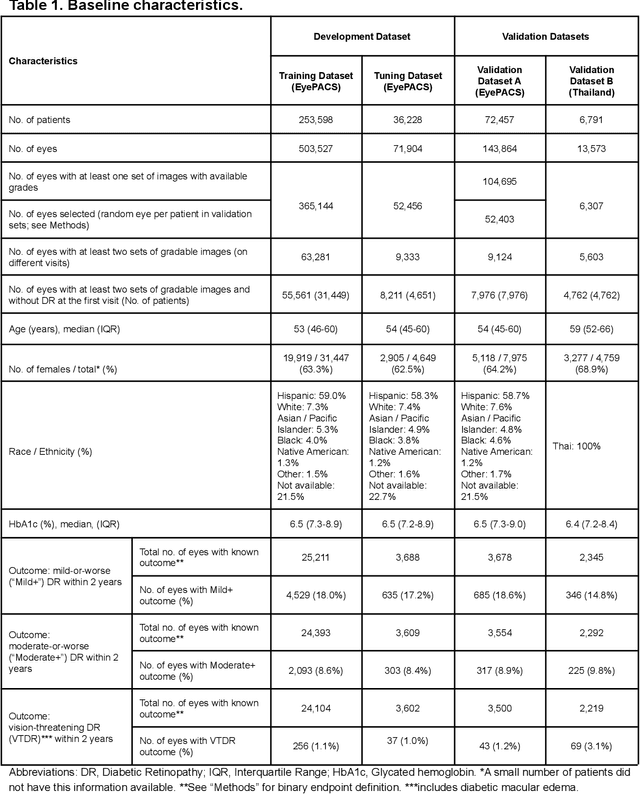
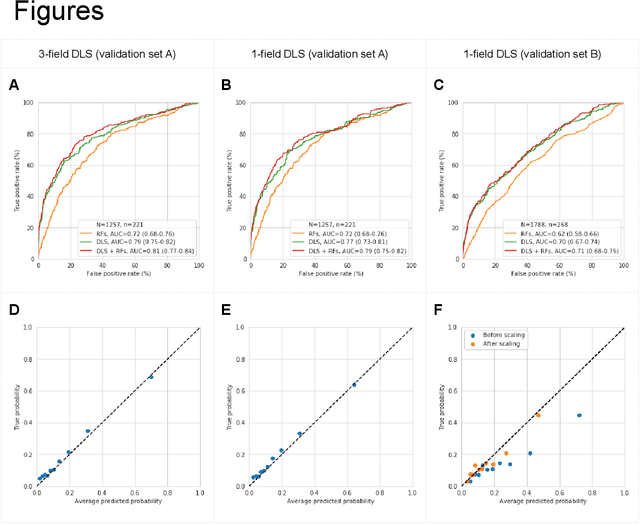
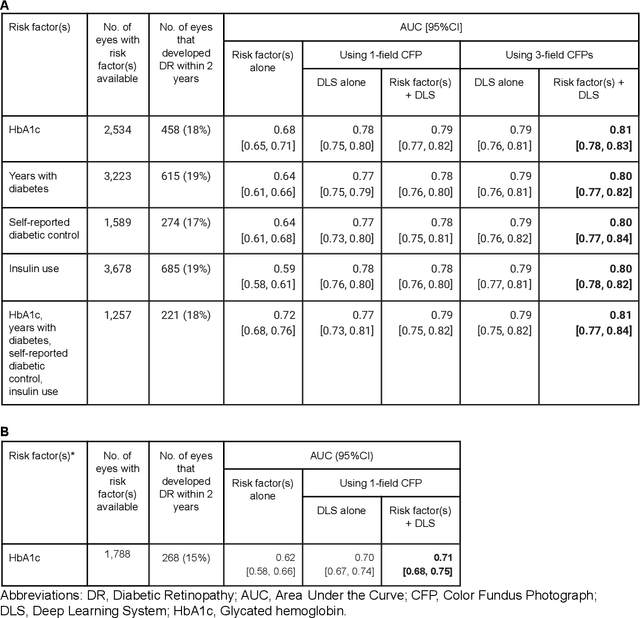
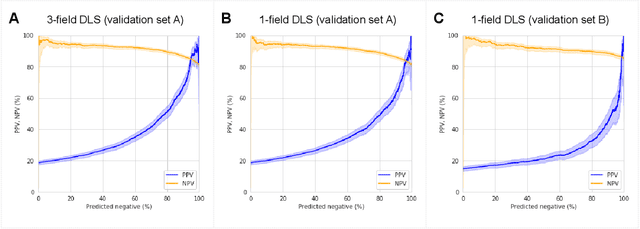
Diabetic retinopathy (DR) screening is instrumental in preventing blindness, but faces a scaling challenge as the number of diabetic patients rises. Risk stratification for the development of DR may help optimize screening intervals to reduce costs while improving vision-related outcomes. We created and validated two versions of a deep learning system (DLS) to predict the development of mild-or-worse ("Mild+") DR in diabetic patients undergoing DR screening. The two versions used either three-fields or a single field of color fundus photographs (CFPs) as input. The training set was derived from 575,431 eyes, of which 28,899 had known 2-year outcome, and the remaining were used to augment the training process via multi-task learning. Validation was performed on both an internal validation set (set A; 7,976 eyes; 3,678 with known outcome) and an external validation set (set B; 4,762 eyes; 2,345 with known outcome). For predicting 2-year development of DR, the 3-field DLS had an area under the receiver operating characteristic curve (AUC) of 0.79 (95%CI, 0.78-0.81) on validation set A. On validation set B (which contained only a single field), the 1-field DLS's AUC was 0.70 (95%CI, 0.67-0.74). The DLS was prognostic even after adjusting for available risk factors (p<0.001). When added to the risk factors, the 3-field DLS improved the AUC from 0.72 (95%CI, 0.68-0.76) to 0.81 (95%CI, 0.77-0.84) in validation set A, and the 1-field DLS improved the AUC from 0.62 (95%CI, 0.58-0.66) to 0.71 (95%CI, 0.68-0.75) in validation set B. The DLSs in this study identified prognostic information for DR development from CFPs. This information is independent of and more informative than the available risk factors.
Predicting optical coherence tomography-derived diabetic macular edema grades from fundus photographs using deep learning
Oct 18, 2018
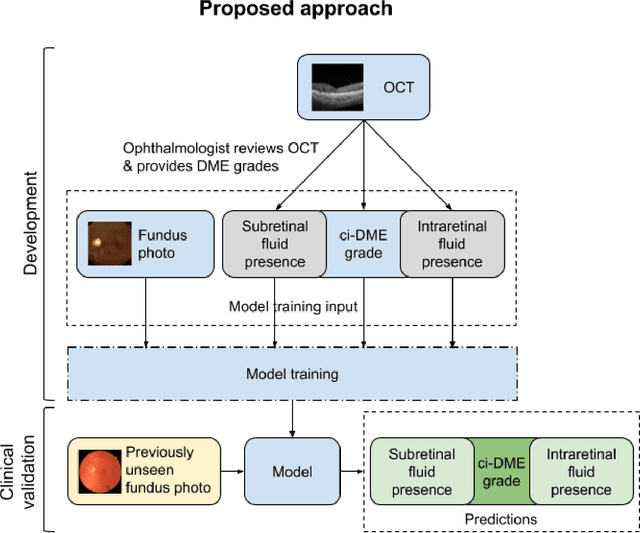
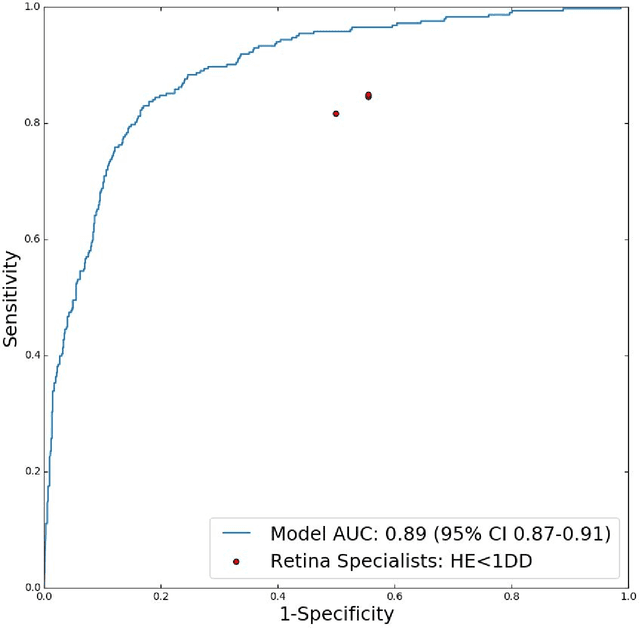
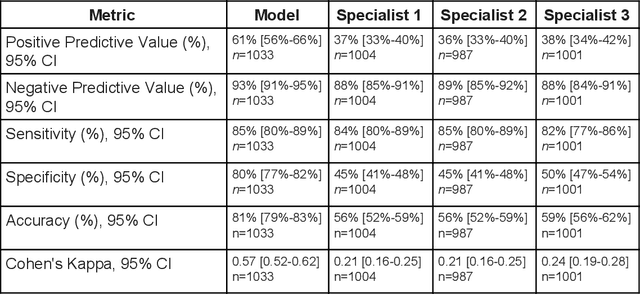
Diabetic eye disease is one of the fastest growing causes of preventable blindness. With the advent of anti-VEGF (vascular endothelial growth factor) therapies, it has become increasingly important to detect center-involved diabetic macular edema. However, center-involved diabetic macular edema is diagnosed using optical coherence tomography (OCT), which is not generally available at screening sites because of cost and workflow constraints. Instead, screening programs rely on the detection of hard exudates as a proxy for DME on color fundus photographs, often resulting in high false positive or false negative calls. To improve the accuracy of DME screening, we trained a deep learning model to use color fundus photographs to predict DME grades derived from OCT exams. Our "OCT-DME" model had an AUC of 0.89 (95% CI: 0.87-0.91), which corresponds to a sensitivity of 85% at a specificity of 80%. In comparison, three retinal specialists had similar sensitivities (82-85%), but only half the specificity (45-50%, p<0.001 for each comparison with model). The positive predictive value (PPV) of the OCT-DME model was 61% (95% CI: 56-66%), approximately double the 36-38% by the retina specialists. In addition, we used saliency and other techniques to examine how the model is making its prediction. The ability of deep learning algorithms to make clinically relevant predictions that generally require sophisticated 3D-imaging equipment from simple 2D images has broad relevance to many other applications in medical imaging.
Deep Learning for Automated Quality Assessment of Color Fundus Images in Diabetic Retinopathy Screening
Mar 07, 2017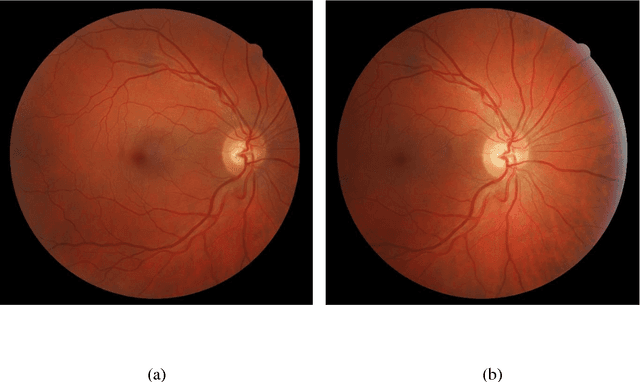
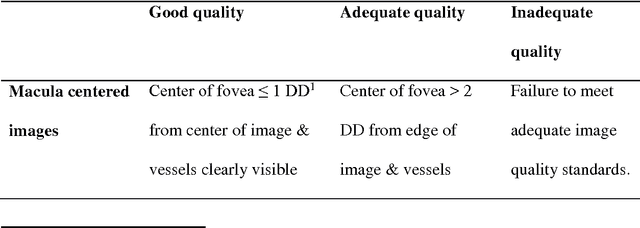
Purpose To develop a computer based method for the automated assessment of image quality in the context of diabetic retinopathy (DR) to guide the photographer. Methods A deep learning framework was trained to grade the images automatically. A large representative set of 7000 color fundus images were used for the experiment which were obtained from the EyePACS that were made available by the California Healthcare Foundation. Three retinal image analysis experts were employed to categorize these images into Accept and Reject classes based on the precise definition of image quality in the context of DR. A deep learning framework was trained using 3428 images. Results A total of 3572 images were used for the evaluation of the proposed method. The method shows an accuracy of 100% to successfully categorise Accept and Reject images. Conclusion Image quality is an essential prerequisite for the grading of DR. In this paper we have proposed a deep learning based automated image quality assessment method in the context of DR. The method can be easily incorporated with the fundus image capturing system and thus can guide the photographer whether a recapture is necessary or not.