 Add to Chrome
 Add to Firefox
 Add to Edge
Active Source-free Domain Adaptation in Open-set Medical Image Segmentation via Decomposed Uncertainty and Prototype Discrepancy
Jun 07, 2026Deep learning (DL) methods are challenged to demonstrate robust performance across different segmentation datasets due to domain shifts, but active domain adaptation techniques enhance their generalization performance by querying a few samples from target domains for adaptation training. However in clinical practice, target domains often include private classes of new anatomical structures or pathologies that are not presented in the source data, and existing methods implement closed-set segmentation where source and target domains have the same segmentation classes. Additionally, source data are often inaccessible during adaptation due to strict data privacy regulations. To address these limitations, we propose an Active Source-free Open-set Domain Adaptation (ASFOSDA) method which is the first work to implement active learning for adapting DL models in open-set medical image segmentation without the access to source data. This method employs an active open-set query strategy to select the most informative target samples for training models based on Class-aware Decomposed Uncertainty (CDU) and Class-agnostic Prototype Discrepancy (CPD). CDU measures sample aleatoric uncertainty and model epistemic uncertainty by employing test time augmentation in stochastic processes. CPD measures cross-domain and self-domain discrepancy for selecting diverse samples. Subsequently, to boost the adaptation performance by enhancing training samples, a Target-refined Self-training strategy is proposed to generate high-quality pseudo labels for unselected samples, thus combining them with labeled samples for a semi-supervised training. We evaluated our method on cross-domain open-set volumetric medical image segmentation tasks, and it outperformed state-of-the-art adaptation methods.
OphIn-500K: Curating Web-Scale Visual Instructions for Scaling Ophthalmic Multimodal Large Language Models
May 27, 2026The advancement of general medical Multimodal Large Language Models (MLLMs) has shown great potential for building conversational assistants to support clinical diagnosis. However, their adaptation to highly specialized domains such as ophthalmology remains underexplored, primarily due to the scarcity of large-scale, domain-specific instruction-tuning data. Existing ophthalmic datasets for conversational agents are often limited in scale and largely rely on images from established public benchmarks, limiting the scalability of ophthalmic MLLMs and their ability to capture real-world clinical complexity. To address this gap, we propose $\textbf{OphIn-Engine}$, an ophthalmology-specific instruction data curation pipeline that constructs high-quality instruction data from open-access ophthalmology web-scale videos. The pipeline integrates multimodal transcription for extracting image-transcript pairs, visual cue separation and scoring for identifying clinically relevant visual descriptions, and instruction synthesis with quality control for generating accurate and diverse clinical dialogues. Using this engine, we introduce $\textbf{OphIn-500K}$, a large-scale multimodal ophthalmology instruction-tuning dataset containing over 500,000 instruction instances and more than 151,000 unique images from over 29,000 video clips, formatted as visual question answering (VQA), multi-turn conversational interactions, and chain-of-thought (CoT) reasoning. Built upon this dataset, we further develop $\textbf{OphIn-VL}$, an ophthalmology-specific MLLM with advanced visual understanding and conversational capabilities. Comprehensive experiments and case studies demonstrate that OphIn-VL achieves superior performance compared with state-of-the-art general medical and domain-specific MLLMs.
Mags-RL: Wearing Multimodal LLMs a Magnifying Glass via Agentic Reinforcement Learning For Complex Scene Reasoning
May 27, 2026Despite their popularity and success, Multimodal Large Language Models (MLLMs) often struggle to interpret images accurately, which limits their reasoning capability in complex scenarios (e.g., high object density and complex background clutter). Prior work mainly addresses this limitation by incorporating explicit visual cues like bounding boxes that require extra annotations. In addition, the resulting low-resolution crops often miss fine-grained details that MLLMs require for accurate reasoning. Therefore, we propose Mags-RL, an Agentic Reinforcement Learning (RL) framework that equips MLLMs with an external super-resolution "magnifying glass" agent for high-resolution fine-grained inspection. Specifically, the model performs two-round reasoning: in the first round, it generates an initial rationale and autonomously identifies regions of interest without relying on additional annotations; in the second round, it invokes a super-resolution agent to crop and upscale those regions, then revisits and verifies its earlier reasoning to produce the final answer. We also introduce a novel curriculum learning strategy that enables data-efficient RL training, needing as few as only 40 training samples to achieve reasonable performance. Experiments on VSR, TallyQA, and GQA subsets show its superior performance against recent strong competing methods, demonstrating high-quality reasoning with precise visual grounding. Code and weights will be released soon.
U-Harmony: Enhancing Joint Training for Segmentation Models with Universal Harmonization
Jan 21, 2026In clinical practice, medical segmentation datasets are often limited and heterogeneous, with variations in modalities, protocols, and anatomical targets across institutions. Existing deep learning models struggle to jointly learn from such diverse data, often sacrificing either generalization or domain-specific knowledge. To overcome these challenges, we propose a joint training method called Universal Harmonization (U-Harmony), which can be integrated into deep learning-based architectures with a domain-gated head, enabling a single segmentation model to learn from heterogeneous datasets simultaneously. By integrating U-Harmony, our approach sequentially normalizes and then denormalizes feature distributions to mitigate domain-specific variations while preserving original dataset-specific knowledge. More appealingly, our framework also supports universal modality adaptation, allowing the seamless learning of new imaging modalities and anatomical classes. Extensive experiments on cross-institutional brain lesion datasets demonstrate the effectiveness of our approach, establishing a new benchmark for robust and adaptable 3D medical image segmentation models in real-world clinical settings.
FM-LoRA: Factorized Low-Rank Meta-Prompting for Continual Learning
Apr 09, 2025How to adapt a pre-trained model continuously for sequential tasks with different prediction class labels and domains and finally learn a generalizable model across diverse tasks is a long-lasting challenge. Continual learning (CL) has emerged as a promising approach to leverage pre-trained models (e.g., Transformers) for sequential tasks. While many existing CL methods incrementally store additional learned structures, such as Low-Rank Adaptation (LoRA) adapters or prompts and sometimes even preserve features from previous samples to maintain performance. This leads to unsustainable parameter growth and escalating storage costs as the number of tasks increases. Moreover, current approaches often lack task similarity awareness, which further hinders the models ability to effectively adapt to new tasks without interfering with previously acquired knowledge. To address these challenges, we propose FM-LoRA, a novel and efficient low-rank adaptation method that integrates both a dynamic rank selector (DRS) and dynamic meta-prompting (DMP). This framework allocates model capacity more effectively across tasks by leveraging a shared low-rank subspace critical for preserving knowledge, thereby avoiding continual parameter expansion. Extensive experiments on various CL benchmarks, including ImageNet-R, CIFAR100, and CUB200 for class-incremental learning (CIL), and DomainNet for domain-incremental learning (DIL), with Transformers backbone demonstrate that FM-LoRA effectively mitigates catastrophic forgetting while delivering robust performance across a diverse range of tasks and domains.
D2-MLP: Dynamic Decomposed MLP Mixer for Medical Image Segmentation
Sep 13, 2024


Convolutional neural networks are widely used in various segmentation tasks in medical images. However, they are challenged to learn global features adaptively due to the inherent locality of convolutional operations. In contrast, MLP Mixers are proposed as a backbone to learn global information across channels with low complexity. However, they cannot capture spatial features efficiently. Additionally, they lack effective mechanisms to fuse and mix features adaptively. To tackle these limitations, we propose a novel Dynamic Decomposed Mixer module. It is designed to employ novel Mixers to extract features and aggregate information across different spatial locations and channels. Additionally, it employs novel dynamic mixing mechanisms to model inter-dependencies between channel and spatial feature representations and to fuse them adaptively. Subsequently, we incorporate it into a U-shaped Transformer-based architecture to generate a novel network, termed the Dynamic Decomposed MLP Mixer. We evaluated it for medical image segmentation on two datasets, and it achieved superior segmentation performance than other state-of-the-art methods.
Design and Implementation of Curriculum System Based on Knowledge Graph
Dec 23, 2020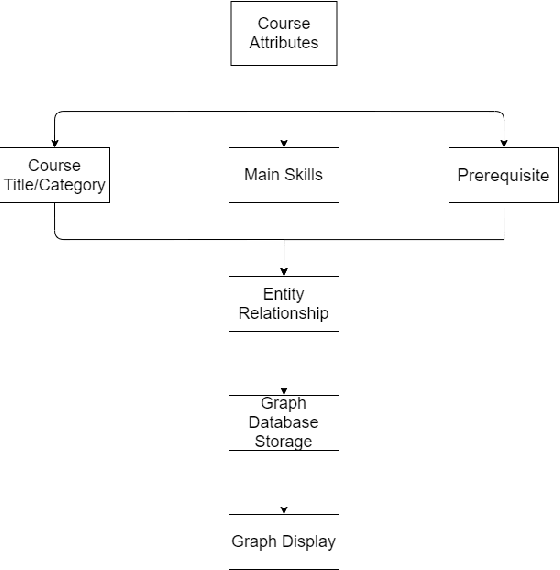
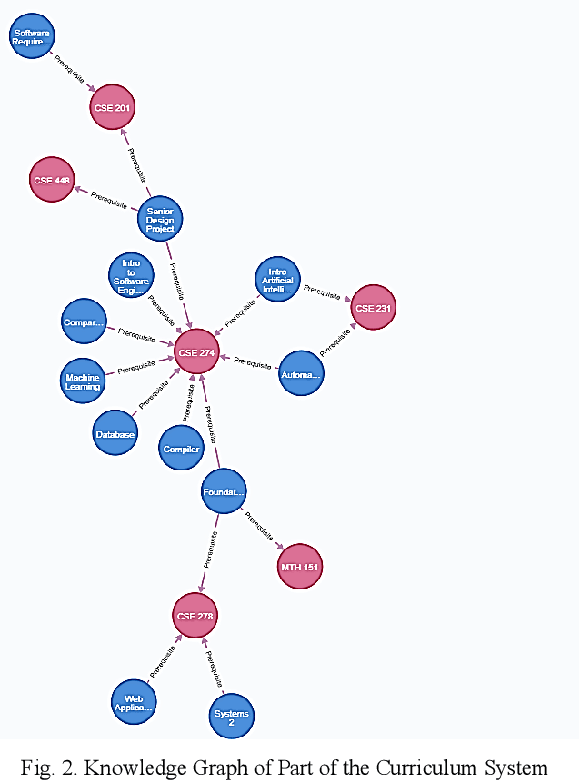
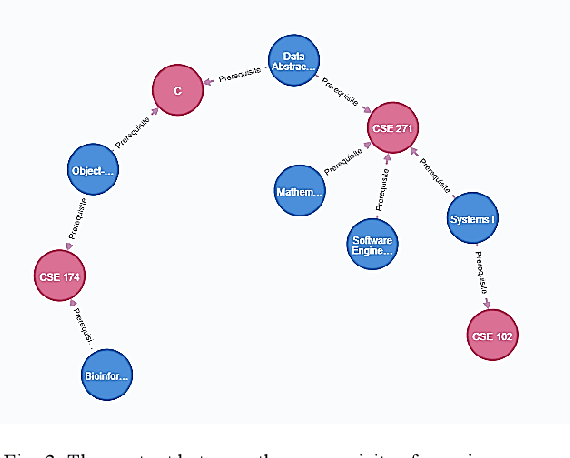
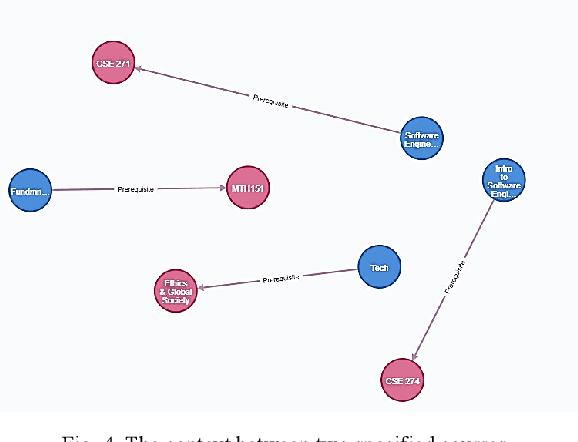
With the fact that the knowledge in each field in university is keeping increasing, the number of university courses is becoming larger, and the content and curriculum system is becoming much more complicated than it used to be, which bring many inconveniences to the course arrangement and analysis. In this paper, we aim to construct a method to visualize all courses based on Google Knowledge Graph. By analysing the properties of the courses and their preceding requirements, we want to extract the relationship between the precursors and the successors, so as to build the knowledge graph of the curriculum system. Using the graph database Neo4j [7] as the core aspect for data storage and display for our new curriculum system will be our approach to implement our knowledge graph. Based on this graph, the venation relationship between courses can be clearly analysed, and some difficult information can be obtained, which can help to combine the outline of courses and the need to quickly query the venation information of courses.
Metastatic Cancer Image Classification Based On Deep Learning Method
Nov 13, 2020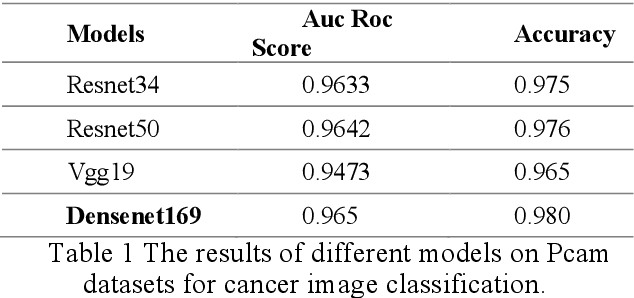
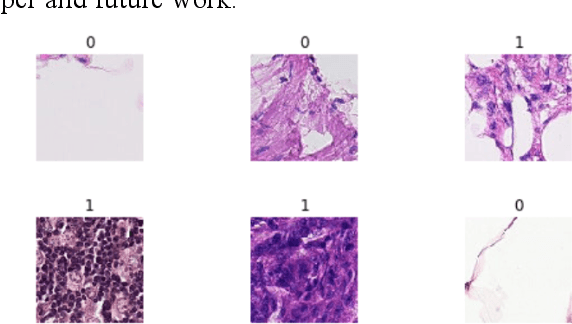
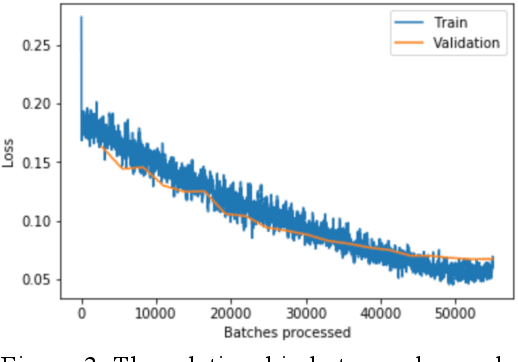
Using histopathological images to automatically classify cancer is a difficult task for accurately detecting cancer, especially to identify metastatic cancer in small image patches obtained from larger digital pathology scans. Computer diagnosis technology has attracted wide attention from researchers. In this paper, we propose a noval method which combines the deep learning algorithm in image classification, the DenseNet169 framework and Rectified Adam optimization algorithm. The connectivity pattern of DenseNet is direct connections from any layer to all consecutive layers, which can effectively improve the information flow between different layers. With the fact that RAdam is not easy to fall into a local optimal solution, and it can converge quickly in model training. The experimental results shows that our model achieves superior performance over the other classical convolutional neural networks approaches, such as Vgg19, Resnet34, Resnet50. In particular, the Auc-Roc score of our DenseNet169 model is 1.77% higher than Vgg19 model, and the Accuracy score is 1.50% higher. Moreover, we also study the relationship between loss value and batches processed during the training stage and validation stage, and obtain some important and interesting findings.