 Add to Chrome
 Add to Firefox
 Add to Edge
WordCraft: Scaffolding the Keyword Method for L2 Vocabulary Learning with Multimodal LLMs
Jan 31, 2026Applying the keyword method for vocabulary memorization remains a significant challenge for L1 Chinese-L2 English learners. They frequently struggle to generate phonologically appropriate keywords, construct coherent associations, and create vivid mental imagery to aid long-term retention. Existing approaches, including fully automated keyword generation and outcome-oriented mnemonic aids, either compromise learner engagement or lack adequate process-oriented guidance. To address these limitations, we conducted a formative study with L1 Chinese-L2 English learners and educators (N=18), which revealed key difficulties and requirements in applying the keyword method to vocabulary learning. Building on these insights, we introduce WordCraft, a learner-centered interactive tool powered by Multimodal Large Language Models (MLLMs). WordCraft scaffolds the keyword method by guiding learners through keyword selection, association construction, and image formation, thereby enhancing the effectiveness of vocabulary memorization. Two user studies demonstrate that WordCraft not only preserves the generation effect but also achieves high levels of effectiveness and usability.
xTime: Extreme Event Prediction with Hierarchical Knowledge Distillation and Expert Fusion
Oct 23, 2025Extreme events frequently occur in real-world time series and often carry significant practical implications. In domains such as climate and healthcare, these events, such as floods, heatwaves, or acute medical episodes, can lead to serious consequences. Accurate forecasting of such events is therefore of substantial importance. Most existing time series forecasting models are optimized for overall performance within the prediction window, but often struggle to accurately predict extreme events, such as high temperatures or heart rate spikes. The main challenges are data imbalance and the neglect of valuable information contained in intermediate events that precede extreme events. In this paper, we propose xTime, a novel framework for extreme event forecasting in time series. xTime leverages knowledge distillation to transfer information from models trained on lower-rarity events, thereby improving prediction performance on rarer ones. In addition, we introduce a mixture of experts (MoE) mechanism that dynamically selects and fuses outputs from expert models across different rarity levels, which further improves the forecasting performance for extreme events. Experiments on multiple datasets show that xTime achieves consistent improvements, with forecasting accuracy on extreme events improving from 3% to 78%.
HypoChainer: A Collaborative System Combining LLMs and Knowledge Graphs for Hypothesis-Driven Scientific Discovery
Jul 23, 2025


Modern scientific discovery faces growing challenges in integrating vast and heterogeneous knowledge critical to breakthroughs in biomedicine and drug development. Traditional hypothesis-driven research, though effective, is constrained by human cognitive limits, the complexity of biological systems, and the high cost of trial-and-error experimentation. Deep learning models, especially graph neural networks (GNNs), have accelerated prediction generation, but the sheer volume of outputs makes manual selection for validation unscalable. Large language models (LLMs) offer promise in filtering and hypothesis generation, yet suffer from hallucinations and lack grounding in structured knowledge, limiting their reliability. To address these issues, we propose HypoChainer, a collaborative visualization framework that integrates human expertise, LLM-driven reasoning, and knowledge graphs (KGs) to enhance hypothesis generation and validation. HypoChainer operates in three stages: First, exploration and contextualization -- experts use retrieval-augmented LLMs (RAGs) and dimensionality reduction to navigate large-scale GNN predictions, assisted by interactive explanations. Second, hypothesis chain formation -- experts iteratively examine KG relationships around predictions and semantically linked entities, refining hypotheses with LLM and KG suggestions. Third, validation prioritization -- refined hypotheses are filtered based on KG-supported evidence to identify high-priority candidates for experimentation, with visual analytics further strengthening weak links in reasoning. We demonstrate HypoChainer's effectiveness through case studies in two domains and expert interviews, highlighting its potential to support interpretable, scalable, and knowledge-grounded scientific discovery.
Path Planning on Multi-level Point Cloud with a Weighted Traversability Graph
Apr 30, 2025


This article proposes a new path planning method for addressing multi-level terrain situations. The proposed method includes innovations in three aspects: 1) the pre-processing of point cloud maps with a multi-level skip-list structure and data-slimming algorithm for well-organized and simplified map formalization and management, 2) the direct acquisition of local traversability indexes through vehicle and point cloud interaction analysis, which saves work in surface fitting, and 3) the assignment of traversability indexes on a multi-level connectivity graph to generate a weighted traversability graph for generally search-based path planning. The A* algorithm is modified to utilize the traversability graph to generate a short and safe path. The effectiveness and reliability of the proposed method are verified through indoor and outdoor experiments conducted in various environments, including multi-floor buildings, woodland, and rugged mountainous regions. The results demonstrate that the proposed method can properly address 3D path planning problems for ground vehicles in a wide range of situations.
Influence Maximization in Temporal Social Networks with a Cold-Start Problem: A Supervised Approach
Apr 15, 2025Influence Maximization (IM) in temporal graphs focuses on identifying influential "seeds" that are pivotal for maximizing network expansion. We advocate defining these seeds through Influence Propagation Paths (IPPs), which is essential for scaling up the network. Our focus lies in efficiently labeling IPPs and accurately predicting these seeds, while addressing the often-overlooked cold-start issue prevalent in temporal networks. Our strategy introduces a motif-based labeling method and a tensorized Temporal Graph Network (TGN) tailored for multi-relational temporal graphs, bolstering prediction accuracy and computational efficiency. Moreover, we augment cold-start nodes with new neighbors from historical data sharing similar IPPs. The recommendation system within an online team-based gaming environment presents subtle impact on the social network, forming multi-relational (i.e., weak and strong) temporal graphs for our empirical IM study. We conduct offline experiments to assess prediction accuracy and model training efficiency, complemented by online A/B testing to validate practical network growth and the effectiveness in addressing the cold-start issue.
Enhancing Data-Limited Graph Neural Networks by Actively Distilling Knowledge from Large Language Models
Jul 19, 2024Graphs have emerged as critical data structures for content analysis in various domains, such as social network analysis, bioinformatics, and recommendation systems. Node classification, a fundamental task in this context, is typically tackled using graph neural networks (GNNs). Unfortunately, conventional GNNs still face challenges in scenarios with few labeled nodes, despite the prevalence of few-shot node classification tasks in real-world applications. To address this challenge, various approaches have been proposed, including graph meta-learning, transfer learning, and methods based on Large Language Models (LLMs). However, traditional meta-learning and transfer learning methods often require prior knowledge from base classes or fail to exploit the potential advantages of unlabeled nodes. Meanwhile, LLM-based methods may overlook the zero-shot capabilities of LLMs and rely heavily on the quality of generated contexts. In this paper, we propose a novel approach that integrates LLMs and GNNs, leveraging the zero-shot inference and reasoning capabilities of LLMs and employing a Graph-LLM-based active learning paradigm to enhance GNNs' performance. Extensive experiments demonstrate the effectiveness of our model in improving node classification accuracy with considerably limited labeled data, surpassing state-of-the-art baselines by significant margins.
Hierarchical Knowledge Distillation on Text Graph for Data-limited Attribute Inference
Jan 10, 2024The popularization of social media increases user engagements and generates a large amount of user-oriented data. Among them, text data (e.g., tweets, blogs) significantly attracts researchers and speculators to infer user attributes (e.g., age, gender, location) for fulfilling their intents. Generally, this line of work casts attribute inference as a text classification problem, and starts to leverage graph neural networks (GNNs) to utilize higher-level representations of source texts. However, these text graphs are constructed over words, suffering from high memory consumption and ineffectiveness on few labeled texts. To address this challenge, we design a text-graph-based few-shot learning model for attribute inferences on social media text data. Our model first constructs and refines a text graph using manifold learning and message passing, which offers a better trade-off between expressiveness and complexity. Afterwards, to further use cross-domain texts and unlabeled texts to improve few-shot performance, a hierarchical knowledge distillation is devised over text graph to optimize the problem, which derives better text representations, and advances model generalization ability. Experiments on social media datasets demonstrate the state-of-the-art performance of our model on attribute inferences with considerably fewer labeled texts.
Towards Better Modeling with Missing Data: A Contrastive Learning-based Visual Analytics Perspective
Sep 18, 2023


Missing data can pose a challenge for machine learning (ML) modeling. To address this, current approaches are categorized into feature imputation and label prediction and are primarily focused on handling missing data to enhance ML performance. These approaches rely on the observed data to estimate the missing values and therefore encounter three main shortcomings in imputation, including the need for different imputation methods for various missing data mechanisms, heavy dependence on the assumption of data distribution, and potential introduction of bias. This study proposes a Contrastive Learning (CL) framework to model observed data with missing values, where the ML model learns the similarity between an incomplete sample and its complete counterpart and the dissimilarity between other samples. Our proposed approach demonstrates the advantages of CL without requiring any imputation. To enhance interpretability, we introduce CIVis, a visual analytics system that incorporates interpretable techniques to visualize the learning process and diagnose the model status. Users can leverage their domain knowledge through interactive sampling to identify negative and positive pairs in CL. The output of CIVis is an optimized model that takes specified features and predicts downstream tasks. We provide two usage scenarios in regression and classification tasks and conduct quantitative experiments, expert interviews, and a qualitative user study to demonstrate the effectiveness of our approach. In short, this study offers a valuable contribution to addressing the challenges associated with ML modeling in the presence of missing data by providing a practical solution that achieves high predictive accuracy and model interpretability.
Inspecting the Process of Bank Credit Rating via Visual Analytics
Aug 06, 2021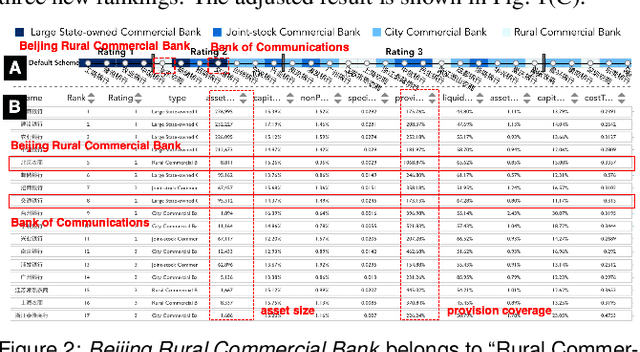
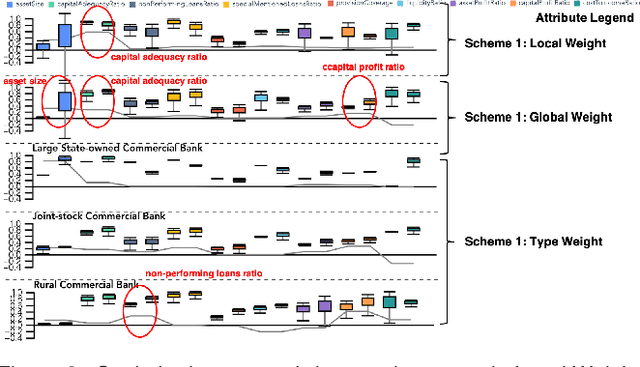
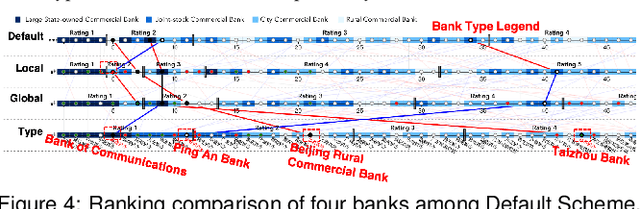
Bank credit rating classifies banks into different levels based on publicly disclosed and internal information, serving as an important input in financial risk management. However, domain experts have a vague idea of exploring and comparing different bank credit rating schemes. A loose connection between subjective and quantitative analysis and difficulties in determining appropriate indicator weights obscure understanding of bank credit ratings. Furthermore, existing models fail to consider bank types by just applying a unified indicator weight set to all banks. We propose RatingVis to assist experts in exploring and comparing different bank credit rating schemes. It supports interactively inferring indicator weights for banks by involving domain knowledge and considers bank types in the analysis loop. We conduct a case study with real-world bank data to verify the efficacy of RatingVis. Expert feedback suggests that our approach helps them better understand different rating schemes.
EmoCo: Visual Analysis of Emotion Coherence in Presentation Videos
Jul 29, 2019
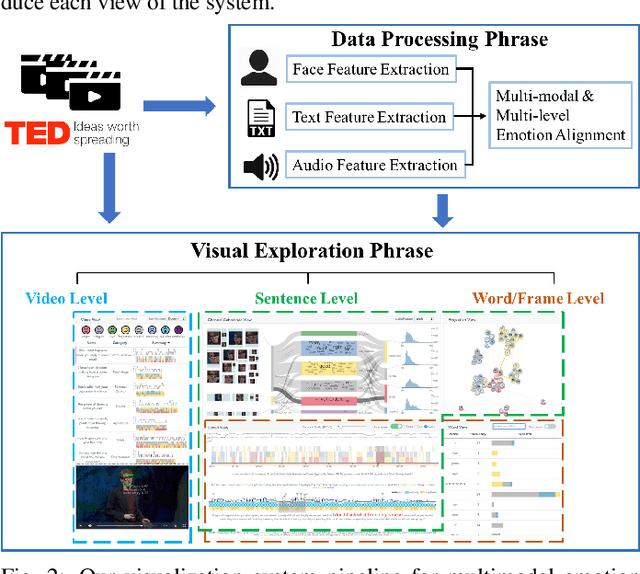
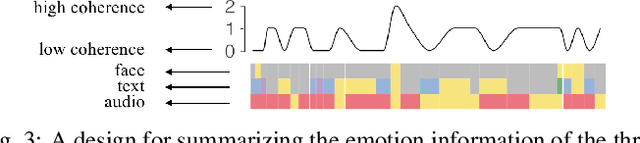
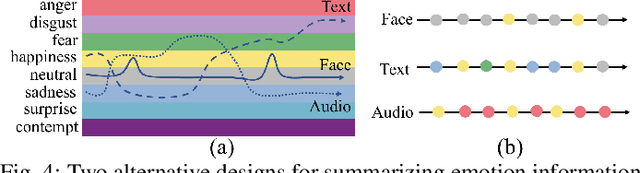
Emotions play a key role in human communication and public presentations. Human emotions are usually expressed through multiple modalities. Therefore, exploring multimodal emotions and their coherence is of great value for understanding emotional expressions in presentations and improving presentation skills. However, manually watching and studying presentation videos is often tedious and time-consuming. There is a lack of tool support to help conduct an efficient and in-depth multi-level analysis. Thus, in this paper, we introduce EmoCo, an interactive visual analytics system to facilitate efficient analysis of emotion coherence across facial, text, and audio modalities in presentation videos. Our visualization system features a channel coherence view and a sentence clustering view that together enable users to obtain a quick overview of emotion coherence and its temporal evolution. In addition, a detail view and word view enable detailed exploration and comparison from the sentence level and word level, respectively. We thoroughly evaluate the proposed system and visualization techniques through two usage scenarios based on TED Talk videos and interviews with two domain experts. The results demonstrate the effectiveness of our system in gaining insights into emotion coherence in presentations.