 Add to Chrome
 Add to Firefox
 Add to Edge
Guidelines for Designing AI Technologies to Support Adult Learning
May 06, 2026AI-powered educational technologies have demonstrated measurable benefits for learners, but their design and evaluation have largely centered on K-12 contexts. As a result, many AI-supported learning systems remain poorly aligned with the needs, constraints, and goals of adult learners. To better understand how AI systems function in adult education, this paper examines the deployment of several AI learning technologies developed within a multidisciplinary, national research institute in the United States focused on adult learning and online education. Drawing on longitudinal deployment data, we conducted a reflexive thematic analysis to identify recurring challenges and design considerations across systems. These insights were synthesized into a set of 19 design guidelines intended to inform future AI-supported adult learning technologies. We demonstrate the utility of these guidelines through a heuristic evaluation of the deployed systems. Lastly, we present a guideline exploration tool that aids in the ideation of technologies by connecting the guidelines to stakeholder statements surfaced in the analysis process.
OnGoal: Tracking and Visualizing Conversational Goals in Multi-Turn Dialogue with Large Language Models
Aug 28, 2025


As multi-turn dialogues with large language models (LLMs) grow longer and more complex, how can users better evaluate and review progress on their conversational goals? We present OnGoal, an LLM chat interface that helps users better manage goal progress. OnGoal provides real-time feedback on goal alignment through LLM-assisted evaluation, explanations for evaluation results with examples, and overviews of goal progression over time, enabling users to navigate complex dialogues more effectively. Through a study with 20 participants on a writing task, we evaluate OnGoal against a baseline chat interface without goal tracking. Using OnGoal, participants spent less time and effort to achieve their goals while exploring new prompting strategies to overcome miscommunication, suggesting tracking and visualizing goals can enhance engagement and resilience in LLM dialogues. Our findings inspired design implications for future LLM chat interfaces that improve goal communication, reduce cognitive load, enhance interactivity, and enable feedback to improve LLM performance.
VAE Explainer: Supplement Learning Variational Autoencoders with Interactive Visualization
Sep 13, 2024


Variational Autoencoders are widespread in Machine Learning, but are typically explained with dense math notation or static code examples. This paper presents VAE Explainer, an interactive Variational Autoencoder running in the browser to supplement existing static documentation (e.g., Keras Code Examples). VAE Explainer adds interactions to the VAE summary with interactive model inputs, latent space, and output. VAE Explainer connects the high-level understanding with the implementation: annotated code and a live computational graph. The VAE Explainer interactive visualization is live at https://xnought.github.io/vae-explainer and the code is open source at https://github.com/xnought/vae-explainer.
MiMICRI: Towards Domain-centered Counterfactual Explanations of Cardiovascular Image Classification Models
Apr 24, 2024


The recent prevalence of publicly accessible, large medical imaging datasets has led to a proliferation of artificial intelligence (AI) models for cardiovascular image classification and analysis. At the same time, the potentially significant impacts of these models have motivated the development of a range of explainable AI (XAI) methods that aim to explain model predictions given certain image inputs. However, many of these methods are not developed or evaluated with domain experts, and explanations are not contextualized in terms of medical expertise or domain knowledge. In this paper, we propose a novel framework and python library, MiMICRI, that provides domain-centered counterfactual explanations of cardiovascular image classification models. MiMICRI helps users interactively select and replace segments of medical images that correspond to morphological structures. From the counterfactuals generated, users can then assess the influence of each segment on model predictions, and validate the model against known medical facts. We evaluate this library with two medical experts. Our evaluation demonstrates that a domain-centered XAI approach can enhance the interpretability of model explanations, and help experts reason about models in terms of relevant domain knowledge. However, concerns were also surfaced about the clinical plausibility of the counterfactuals generated. We conclude with a discussion on the generalizability and trustworthiness of the MiMICRI framework, as well as the implications of our findings on the development of domain-centered XAI methods for model interpretability in healthcare contexts.
iScore: Visual Analytics for Interpreting How Language Models Automatically Score Summaries
Mar 07, 2024The recent explosion in popularity of large language models (LLMs) has inspired learning engineers to incorporate them into adaptive educational tools that automatically score summary writing. Understanding and evaluating LLMs is vital before deploying them in critical learning environments, yet their unprecedented size and expanding number of parameters inhibits transparency and impedes trust when they underperform. Through a collaborative user-centered design process with several learning engineers building and deploying summary scoring LLMs, we characterized fundamental design challenges and goals around interpreting their models, including aggregating large text inputs, tracking score provenance, and scaling LLM interpretability methods. To address their concerns, we developed iScore, an interactive visual analytics tool for learning engineers to upload, score, and compare multiple summaries simultaneously. Tightly integrated views allow users to iteratively revise the language in summaries, track changes in the resulting LLM scores, and visualize model weights at multiple levels of abstraction. To validate our approach, we deployed iScore with three learning engineers over the course of a month. We present a case study where interacting with iScore led a learning engineer to improve their LLM's score accuracy by three percentage points. Finally, we conducted qualitative interviews with the learning engineers that revealed how iScore enabled them to understand, evaluate, and build trust in their LLMs during deployment.
KnowledgeVIS: Interpreting Language Models by Comparing Fill-in-the-Blank Prompts
Mar 07, 2024


Recent growth in the popularity of large language models has led to their increased usage for summarizing, predicting, and generating text, making it vital to help researchers and engineers understand how and why they work. We present KnowledgeVis, a human-in-the-loop visual analytics system for interpreting language models using fill-in-the-blank sentences as prompts. By comparing predictions between sentences, KnowledgeVis reveals learned associations that intuitively connect what language models learn during training to natural language tasks downstream, helping users create and test multiple prompt variations, analyze predicted words using a novel semantic clustering technique, and discover insights using interactive visualizations. Collectively, these visualizations help users identify the likelihood and uniqueness of individual predictions, compare sets of predictions between prompts, and summarize patterns and relationships between predictions across all prompts. We demonstrate the capabilities of KnowledgeVis with feedback from six NLP experts as well as three different use cases: (1) probing biomedical knowledge in two domain-adapted models; and (2) evaluating harmful identity stereotypes and (3) discovering facts and relationships between three general-purpose models.
CACTUS: Detecting and Resolving Conflicts in Objective Functions
Mar 13, 2021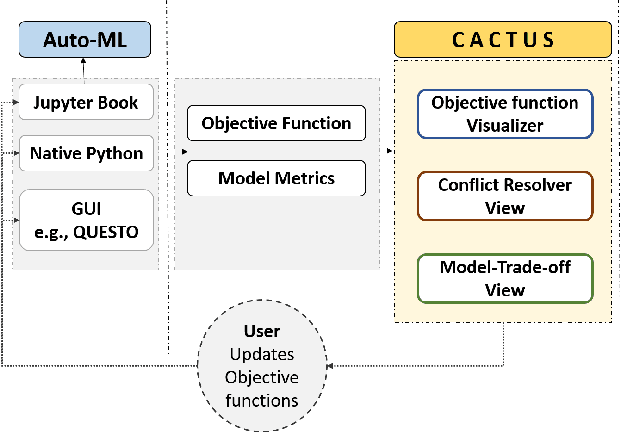
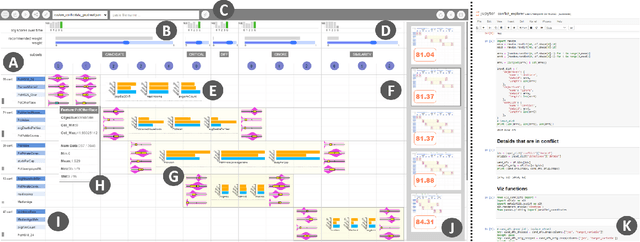
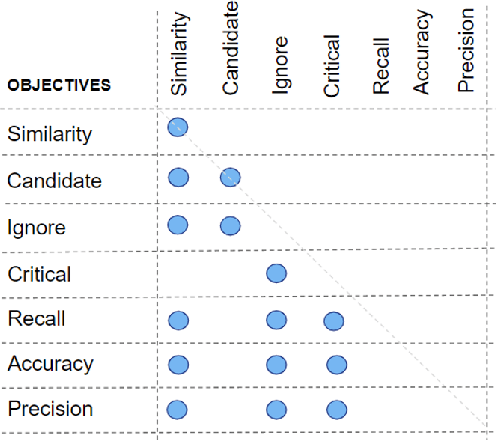
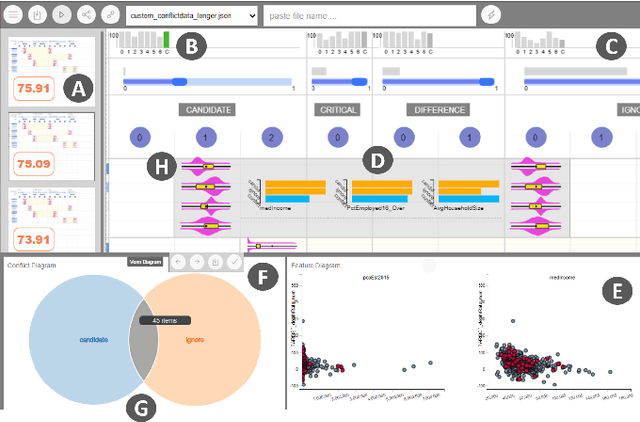
Machine learning (ML) models are constructed by expert ML practitioners using various coding languages, in which they tune and select models hyperparameters and learning algorithms for a given problem domain. They also carefully design an objective function or loss function (often with multiple objectives) that captures the desired output for a given ML task such as classification, regression, etc. In multi-objective optimization, conflicting objectives and constraints is a major area of concern. In such problems, several competing objectives are seen for which no single optimal solution is found that satisfies all desired objectives simultaneously. In the past VA systems have allowed users to interactively construct objective functions for a classifier. In this paper, we extend this line of work by prototyping a technique to visualize multi-objective objective functions either defined in a Jupyter notebook or defined using an interactive visual interface to help users to: (1) perceive and interpret complex mathematical terms in it and (2) detect and resolve conflicting objectives. Visualization of the objective function enlightens potentially conflicting objectives that obstructs selecting correct solution(s) for the desired ML task or goal. We also present an enumeration of potential conflicts in objective specification in multi-objective objective functions for classifier selection. Furthermore, we demonstrate our approach in a VA system that helps users in specifying meaningful objective functions to a classifier by detecting and resolving conflicting objectives and constraints. Through a within-subject quantitative and qualitative user study, we present results showing that our technique helps users interactively specify meaningful objective functions by resolving potential conflicts for a classification task.
Should We Trust AI? Design Dimensions for Structured Experimental Evaluations
Sep 14, 2020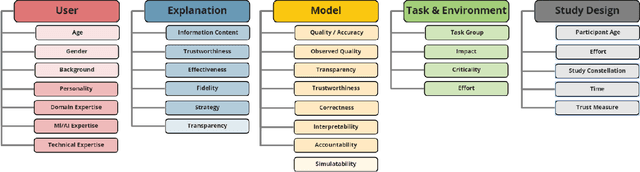
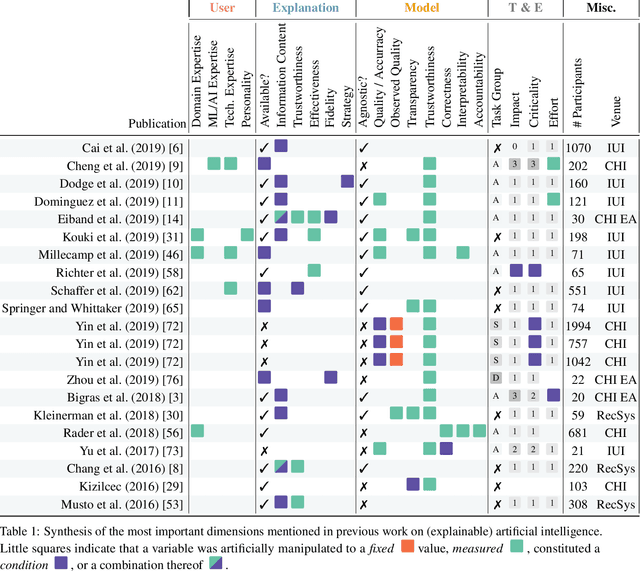
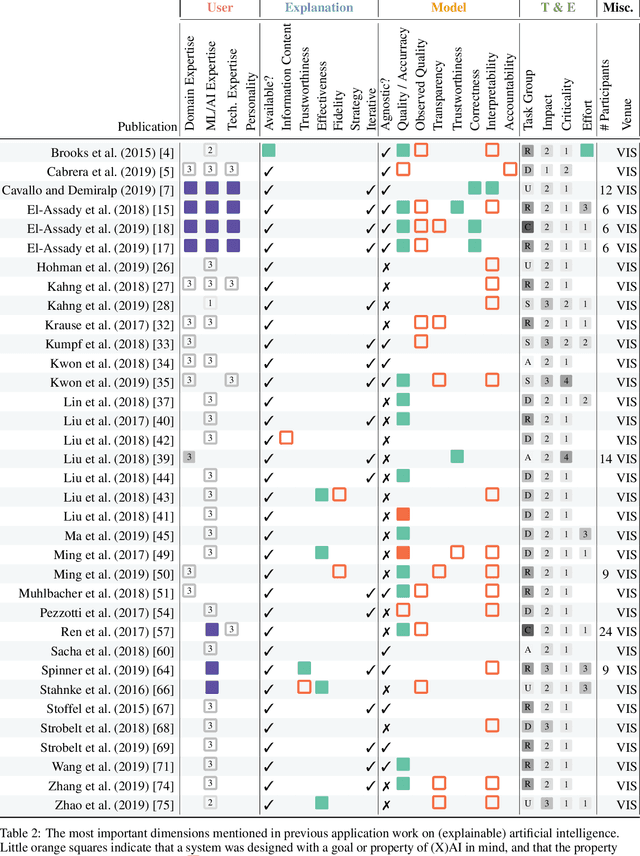
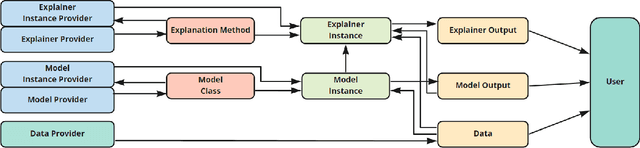
This paper systematically derives design dimensions for the structured evaluation of explainable artificial intelligence (XAI) approaches. These dimensions enable a descriptive characterization, facilitating comparisons between different study designs. They further structure the design space of XAI, converging towards a precise terminology required for a rigorous study of XAI. Our literature review differentiates between comparative studies and application papers, revealing methodological differences between the fields of machine learning, human-computer interaction, and visual analytics. Generally, each of these disciplines targets specific parts of the XAI process. Bridging the resulting gaps enables a holistic evaluation of XAI in real-world scenarios, as proposed by our conceptual model characterizing bias sources and trust-building. Furthermore, we identify and discuss the potential for future work based on observed research gaps that should lead to better coverage of the proposed model.
EmoCo: Visual Analysis of Emotion Coherence in Presentation Videos
Jul 29, 2019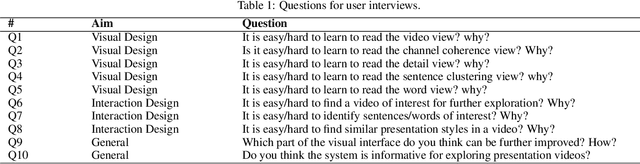
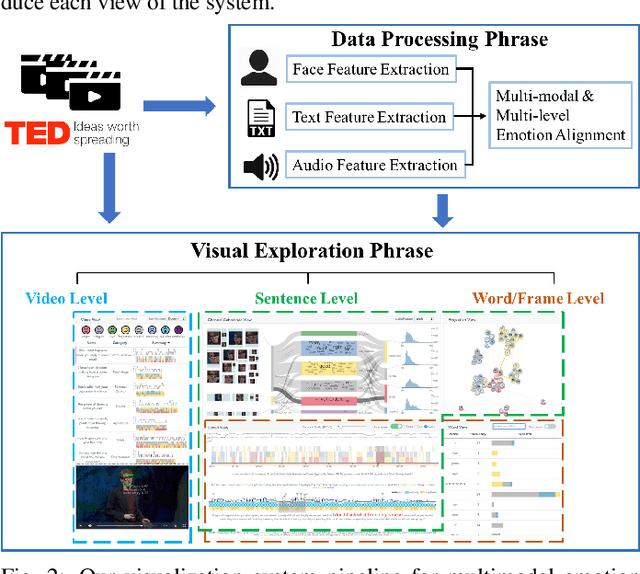
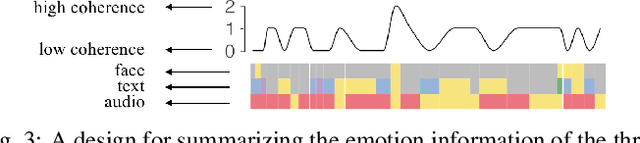
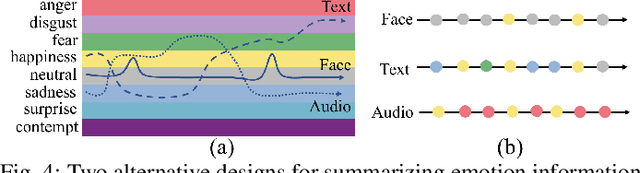
Emotions play a key role in human communication and public presentations. Human emotions are usually expressed through multiple modalities. Therefore, exploring multimodal emotions and their coherence is of great value for understanding emotional expressions in presentations and improving presentation skills. However, manually watching and studying presentation videos is often tedious and time-consuming. There is a lack of tool support to help conduct an efficient and in-depth multi-level analysis. Thus, in this paper, we introduce EmoCo, an interactive visual analytics system to facilitate efficient analysis of emotion coherence across facial, text, and audio modalities in presentation videos. Our visualization system features a channel coherence view and a sentence clustering view that together enable users to obtain a quick overview of emotion coherence and its temporal evolution. In addition, a detail view and word view enable detailed exploration and comparison from the sentence level and word level, respectively. We thoroughly evaluate the proposed system and visualization techniques through two usage scenarios based on TED Talk videos and interviews with two domain experts. The results demonstrate the effectiveness of our system in gaining insights into emotion coherence in presentations.
Visual Analytics for Automated Model Discovery
Oct 02, 2018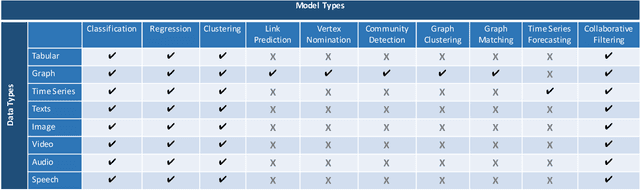
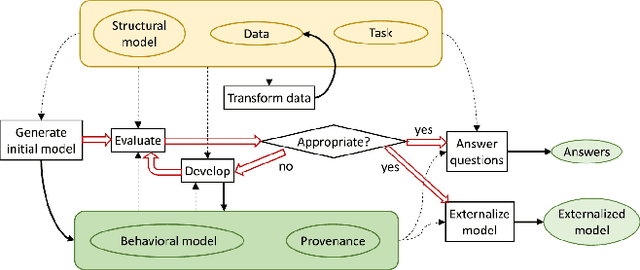
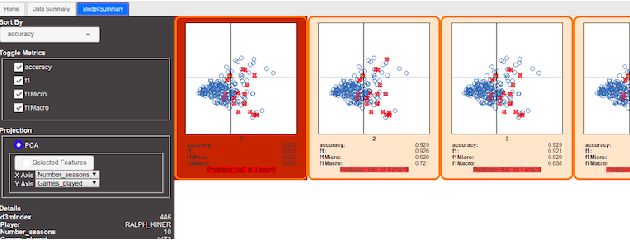
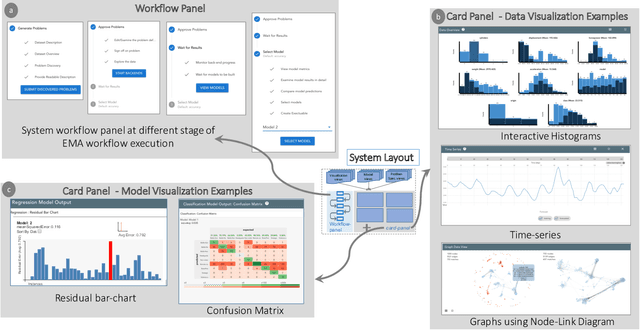
A recent advancement in the machine learning community is the development of automated machine learning (autoML) systems, such as autoWeka or Google's Cloud AutoML, which automate the model selection and tuning process. However, while autoML tools give users access to arbitrarily complex models, they typically return those models with little context or explanation. Visual analytics can be helpful in giving a user of autoML insight into their data, and a more complete understanding of the models discovered by autoML, including differences between multiple models. In this work, we describe how visual analytics for automated model discovery differs from traditional visual analytics for machine learning. First, we propose an architecture based on an extension of existing visual analytics frameworks. Then we describe a prototype system Snowcat, developed according to the presented framework and architecture, that aids users in generating models for a diverse set of data and modeling tasks.