 Add to Chrome
 Add to Firefox
 Add to Edge
Peer-inspired Student Performance Prediction in Interactive Online Question Pools with Graph Neural Network
Aug 15, 2020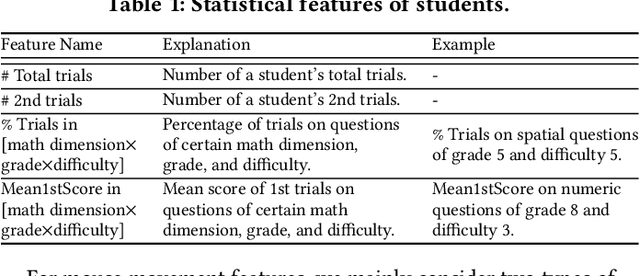
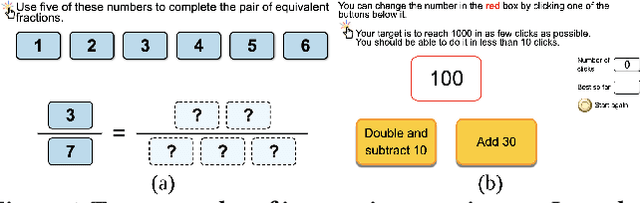
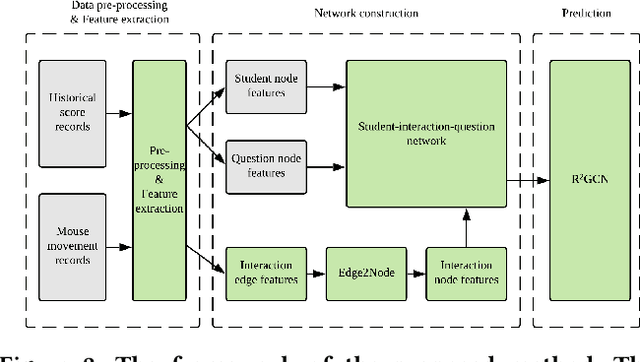
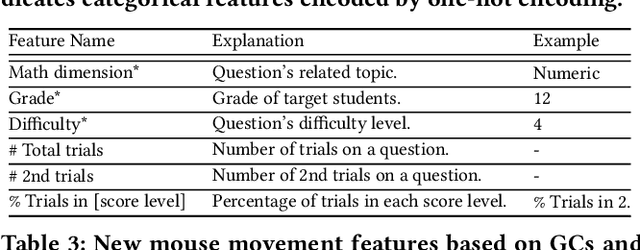
Student performance prediction is critical to online education. It can benefit many downstream tasks on online learning platforms, such as estimating dropout rates, facilitating strategic intervention, and enabling adaptive online learning. Interactive online question pools provide students with interesting interactive questions to practice their knowledge in online education. However, little research has been done on student performance prediction in interactive online question pools. Existing work on student performance prediction targets at online learning platforms with predefined course curriculum and accurate knowledge labels like MOOC platforms, but they are not able to fully model knowledge evolution of students in interactive online question pools. In this paper, we propose a novel approach using Graph Neural Networks (GNNs) to achieve better student performance prediction in interactive online question pools. Specifically, we model the relationship between students and questions using student interactions to construct the student-interaction-question network and further present a new GNN model, called R^2GCN, which intrinsically works for the heterogeneous networks, to achieve generalizable student performance prediction in interactive online question pools. We evaluate the effectiveness of our approach on a real-world dataset consisting of 104,113 mouse trajectories generated in the problem-solving process of over 4000 students on 1631 questions. The experiment results show that our approach can achieve a much higher accuracy of student performance prediction than both traditional machine learning approaches and GNN models.
Visual Analysis of Discrimination in Machine Learning
Jul 30, 2020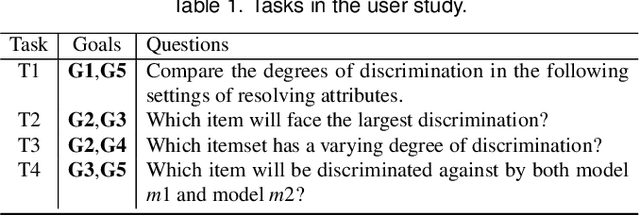
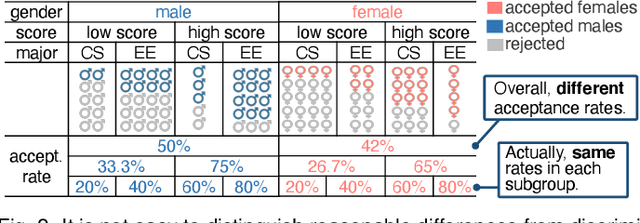
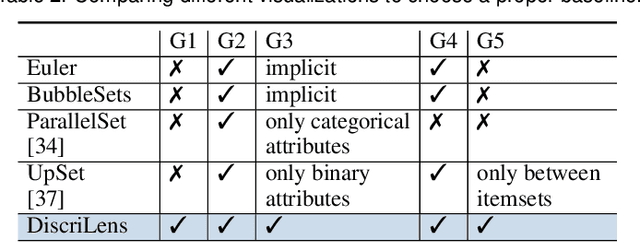
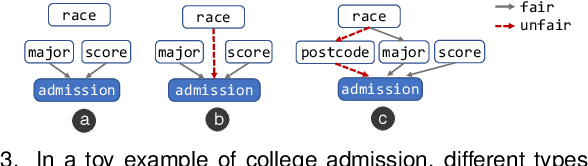
The growing use of automated decision-making in critical applications, such as crime prediction and college admission, has raised questions about fairness in machine learning. How can we decide whether different treatments are reasonable or discriminatory? In this paper, we investigate discrimination in machine learning from a visual analytics perspective and propose an interactive visualization tool, DiscriLens, to support a more comprehensive analysis. To reveal detailed information on algorithmic discrimination, DiscriLens identifies a collection of potentially discriminatory itemsets based on causal modeling and classification rules mining. By combining an extended Euler diagram with a matrix-based visualization, we develop a novel set visualization to facilitate the exploration and interpretation of discriminatory itemsets. A user study shows that users can interpret the visually encoded information in DiscriLens quickly and accurately. Use cases demonstrate that DiscriLens provides informative guidance in understanding and reducing algorithmic discrimination.
HypoML: Visual Analysis for Hypothesis-based Evaluation of Machine Learning Models
Feb 12, 2020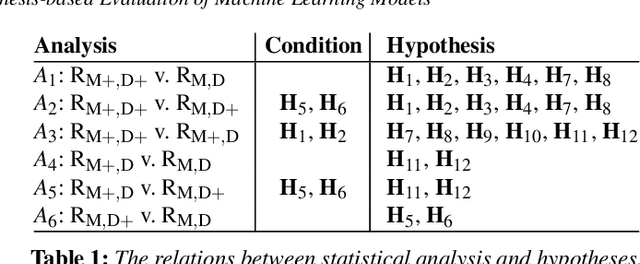
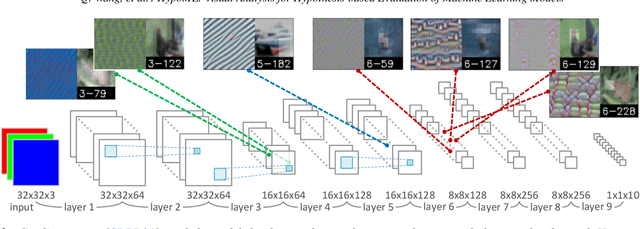
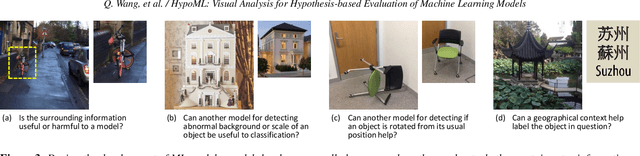
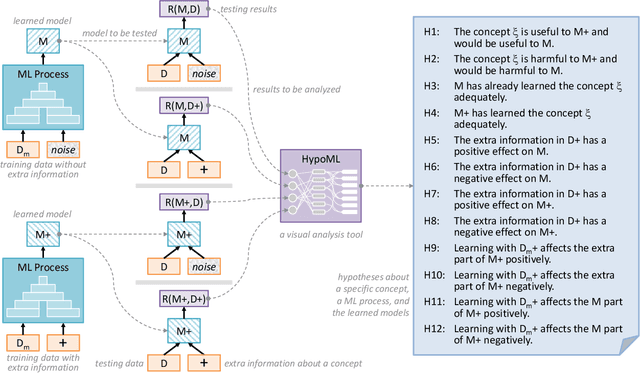
In this paper, we present a visual analytics tool for enabling hypothesis-based evaluation of machine learning (ML) models. We describe a novel ML-testing framework that combines the traditional statistical hypothesis testing (commonly used in empirical research) with logical reasoning about the conclusions of multiple hypotheses. The framework defines a controlled configuration for testing a number of hypotheses as to whether and how some extra information about a "concept" or "feature" may benefit or hinder a ML model. Because reasoning multiple hypotheses is not always straightforward, we provide HypoML as a visual analysis tool, with which, the multi-thread testing data is transformed to a visual representation for rapid observation of the conclusions and the logical flow between the testing data and hypotheses.We have applied HypoML to a number of hypothesized concepts, demonstrating the intuitive and explainable nature of the visual analysis.
VoiceCoach: Interactive Evidence-based Training for Voice Modulation Skills in Public Speaking
Jan 22, 2020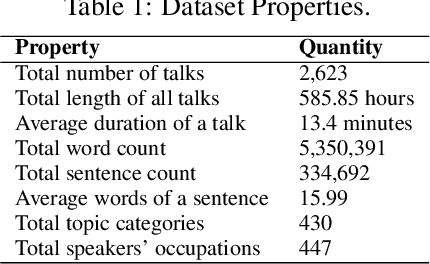
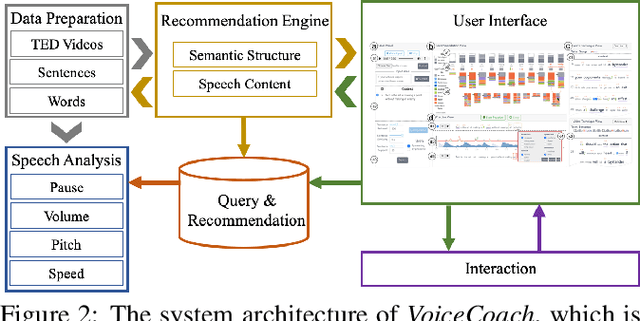
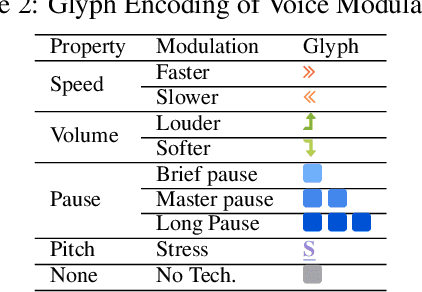
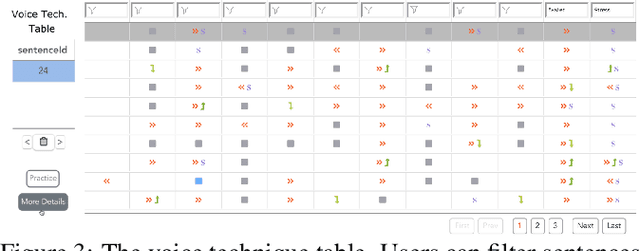
The modulation of voice properties, such as pitch, volume, and speed, is crucial for delivering a successful public speech. However, it is challenging to master different voice modulation skills. Though many guidelines are available, they are often not practical enough to be applied in different public speaking situations, especially for novice speakers. We present VoiceCoach, an interactive evidence-based approach to facilitate the effective training of voice modulation skills. Specifically, we have analyzed the voice modulation skills from 2623 high-quality speeches (i.e., TED Talks) and use them as the benchmark dataset. Given a voice input, VoiceCoach automatically recommends good voice modulation examples from the dataset based on the similarity of both sentence structures and voice modulation skills. Immediate and quantitative visual feedback is provided to guide further improvement. The expert interviews and the user study provide support for the effectiveness and usability of VoiceCoach.
SirenLess: reveal the intention behind news
Jan 08, 2020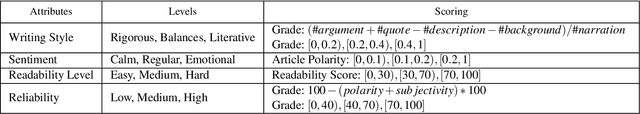
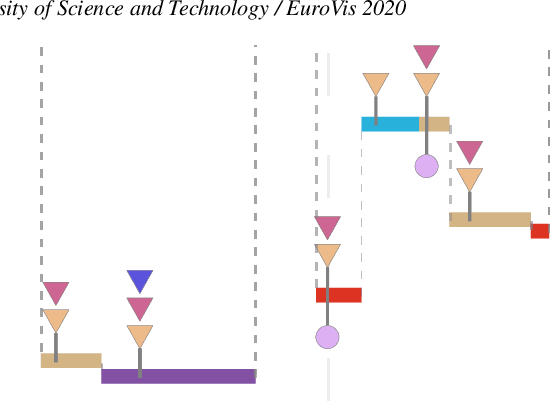
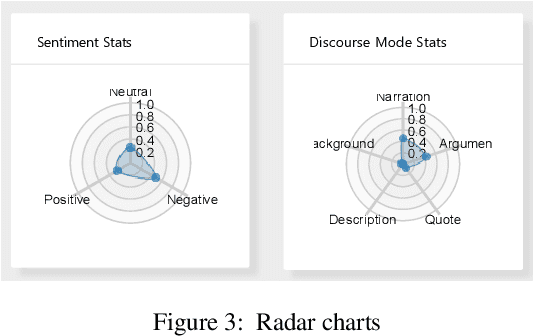
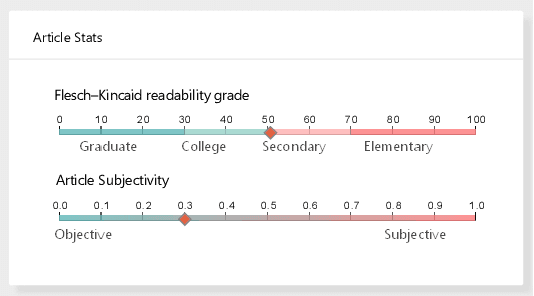
News articles tend to be increasingly misleading nowadays, preventing readers from making subjective judgments towards certain events. While some machine learning approaches have been proposed to detect misleading news, most of them are black boxes that provide limited help for humans in decision making. In this paper, we present SirenLess, a visual analytical system for misleading news detection by linguistic features. The system features article explorer, a novel interactive tool that integrates news metadata and linguistic features to reveal semantic structures of news articles and facilitate textual analysis. We use SirenLess to analyze 18 news articles from different sources and summarize some helpful patterns for misleading news detection. A user study with journalism professionals and university students is conducted to confirm the usefulness and effectiveness of our system.
EmoCo: Visual Analysis of Emotion Coherence in Presentation Videos
Jul 29, 2019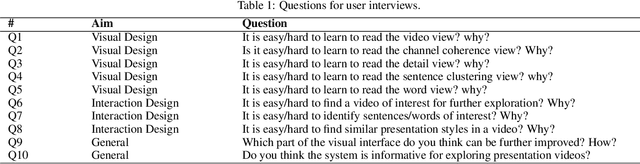
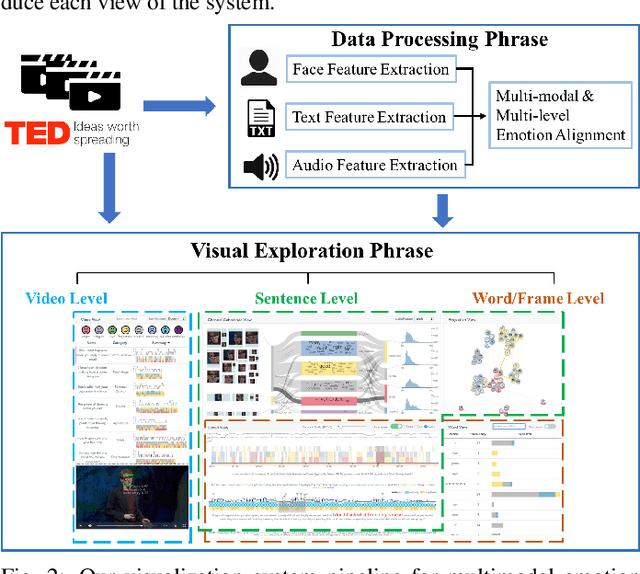
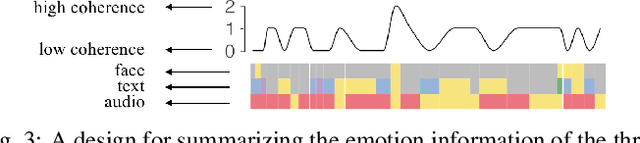
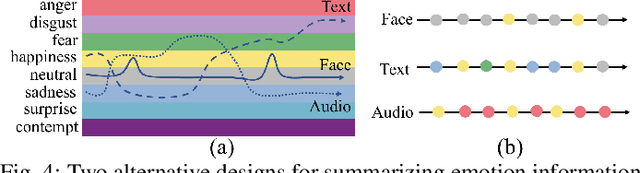
Emotions play a key role in human communication and public presentations. Human emotions are usually expressed through multiple modalities. Therefore, exploring multimodal emotions and their coherence is of great value for understanding emotional expressions in presentations and improving presentation skills. However, manually watching and studying presentation videos is often tedious and time-consuming. There is a lack of tool support to help conduct an efficient and in-depth multi-level analysis. Thus, in this paper, we introduce EmoCo, an interactive visual analytics system to facilitate efficient analysis of emotion coherence across facial, text, and audio modalities in presentation videos. Our visualization system features a channel coherence view and a sentence clustering view that together enable users to obtain a quick overview of emotion coherence and its temporal evolution. In addition, a detail view and word view enable detailed exploration and comparison from the sentence level and word level, respectively. We thoroughly evaluate the proposed system and visualization techniques through two usage scenarios based on TED Talk videos and interviews with two domain experts. The results demonstrate the effectiveness of our system in gaining insights into emotion coherence in presentations.
DeepDrawing: A Deep Learning Approach to Graph Drawing
Jul 27, 2019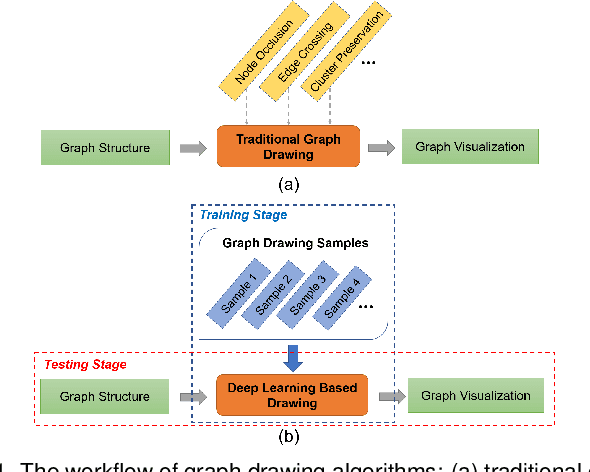
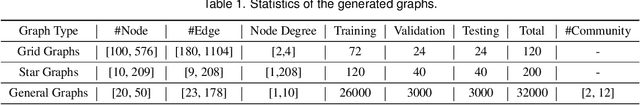
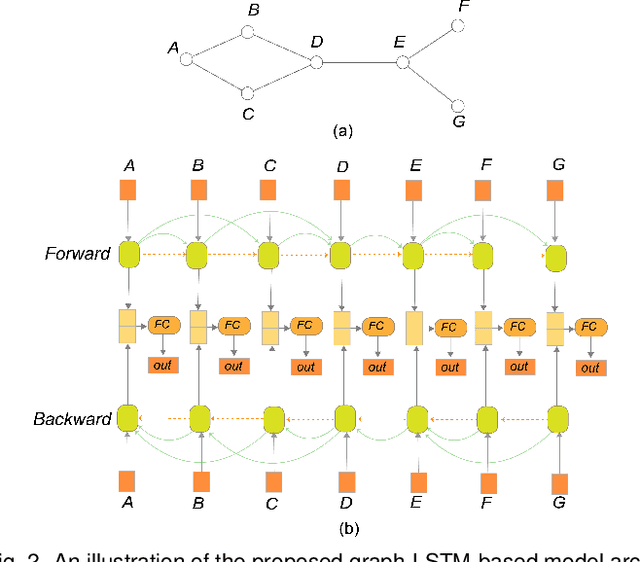
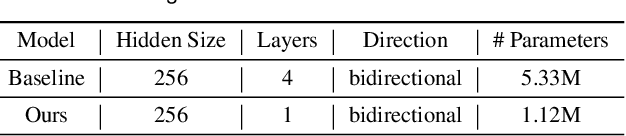
Node-link diagrams are widely used to facilitate network explorations. However, when using a graph drawing technique to visualize networks, users often need to tune different algorithm-specific parameters iteratively by comparing the corresponding drawing results in order to achieve a desired visual effect. This trial and error process is often tedious and time-consuming, especially for non-expert users. Inspired by the powerful data modelling and prediction capabilities of deep learning techniques, we explore the possibility of applying deep learning techniques to graph drawing. Specifically, we propose using a graph-LSTM-based approach to directly map network structures to graph drawings. Given a set of layout examples as the training dataset, we train the proposed graph-LSTM-based model to capture their layout characteristics. Then, the trained model is used to generate graph drawings in a similar style for new networks. We evaluated the proposed approach on two special types of layouts (i.e., grid layouts and star layouts) and two general types of layouts (i.e., ForceAtlas2 and PivotMDS) in both qualitative and quantitative ways. The results provide support for the effectiveness of our approach. We also conducted a time cost assessment on the drawings of small graphs with 20 to 50 nodes. We further report the lessons we learned and discuss the limitations and future work.
Interpretable and Steerable Sequence Learning via Prototypes
Jul 23, 2019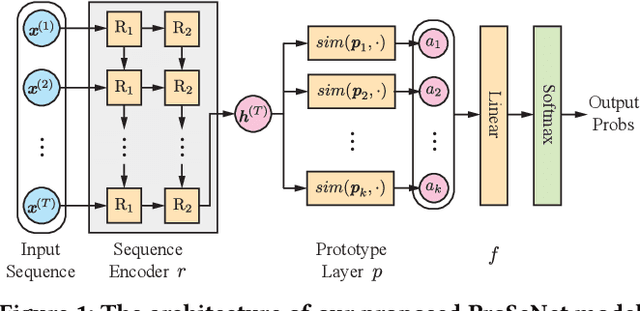
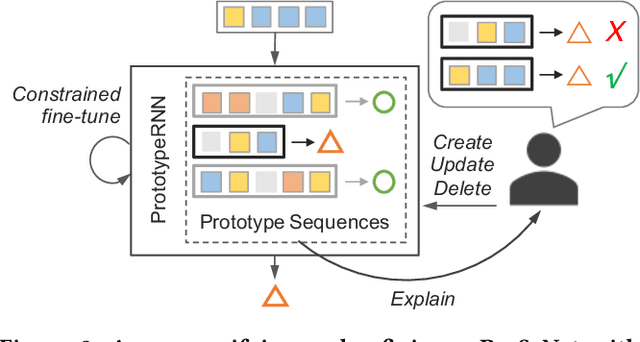
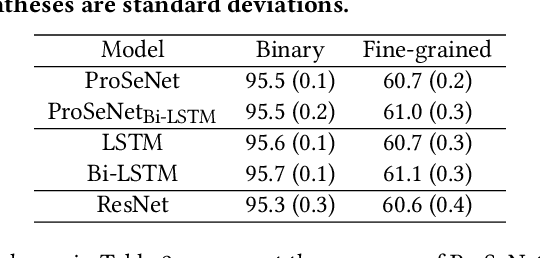
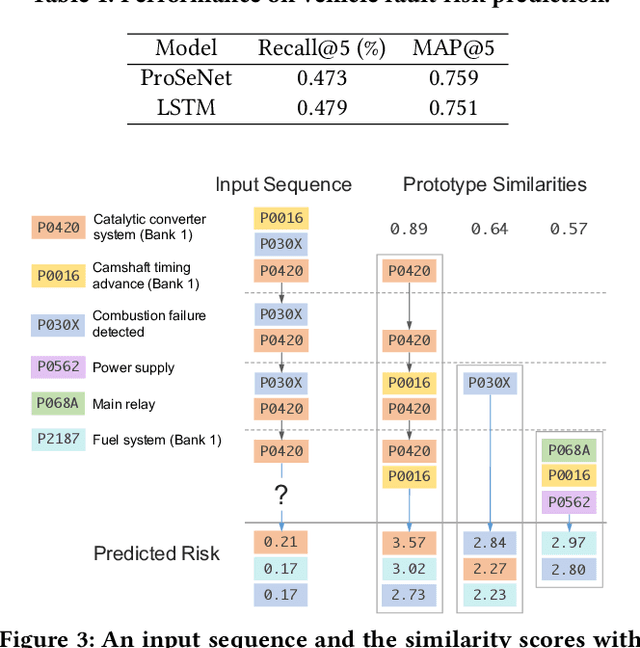
One of the major challenges in machine learning nowadays is to provide predictions with not only high accuracy but also user-friendly explanations. Although in recent years we have witnessed increasingly popular use of deep neural networks for sequence modeling, it is still challenging to explain the rationales behind the model outputs, which is essential for building trust and supporting the domain experts to validate, critique and refine the model. We propose ProSeNet, an interpretable and steerable deep sequence model with natural explanations derived from case-based reasoning. The prediction is obtained by comparing the inputs to a few prototypes, which are exemplar cases in the problem domain. For better interpretability, we define several criteria for constructing the prototypes, including simplicity, diversity, and sparsity and propose the learning objective and the optimization procedure. ProSeNet also provides a user-friendly approach to model steering: domain experts without any knowledge on the underlying model or parameters can easily incorporate their intuition and experience by manually refining the prototypes. We conduct experiments on a wide range of real-world applications, including predictive diagnostics for automobiles, ECG, and protein sequence classification and sentiment analysis on texts. The result shows that ProSeNet can achieve accuracy on par with state-of-the-art deep learning models. We also evaluate the interpretability of the results with concrete case studies. Finally, through user study on Amazon Mechanical Turk (MTurk), we demonstrate that the model selects high-quality prototypes which align well with human knowledge and can be interactively refined for better interpretability without loss of performance.
* Accepted as a full paper at KDD 2019 on May 8, 2019
ATMSeer: Increasing Transparency and Controllability in Automated Machine Learning
Feb 13, 2019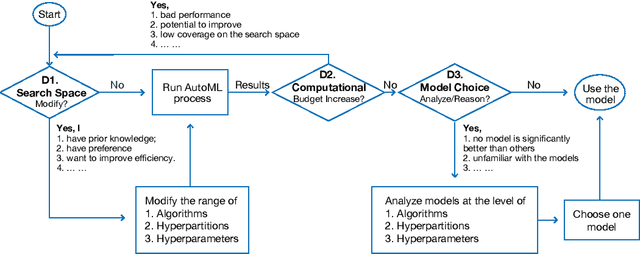
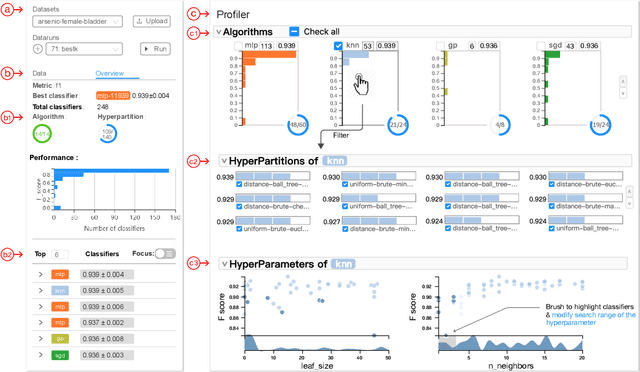
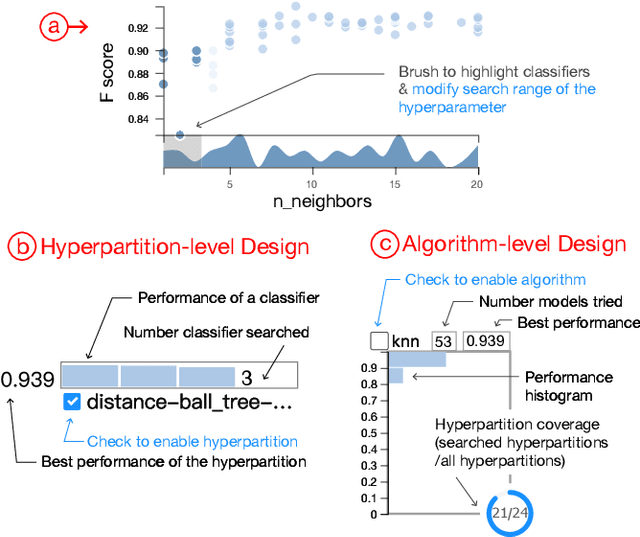
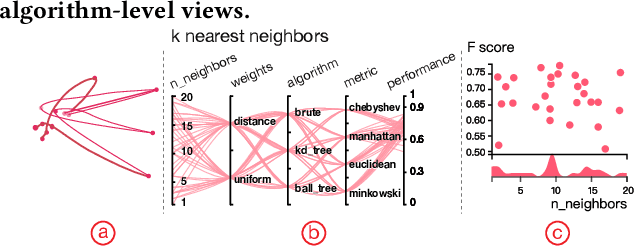
To relieve the pain of manually selecting machine learning algorithms and tuning hyperparameters, automated machine learning (AutoML) methods have been developed to automatically search for good models. Due to the huge model search space, it is impossible to try all models. Users tend to distrust automatic results and increase the search budget as much as they can, thereby undermining the efficiency of AutoML. To address these issues, we design and implement ATMSeer, an interactive visualization tool that supports users in refining the search space of AutoML and analyzing the results. To guide the design of ATMSeer, we derive a workflow of using AutoML based on interviews with machine learning experts. A multi-granularity visualization is proposed to enable users to monitor the AutoML process, analyze the searched models, and refine the search space in real time. We demonstrate the utility and usability of ATMSeer through two case studies, expert interviews, and a user study with 13 end users.
DeepTracker: Visualizing the Training Process of Convolutional Neural Networks
Aug 26, 2018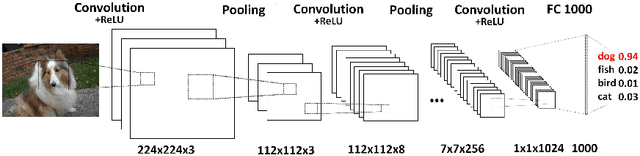
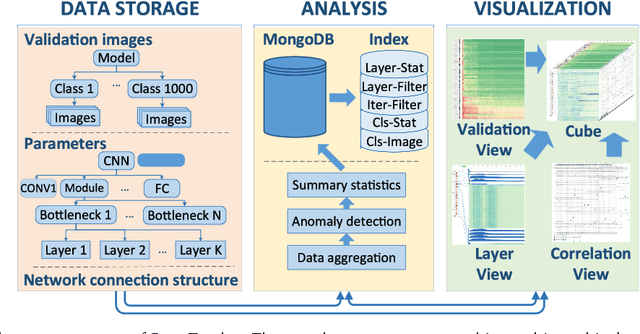
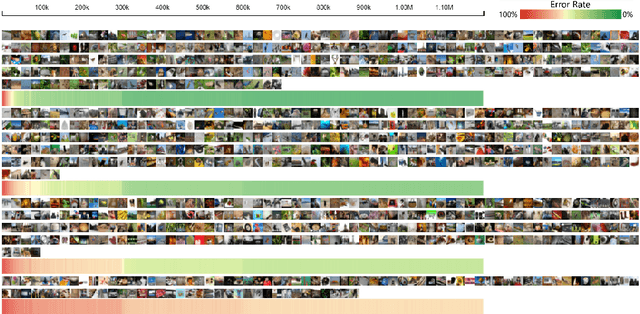
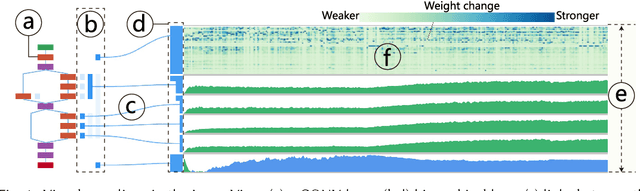
Deep convolutional neural networks (CNNs) have achieved remarkable success in various fields. However, training an excellent CNN is practically a trial-and-error process that consumes a tremendous amount of time and computer resources. To accelerate the training process and reduce the number of trials, experts need to understand what has occurred in the training process and why the resulting CNN behaves as such. However, current popular training platforms, such as TensorFlow, only provide very little and general information, such as training/validation errors, which is far from enough to serve this purpose. To bridge this gap and help domain experts with their training tasks in a practical environment, we propose a visual analytics system, DeepTracker, to facilitate the exploration of the rich dynamics of CNN training processes and to identify the unusual patterns that are hidden behind the huge amount of training log. Specifically,we combine a hierarchical index mechanism and a set of hierarchical small multiples to help experts explore the entire training log from different levels of detail. We also introduce a novel cube-style visualization to reveal the complex correlations among multiple types of heterogeneous training data including neuron weights, validation images, and training iterations. Three case studies are conducted to demonstrate how DeepTracker provides its users with valuable knowledge in an industry-level CNN training process, namely in our case, training ResNet-50 on the ImageNet dataset. We show that our method can be easily applied to other state-of-the-art "very deep" CNN models.