 Add to Chrome
 Add to Firefox
 Add to Edge
Phenotype-Guided Generative Model for High-Fidelity Cardiac MRI Synthesis: Advancing Pretraining and Clinical Applications
May 06, 2025


Cardiac Magnetic Resonance (CMR) imaging is a vital non-invasive tool for diagnosing heart diseases and evaluating cardiac health. However, the limited availability of large-scale, high-quality CMR datasets poses a major challenge to the effective application of artificial intelligence (AI) in this domain. Even the amount of unlabeled data and the health status it covers are difficult to meet the needs of model pretraining, which hinders the performance of AI models on downstream tasks. In this study, we present Cardiac Phenotype-Guided CMR Generation (CPGG), a novel approach for generating diverse CMR data that covers a wide spectrum of cardiac health status. The CPGG framework consists of two stages: in the first stage, a generative model is trained using cardiac phenotypes derived from CMR data; in the second stage, a masked autoregressive diffusion model, conditioned on these phenotypes, generates high-fidelity CMR cine sequences that capture both structural and functional features of the heart in a fine-grained manner. We synthesized a massive amount of CMR to expand the pretraining data. Experimental results show that CPGG generates high-quality synthetic CMR data, significantly improving performance on various downstream tasks, including diagnosis and cardiac phenotypes prediction. These gains are demonstrated across both public and private datasets, highlighting the effectiveness of our approach. Code is availabel at https://anonymous.4open.science/r/CPGG.
Fast2comm:Collaborative perception combined with prior knowledge
Apr 30, 2025Collaborative perception has the potential to significantly enhance perceptual accuracy through the sharing of complementary information among agents. However, real-world collaborative perception faces persistent challenges, particularly in balancing perception performance and bandwidth limitations, as well as coping with localization errors. To address these challenges, we propose Fast2comm, a prior knowledge-based collaborative perception framework. Specifically, (1)we propose a prior-supervised confidence feature generation method, that effectively distinguishes foreground from background by producing highly discriminative confidence features; (2)we propose GT Bounding Box-based spatial prior feature selection strategy to ensure that only the most informative prior-knowledge features are selected and shared, thereby minimizing background noise and optimizing bandwidth efficiency while enhancing adaptability to localization inaccuracies; (3)we decouple the feature fusion strategies between model training and testing phases, enabling dynamic bandwidth adaptation. To comprehensively validate our framework, we conduct extensive experiments on both real-world and simulated datasets. The results demonstrate the superior performance of our model and highlight the necessity of the proposed methods. Our code is available at https://github.com/Zhangzhengbin-TJ/Fast2comm.
Large-scale cross-modality pretrained model enhances cardiovascular state estimation and cardiomyopathy detection from electrocardiograms: An AI system development and multi-center validation study
Nov 19, 2024


Cardiovascular diseases (CVDs) present significant challenges for early and accurate diagnosis. While cardiac magnetic resonance imaging (CMR) is the gold standard for assessing cardiac function and diagnosing CVDs, its high cost and technical complexity limit accessibility. In contrast, electrocardiography (ECG) offers promise for large-scale early screening. This study introduces CardiacNets, an innovative model that enhances ECG analysis by leveraging the diagnostic strengths of CMR through cross-modal contrastive learning and generative pretraining. CardiacNets serves two primary functions: (1) it evaluates detailed cardiac function indicators and screens for potential CVDs, including coronary artery disease, cardiomyopathy, pericarditis, heart failure and pulmonary hypertension, using ECG input; and (2) it enhances interpretability by generating high-quality CMR images from ECG data. We train and validate the proposed CardiacNets on two large-scale public datasets (the UK Biobank with 41,519 individuals and the MIMIC-IV-ECG comprising 501,172 samples) as well as three private datasets (FAHZU with 410 individuals, SAHZU with 464 individuals, and QPH with 338 individuals), and the findings demonstrate that CardiacNets consistently outperforms traditional ECG-only models, substantially improving screening accuracy. Furthermore, the generated CMR images provide valuable diagnostic support for physicians of all experience levels. This proof-of-concept study highlights how ECG can facilitate cross-modal insights into cardiac function assessment, paving the way for enhanced CVD screening and diagnosis at a population level.
Cauchy activation function and XNet
Sep 28, 2024We have developed a novel activation function, named the Cauchy Activation Function. This function is derived from the Cauchy Integral Theorem in complex analysis and is specifically tailored for problems requiring high precision. This innovation has led to the creation of a new class of neural networks, which we call (Comple)XNet, or simply XNet. We will demonstrate that XNet is particularly effective for high-dimensional challenges such as image classification and solving Partial Differential Equations (PDEs). Our evaluations show that XNet significantly outperforms established benchmarks like MNIST and CIFAR-10 in computer vision, and offers substantial advantages over Physics-Informed Neural Networks (PINNs) in both low-dimensional and high-dimensional PDE scenarios.
Cross-Phase Mutual Learning Framework for Pulmonary Embolism Identification on Non-Contrast CT Scans
Jul 16, 2024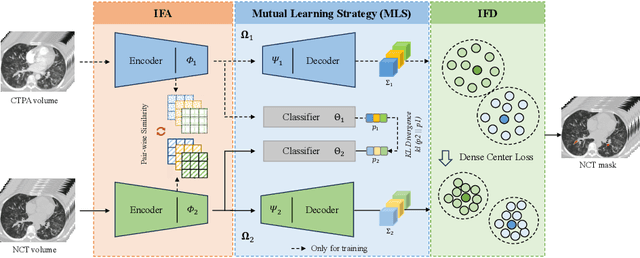
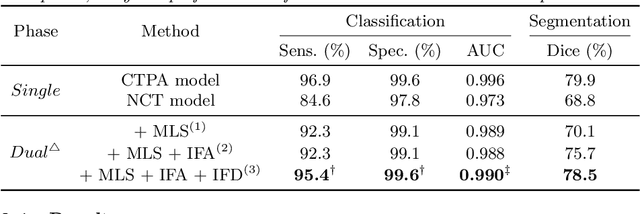
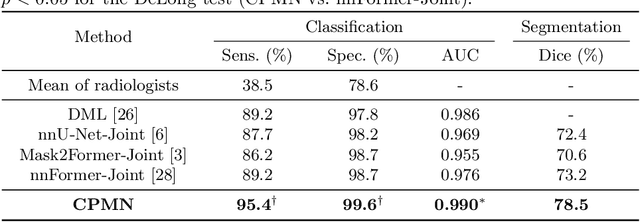
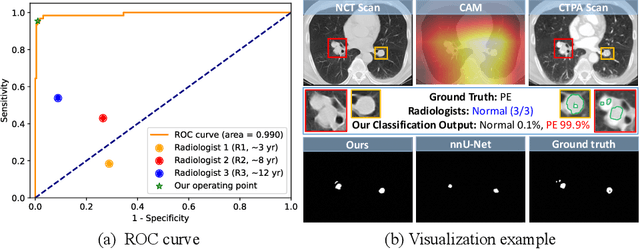
Pulmonary embolism (PE) is a life-threatening condition where rapid and accurate diagnosis is imperative yet difficult due to predominantly atypical symptomatology. Computed tomography pulmonary angiography (CTPA) is acknowledged as the gold standard imaging tool in clinics, yet it can be contraindicated for emergency department (ED) patients and represents an onerous procedure, thus necessitating PE identification through non-contrast CT (NCT) scans. In this work, we explore the feasibility of applying a deep-learning approach to NCT scans for PE identification. We propose a novel Cross-Phase Mutual learNing framework (CPMN) that fosters knowledge transfer from CTPA to NCT, while concurrently conducting embolism segmentation and abnormality classification in a multi-task manner. The proposed CPMN leverages the Inter-Feature Alignment (IFA) strategy that enhances spatial contiguity and mutual learning between the dual-pathway network, while the Intra-Feature Discrepancy (IFD) strategy can facilitate precise segmentation of PE against complex backgrounds for single-pathway networks. For a comprehensive assessment of the proposed approach, a large-scale dual-phase dataset containing 334 PE patients and 1,105 normal subjects has been established. Experimental results demonstrate that CPMN achieves the leading identification performance, which is 95.4\% and 99.6\% in patient-level sensitivity and specificity on NCT scans, indicating the potential of our approach as an economical, accessible, and precise tool for PE identification in clinical practice.
Rapid and Accurate Diagnosis of Acute Aortic Syndrome using Non-contrast CT: A Large-scale, Retrospective, Multi-center and AI-based Study
Jun 25, 2024


Chest pain symptoms are highly prevalent in emergency departments (EDs), where acute aortic syndrome (AAS) is a catastrophic cardiovascular emergency with a high fatality rate, especially when timely and accurate treatment is not administered. However, current triage practices in the ED can cause up to approximately half of patients with AAS to have an initially missed diagnosis or be misdiagnosed as having other acute chest pain conditions. Subsequently, these AAS patients will undergo clinically inaccurate or suboptimal differential diagnosis. Fortunately, even under these suboptimal protocols, nearly all these patients underwent non-contrast CT covering the aorta anatomy at the early stage of differential diagnosis. In this study, we developed an artificial intelligence model (DeepAAS) using non-contrast CT, which is highly accurate for identifying AAS and provides interpretable results to assist in clinical decision-making. Performance was assessed in two major phases: a multi-center retrospective study (n = 20,750) and an exploration in real-world emergency scenarios (n = 137,525). In the multi-center cohort, DeepAAS achieved a mean area under the receiver operating characteristic curve of 0.958 (95% CI 0.950-0.967). In the real-world cohort, DeepAAS detected 109 AAS patients with misguided initial suspicion, achieving 92.6% (95% CI 76.2%-97.5%) in mean sensitivity and 99.2% (95% CI 99.1%-99.3%) in mean specificity. Our AI model performed well on non-contrast CT at all applicable early stages of differential diagnosis workflows, effectively reduced the overall missed diagnosis and misdiagnosis rate from 48.8% to 4.8% and shortened the diagnosis time for patients with misguided initial suspicion from an average of 681.8 (74-11,820) mins to 68.5 (23-195) mins. DeepAAS could effectively fill the gap in the current clinical workflow without requiring additional tests.
A Modified PINN Approach for Identifiable Compartmental Models in Epidemiology with Applications to COVID-19
Aug 01, 2022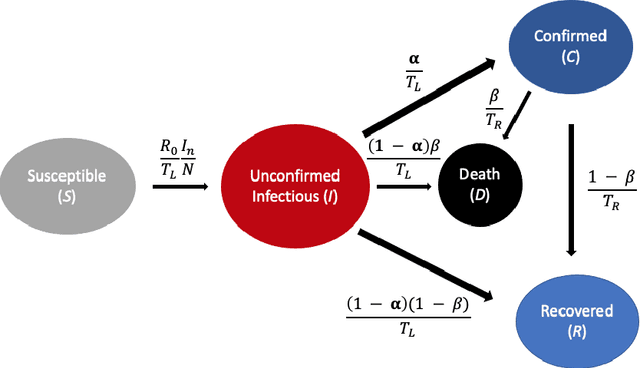
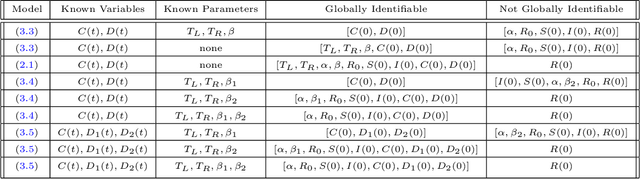
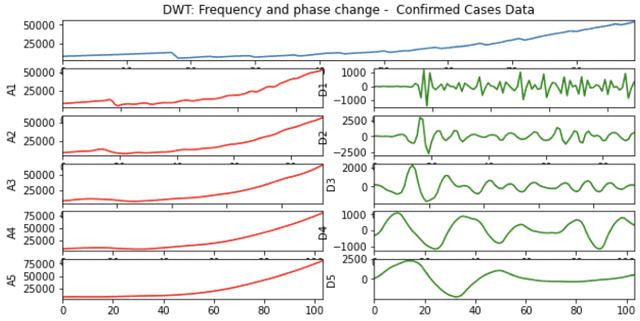
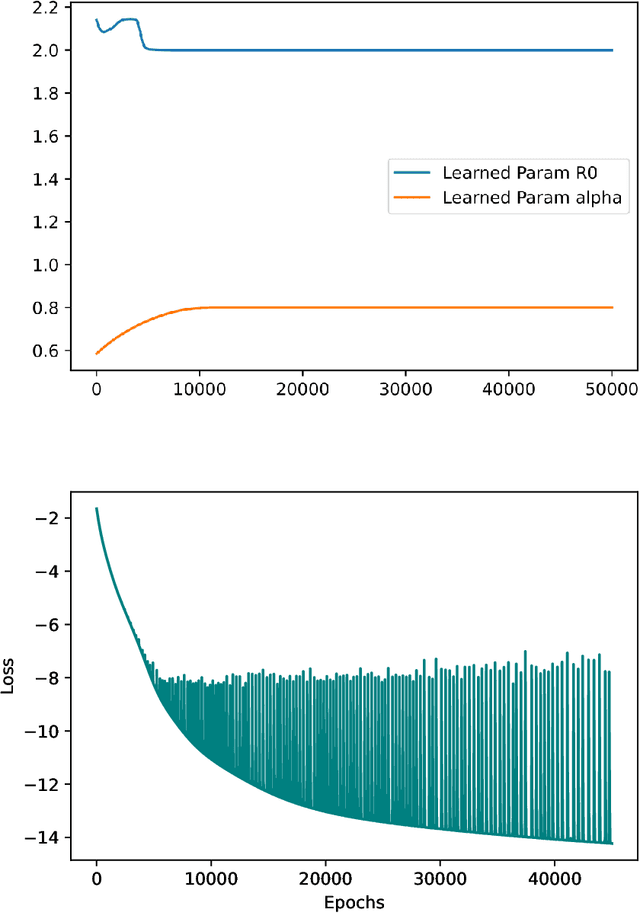
A variety of approaches using compartmental models have been used to study the COVID-19 pandemic and the usage of machine learning methods with these models has had particularly notable success. We present here an approach toward analyzing accessible data on Covid-19's U.S. development using a variation of the "Physics Informed Neural Networks" (PINN) which is capable of using the knowledge of the model to aid learning. We illustrate the challenges of using the standard PINN approach, then how with appropriate and novel modifications to the loss function the network can perform well even in our case of incomplete information. Aspects of identifiability of the model parameters are also assessed, as well as methods of denoising available data using a wavelet transform. Finally, we discuss the capability of the neural network methodology to work with models of varying parameter values, as well as a concrete application in estimating how effectively cases are being tested for in a population, providing a ranking of U.S. states by means of their respective testing.
Analysis of the Spatio-temporal Dynamics of COVID-19 in Massachusetts via Spectral Graph Wavelet Theory
Jul 28, 2022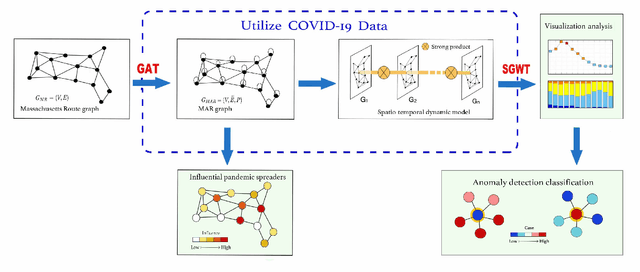
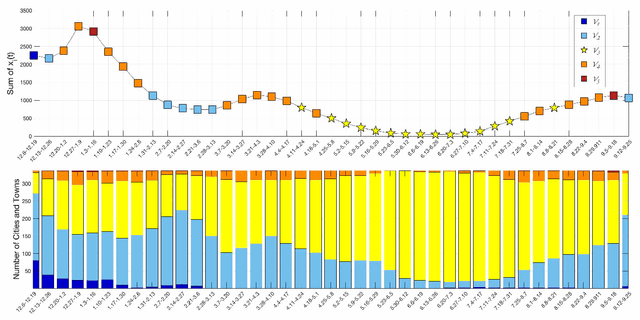
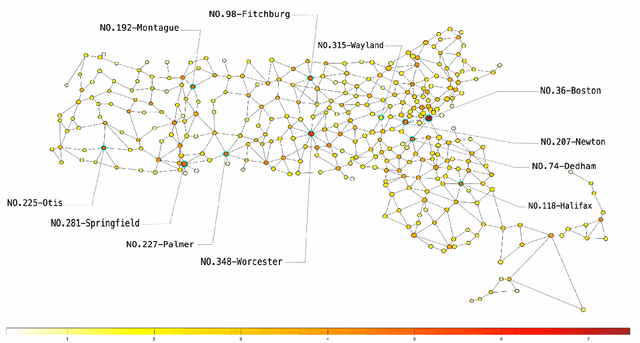
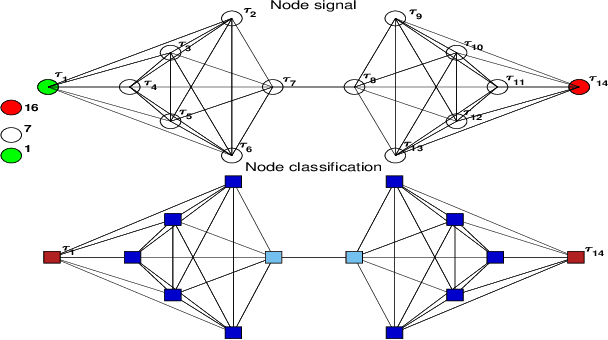
The rapid spread of COVID-19 disease has had a significant impact on the world. In this paper, we study COVID-19 data interpretation and visualization using open-data sources for 351 cities and towns in Massachusetts from December 6, 2020 to September 25, 2021. Because cities are embedded in rather complex transportation networks, we construct the spatio-temporal dynamic graph model, in which the graph attention neural network is utilized as a deep learning method to learn the pandemic transition probability among major cities in Massachusetts. Using the spectral graph wavelet transform (SGWT), we process the COVID-19 data on the dynamic graph, which enables us to design effective tools to analyze and detect spatio-temporal patterns in the pandemic spreading. We design a new node classification method, which effectively identifies the anomaly cities based on spectral graph wavelet coefficients. It can assist administrations or public health organizations in monitoring the spread of the pandemic and developing preventive measures. Unlike most work focusing on the evolution of confirmed cases over time, we focus on the spatio-temporal patterns of pandemic evolution among cities. Through the data analysis and visualization, a better understanding of the epidemiological development at the city level is obtained and can be helpful with city-specific surveillance.