 Add to Chrome
 Add to Firefox
 Add to Edge
DashboardQA: Benchmarking Multimodal Agents for Question Answering on Interactive Dashboards
Aug 24, 2025Dashboards are powerful visualization tools for data-driven decision-making, integrating multiple interactive views that allow users to explore, filter, and navigate data. Unlike static charts, dashboards support rich interactivity, which is essential for uncovering insights in real-world analytical workflows. However, existing question-answering benchmarks for data visualizations largely overlook this interactivity, focusing instead on static charts. This limitation severely constrains their ability to evaluate the capabilities of modern multimodal agents designed for GUI-based reasoning. To address this gap, we introduce DashboardQA, the first benchmark explicitly designed to assess how vision-language GUI agents comprehend and interact with real-world dashboards. The benchmark includes 112 interactive dashboards from Tableau Public and 405 question-answer pairs with interactive dashboards spanning five categories: multiple-choice, factoid, hypothetical, multi-dashboard, and conversational. By assessing a variety of leading closed- and open-source GUI agents, our analysis reveals their key limitations, particularly in grounding dashboard elements, planning interaction trajectories, and performing reasoning. Our findings indicate that interactive dashboard reasoning is a challenging task overall for all the VLMs evaluated. Even the top-performing agents struggle; for instance, the best agent based on Gemini-Pro-2.5 achieves only 38.69% accuracy, while the OpenAI CUA agent reaches just 22.69%, demonstrating the benchmark's significant difficulty. We release DashboardQA at https://github.com/vis-nlp/DashboardQA
Judging the Judges: Can Large Vision-Language Models Fairly Evaluate Chart Comprehension and Reasoning?
May 13, 2025Charts are ubiquitous as they help people understand and reason with data. Recently, various downstream tasks, such as chart question answering, chart2text, and fact-checking, have emerged. Large Vision-Language Models (LVLMs) show promise in tackling these tasks, but their evaluation is costly and time-consuming, limiting real-world deployment. While using LVLMs as judges to assess the chart comprehension capabilities of other LVLMs could streamline evaluation processes, challenges like proprietary datasets, restricted access to powerful models, and evaluation costs hinder their adoption in industrial settings. To this end, we present a comprehensive evaluation of 13 open-source LVLMs as judges for diverse chart comprehension and reasoning tasks. We design both pairwise and pointwise evaluation tasks covering criteria like factual correctness, informativeness, and relevancy. Additionally, we analyze LVLM judges based on format adherence, positional consistency, length bias, and instruction-following. We focus on cost-effective LVLMs (<10B parameters) suitable for both research and commercial use, following a standardized evaluation protocol and rubric to measure the LVLM judge's accuracy. Experimental results reveal notable variability: while some open LVLM judges achieve GPT-4-level evaluation performance (about 80% agreement with GPT-4 judgments), others struggle (below ~10% agreement). Our findings highlight that state-of-the-art open-source LVLMs can serve as cost-effective automatic evaluators for chart-related tasks, though biases such as positional preference and length bias persist.
ChartQAPro: A More Diverse and Challenging Benchmark for Chart Question Answering
Apr 10, 2025Charts are ubiquitous, as people often use them to analyze data, answer questions, and discover critical insights. However, performing complex analytical tasks with charts requires significant perceptual and cognitive effort. Chart Question Answering (CQA) systems automate this process by enabling models to interpret and reason with visual representations of data. However, existing benchmarks like ChartQA lack real-world diversity and have recently shown performance saturation with modern large vision-language models (LVLMs). To address these limitations, we introduce ChartQAPro, a new benchmark that includes 1,341 charts from 157 diverse sources, spanning various chart types, including infographics and dashboards, and featuring 1,948 questions in various types, such as multiple-choice, conversational, hypothetical, and unanswerable questions, to better reflect real-world challenges. Our evaluations with 21 models show a substantial performance drop for LVLMs on ChartQAPro; e.g., Claude Sonnet 3.5 scores 90.5% on ChartQA but only 55.81% on ChartQAPro, underscoring the complexity of chart reasoning. We complement our findings with detailed error analyses and ablation studies, identifying key challenges and opportunities for advancing LVLMs in chart understanding and reasoning. We release ChartQAPro at https://github.com/vis-nlp/ChartQAPro.
AlignVLM: Bridging Vision and Language Latent Spaces for Multimodal Understanding
Feb 03, 2025


Aligning visual features with language embeddings is a key challenge in vision-language models (VLMs). The performance of such models hinges on having a good connector that maps visual features generated by a vision encoder to a shared embedding space with the LLM while preserving semantic similarity. Existing connectors, such as multilayer perceptrons (MLPs), often produce out-of-distribution or noisy inputs, leading to misalignment between the modalities. In this work, we propose a novel vision-text alignment method, AlignVLM, that maps visual features to a weighted average of LLM text embeddings. Our approach leverages the linguistic priors encoded by the LLM to ensure that visual features are mapped to regions of the space that the LLM can effectively interpret. AlignVLM is particularly effective for document understanding tasks, where scanned document images must be accurately mapped to their textual content. Our extensive experiments show that AlignVLM achieves state-of-the-art performance compared to prior alignment methods. We provide further analysis demonstrating improved vision-text feature alignment and robustness to noise.
BigDocs: An Open and Permissively-Licensed Dataset for Training Multimodal Models on Document and Code Tasks
Dec 05, 2024


Multimodal AI has the potential to significantly enhance document-understanding tasks, such as processing receipts, understanding workflows, extracting data from documents, and summarizing reports. Code generation tasks that require long-structured outputs can also be enhanced by multimodality. Despite this, their use in commercial applications is often limited due to limited access to training data and restrictive licensing, which hinders open access. To address these limitations, we introduce BigDocs-7.5M, a high-quality, open-access dataset comprising 7.5 million multimodal documents across 30 tasks. We use an efficient data curation process to ensure our data is high-quality and license-permissive. Our process emphasizes accountability, responsibility, and transparency through filtering rules, traceable metadata, and careful content analysis. Additionally, we introduce BigDocs-Bench, a benchmark suite with 10 novel tasks where we create datasets that reflect real-world use cases involving reasoning over Graphical User Interfaces (GUI) and code generation from images. Our experiments show that training with BigDocs-Bench improves average performance up to 25.8% over closed-source GPT-4o in document reasoning and structured output tasks such as Screenshot2HTML or Image2Latex generation. Finally, human evaluations showed a preference for outputs from models trained on BigDocs over GPT-4o. This suggests that BigDocs can help both academics and the open-source community utilize and improve AI tools to enhance multimodal capabilities and document reasoning. The project is hosted at https://bigdocs.github.io .
ChartGemma: Visual Instruction-tuning for Chart Reasoning in the Wild
Jul 04, 2024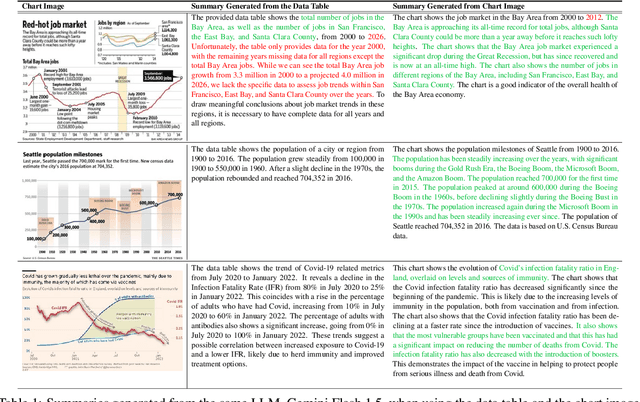
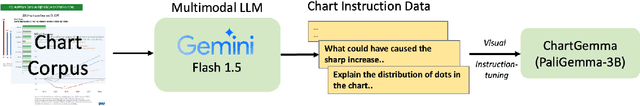
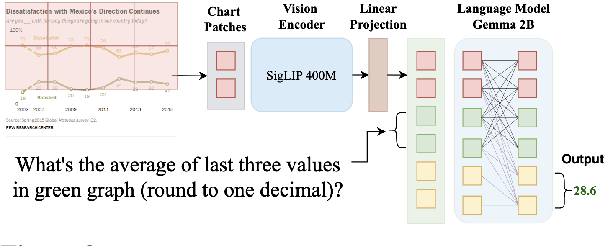
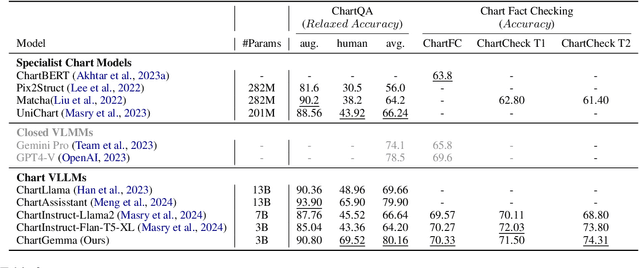
Given the ubiquity of charts as a data analysis, visualization, and decision-making tool across industries and sciences, there has been a growing interest in developing pre-trained foundation models as well as general purpose instruction-tuned models for chart understanding and reasoning. However, existing methods suffer crucial drawbacks across two critical axes affecting the performance of chart representation models: they are trained on data generated from underlying data tables of the charts, ignoring the visual trends and patterns in chart images, and use weakly aligned vision-language backbone models for domain-specific training, limiting their generalizability when encountering charts in the wild. We address these important drawbacks and introduce ChartGemma, a novel chart understanding and reasoning model developed over PaliGemma. Rather than relying on underlying data tables, ChartGemma is trained on instruction-tuning data generated directly from chart images, thus capturing both high-level trends and low-level visual information from a diverse set of charts. Our simple approach achieves state-of-the-art results across $5$ benchmarks spanning chart summarization, question answering, and fact-checking, and our elaborate qualitative studies on real-world charts show that ChartGemma generates more realistic and factually correct summaries compared to its contemporaries. We release the code, model checkpoints, dataset, and demos at https://github.com/vis-nlp/ChartGemma.
Are Large Vision Language Models up to the Challenge of Chart Comprehension and Reasoning? An Extensive Investigation into the Capabilities and Limitations of LVLMs
Jun 01, 2024


Natural language is a powerful complementary modality of communication for data visualizations, such as bar and line charts. To facilitate chart-based reasoning using natural language, various downstream tasks have been introduced recently such as chart question answering, chart summarization, and fact-checking with charts. These tasks pose a unique challenge, demanding both vision-language reasoning and a nuanced understanding of chart data tables, visual encodings, and natural language prompts. Despite the recent success of Large Language Models (LLMs) across diverse NLP tasks, their abilities and limitations in the realm of data visualization remain under-explored, possibly due to their lack of multi-modal capabilities. To bridge the gap, this paper presents the first comprehensive evaluation of the recently developed large vision language models (LVLMs) for chart understanding and reasoning tasks. Our evaluation includes a comprehensive assessment of LVLMs, including GPT-4V and Gemini, across four major chart reasoning tasks. Furthermore, we perform a qualitative evaluation of LVLMs' performance on a diverse range of charts, aiming to provide a thorough analysis of their strengths and weaknesses. Our findings reveal that LVLMs demonstrate impressive abilities in generating fluent texts covering high-level data insights while also encountering common problems like hallucinations, factual errors, and data bias. We highlight the key strengths and limitations of chart comprehension tasks, offering insights for future research.
ChartInstruct: Instruction Tuning for Chart Comprehension and Reasoning
Mar 14, 2024Charts provide visual representations of data and are widely used for analyzing information, addressing queries, and conveying insights to others. Various chart-related downstream tasks have emerged recently, such as question-answering and summarization. A common strategy to solve these tasks is to fine-tune various models originally trained on vision tasks language. However, such task-specific models are not capable of solving a wide range of chart-related tasks, constraining their real-world applicability. To overcome these challenges, we introduce ChartInstruct: a novel chart-specific vision-language Instruction-following dataset comprising 191K instructions generated with 71K charts. We then present two distinct systems for instruction tuning on such datasets: (1) an end-to-end model that connects a vision encoder for chart understanding with a LLM; and (2) a pipeline model that employs a two-step approach to extract chart data tables and input them into the LLM. In experiments on four downstream tasks, we first show the effectiveness of our model--achieving a new set of state-of-the-art results. Further evaluation shows that our instruction-tuning approach supports a wide array of real-world chart comprehension and reasoning scenarios, thereby expanding the scope and applicability of our models to new kinds of tasks.
LongFin: A Multimodal Document Understanding Model for Long Financial Domain Documents
Jan 26, 2024Document AI is a growing research field that focuses on the comprehension and extraction of information from scanned and digital documents to make everyday business operations more efficient. Numerous downstream tasks and datasets have been introduced to facilitate the training of AI models capable of parsing and extracting information from various document types such as receipts and scanned forms. Despite these advancements, both existing datasets and models fail to address critical challenges that arise in industrial contexts. Existing datasets primarily comprise short documents consisting of a single page, while existing models are constrained by a limited maximum length, often set at 512 tokens. Consequently, the practical application of these methods in financial services, where documents can span multiple pages, is severely impeded. To overcome these challenges, we introduce LongFin, a multimodal document AI model capable of encoding up to 4K tokens. We also propose the LongForms dataset, a comprehensive financial dataset that encapsulates several industrial challenges in financial documents. Through an extensive evaluation, we demonstrate the effectiveness of the LongFin model on the LongForms dataset, surpassing the performance of existing public models while maintaining comparable results on existing single-page benchmarks.
Do LLMs Work on Charts? Designing Few-Shot Prompts for Chart Question Answering and Summarization
Dec 17, 2023A number of tasks have been proposed recently to facilitate easy access to charts such as chart QA and summarization. The dominant paradigm to solve these tasks has been to fine-tune a pretrained model on the task data. However, this approach is not only expensive but also not generalizable to unseen tasks. On the other hand, large language models (LLMs) have shown impressive generalization capabilities to unseen tasks with zero- or few-shot prompting. However, their application to chart-related tasks is not trivial as these tasks typically involve considering not only the underlying data but also the visual features in the chart image. We propose PromptChart, a multimodal few-shot prompting framework with LLMs for chart-related applications. By analyzing the tasks carefully, we have come up with a set of prompting guidelines for each task to elicit the best few-shot performance from LLMs. We further propose a strategy to inject visual information into the prompts. Our experiments on three different chart-related information consumption tasks show that with properly designed prompts LLMs can excel on the benchmarks, achieving state-of-the-art.