 Add to Chrome
 Add to Firefox
 Add to Edge
"Time": models, code, and papers
Perfusion Quantification from Endoscopic Videos: Learning to Read Tumor Signatures
Jun 25, 2020
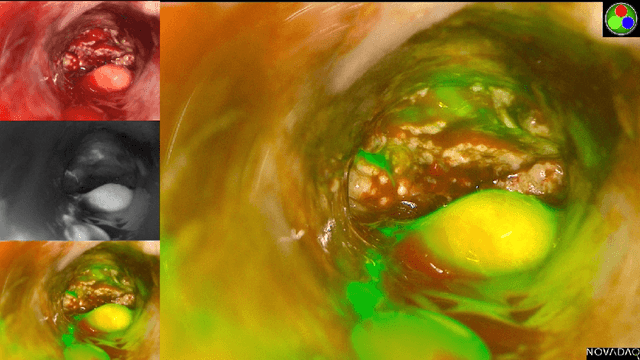
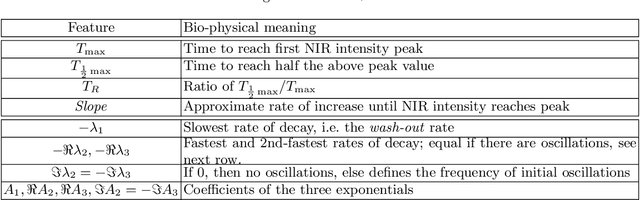
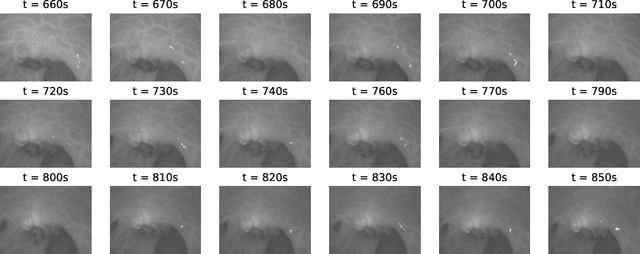
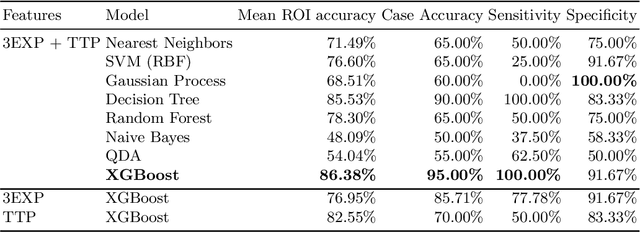
Intra-operative identification of malignant versus benign or healthy tissue is a major challenge in fluorescence guided cancer surgery. We propose a perfusion quantification method for computer-aided interpretation of subtle differences in dynamic perfusion patterns which can be used to distinguish between normal tissue and benign or malignant tumors intra-operatively in real-time by using multispectral endoscopic videos. The method exploits the fact that vasculature arising from cancer angiogenesis gives tumors differing perfusion patterns from the surrounding tissue, and defines a signature of tumor which could be used to differentiate tumors from normal tissues. Experimental evaluation of our method on a cohort of colorectal cancer surgery endoscopic videos suggests that the proposed tumor signature is able to successfully discriminate between healthy, cancerous and benign tissue with 95% accuracy.
Deep Learning Techniques for Geospatial Data Analysis
Aug 30, 2020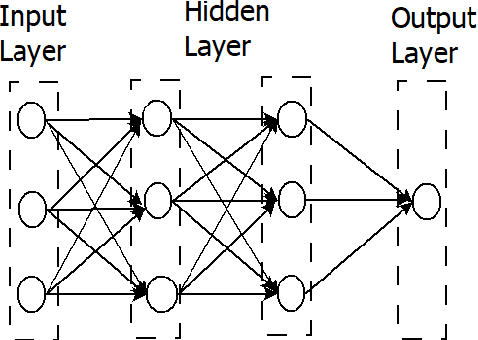
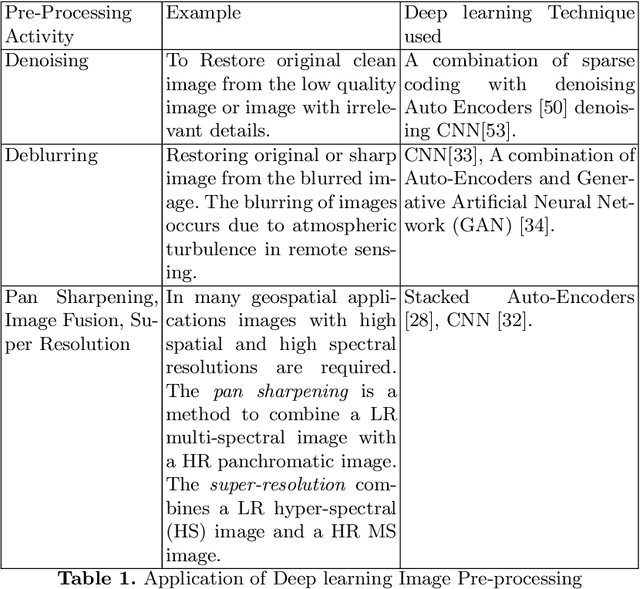
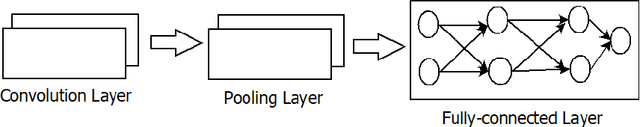
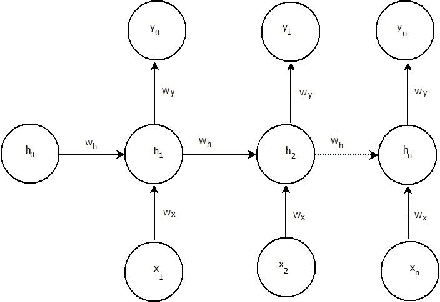
Consumer electronic devices such as mobile handsets, goods tagged with RFID labels, location and position sensors are continuously generating a vast amount of location enriched data called geospatial data. Conventionally such geospatial data is used for military applications. In recent times, many useful civilian applications have been designed and deployed around such geospatial data. For example, a recommendation system to suggest restaurants or places of attraction to a tourist visiting a particular locality. At the same time, civic bodies are harnessing geospatial data generated through remote sensing devices to provide better services to citizens such as traffic monitoring, pothole identification, and weather reporting. Typically such applications are leveraged upon non-hierarchical machine learning techniques such as Naive-Bayes Classifiers, Support Vector Machines, and decision trees. Recent advances in the field of deep-learning showed that Neural Network-based techniques outperform conventional techniques and provide effective solutions for many geospatial data analysis tasks such as object recognition, image classification, and scene understanding. The chapter presents a survey on the current state of the applications of deep learning techniques for analyzing geospatial data. The chapter is organized as below: (i) A brief overview of deep learning algorithms. (ii)Geospatial Analysis: a Data Science Perspective (iii) Deep-learning techniques for Remote Sensing data analytics tasks (iv) Deep-learning techniques for GPS data analytics(iv) Deep-learning techniques for RFID data analytics.
* This is a pre-print of the following chapter: Arvind W. Kiwelekar, Geetanjali S. Mahamunkar, Laxman D. Netak, Valmik B Nikam, {\em Deep Learning Techniques for Geospatial Data Analysis}, published in {\bf Machine Learning Paradigms}, edited by George A. TsihrintzisLakhmi C. Jain, 2020, publisher Springer, Cham reproduced with permission of publisher Springer, Cham
Optical Flow Distillation: Towards Efficient and Stable Video Style Transfer
Jul 10, 2020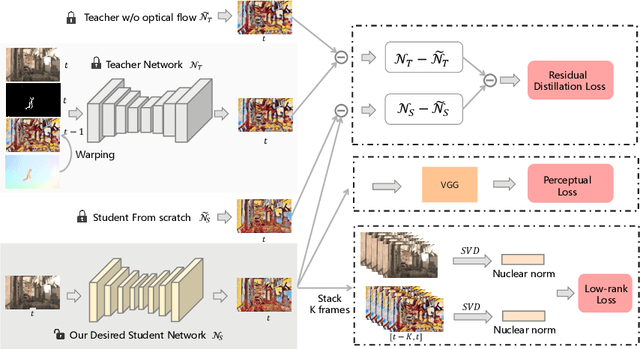
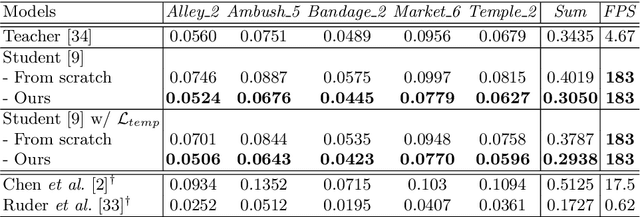
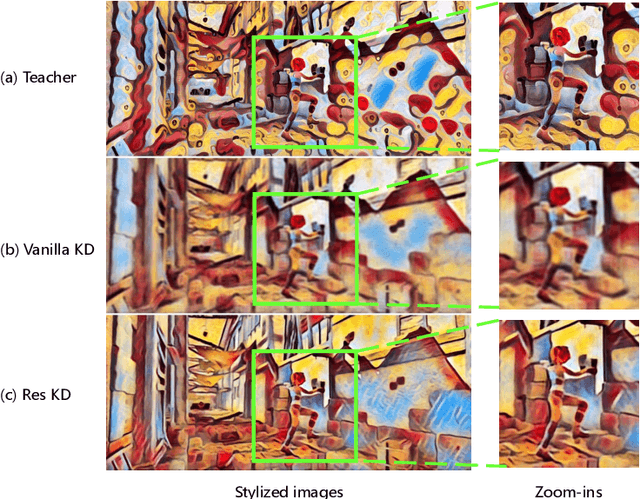
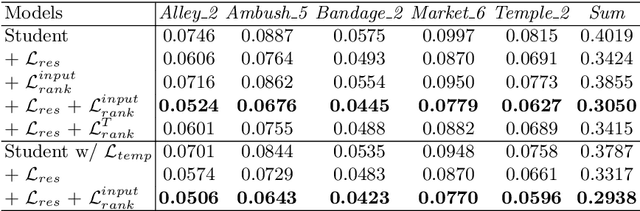
Video style transfer techniques inspire many exciting applications on mobile devices. However, their efficiency and stability are still far from satisfactory. To boost the transfer stability across frames, optical flow is widely adopted, despite its high computational complexity, e.g. occupying over 97% inference time. This paper proposes to learn a lightweight video style transfer network via knowledge distillation paradigm. We adopt two teacher networks, one of which takes optical flow during inference while the other does not. The output difference between these two teacher networks highlights the improvements made by optical flow, which is then adopted to distill the target student network. Furthermore, a low-rank distillation loss is employed to stabilize the output of student network by mimicking the rank of input videos. Extensive experiments demonstrate that our student network without an optical flow module is still able to generate stable video and runs much faster than the teacher network.
Mix2FLD: Downlink Federated Learning After Uplink Federated Distillation With Two-Way Mixup
Jun 17, 2020
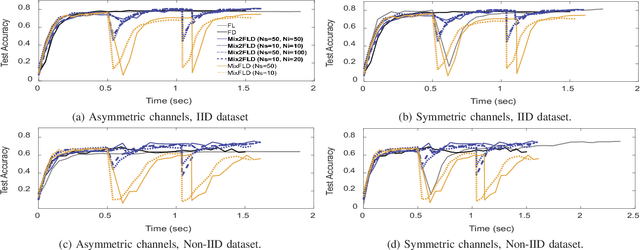
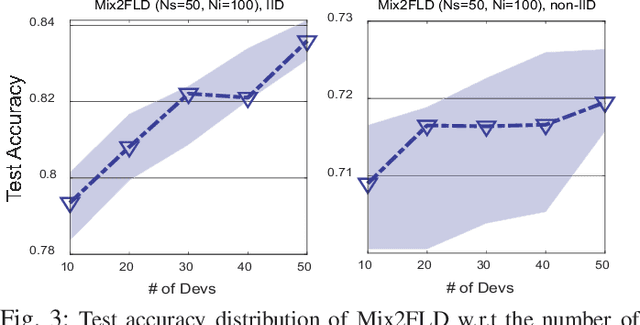
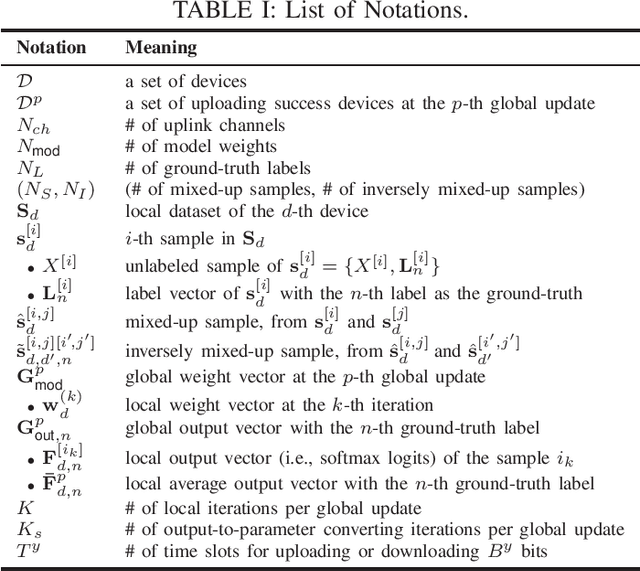
This letter proposes a novel communication-efficient and privacy-preserving distributed machine learning framework, coined Mix2FLD. To address uplink-downlink capacity asymmetry, local model outputs are uploaded to a server in the uplink as in federated distillation (FD), whereas global model parameters are downloaded in the downlink as in federated learning (FL). This requires a model output-to-parameter conversion at the server, after collecting additional data samples from devices. To preserve privacy while not compromising accuracy, linearly mixed-up local samples are uploaded, and inversely mixed up across different devices at the server. Numerical evaluations show that Mix2FLD achieves up to 16.7% higher test accuracy while reducing convergence time by up to 18.8% under asymmetric uplink-downlink channels compared to FL.
Bag-of-Words Representation for Biomedical Time Series Classification
Dec 11, 2012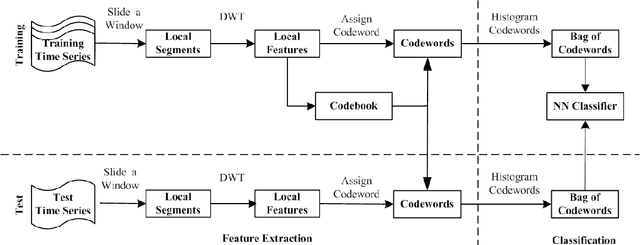
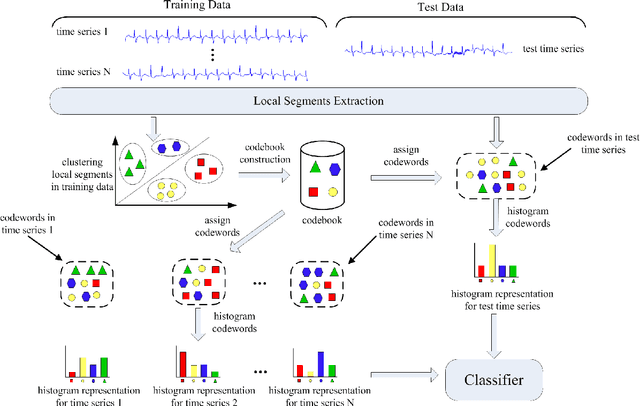
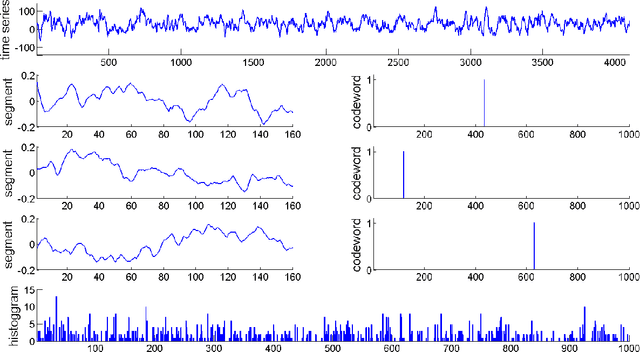
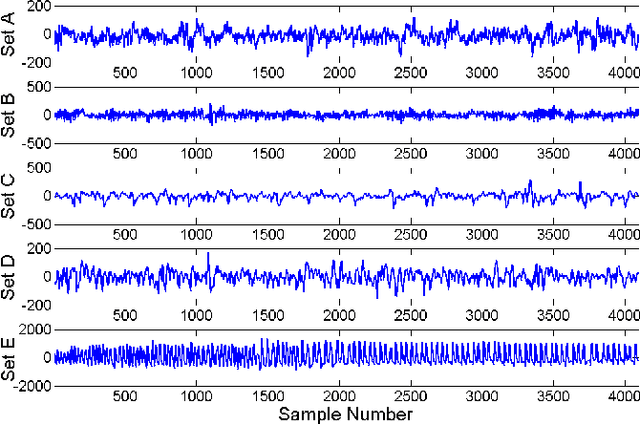
Automatic analysis of biomedical time series such as electroencephalogram (EEG) and electrocardiographic (ECG) signals has attracted great interest in the community of biomedical engineering due to its important applications in medicine. In this work, a simple yet effective bag-of-words representation that is able to capture both local and global structure similarity information is proposed for biomedical time series representation. In particular, similar to the bag-of-words model used in text document domain, the proposed method treats a time series as a text document and extracts local segments from the time series as words. The biomedical time series is then represented as a histogram of codewords, each entry of which is the count of a codeword appeared in the time series. Although the temporal order of the local segments is ignored, the bag-of-words representation is able to capture high-level structural information because both local and global structural information are well utilized. The performance of the bag-of-words model is validated on three datasets extracted from real EEG and ECG signals. The experimental results demonstrate that the proposed method is not only insensitive to parameters of the bag-of-words model such as local segment length and codebook size, but also robust to noise.
Challenges in Forecasting Malicious Events from Incomplete Data
Apr 06, 2020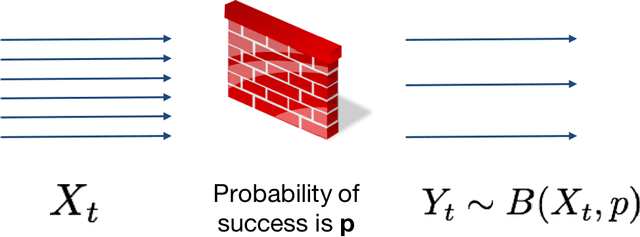
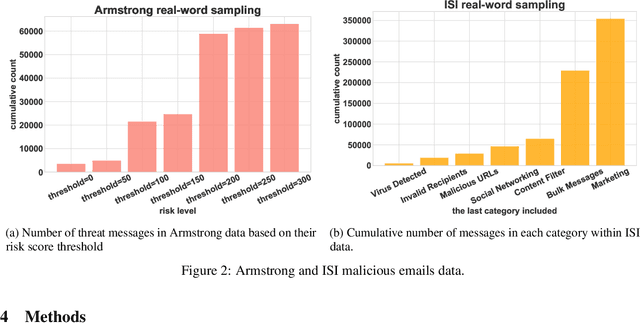
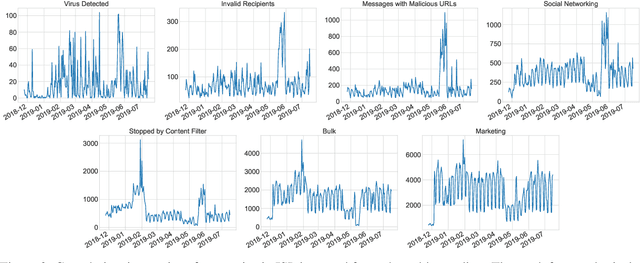
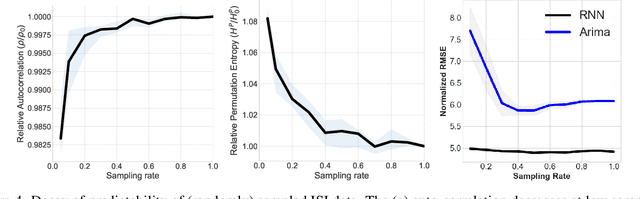
The ability to accurately predict cyber-attacks would enable organizations to mitigate their growing threat and avert the financial losses and disruptions they cause. But how predictable are cyber-attacks? Researchers have attempted to combine external data -- ranging from vulnerability disclosures to discussions on Twitter and the darkweb -- with machine learning algorithms to learn indicators of impending cyber-attacks. However, successful cyber-attacks represent a tiny fraction of all attempted attacks: the vast majority are stopped, or filtered by the security appliances deployed at the target. As we show in this paper, the process of filtering reduces the predictability of cyber-attacks. The small number of attacks that do penetrate the target's defenses follow a different generative process compared to the whole data which is much harder to learn for predictive models. This could be caused by the fact that the resulting time series also depends on the filtering process in addition to all the different factors that the original time series depended on. We empirically quantify the loss of predictability due to filtering using real-world data from two organizations. Our work identifies the limits to forecasting cyber-attacks from highly filtered data.
Exploring Bayesian Surprise to Prevent Overfitting and to Predict Model Performance in Non-Intrusive Load Monitoring
Sep 16, 2020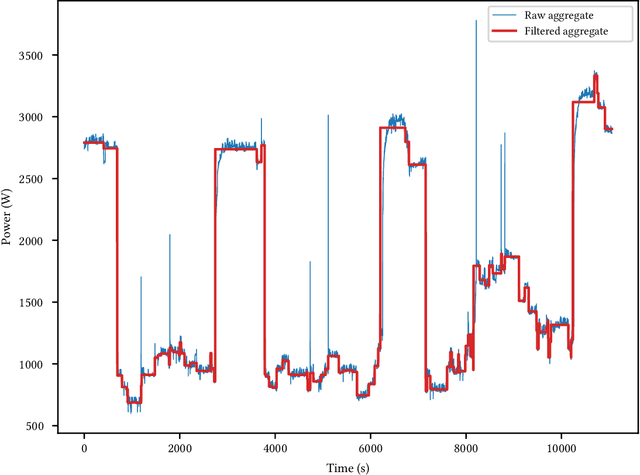
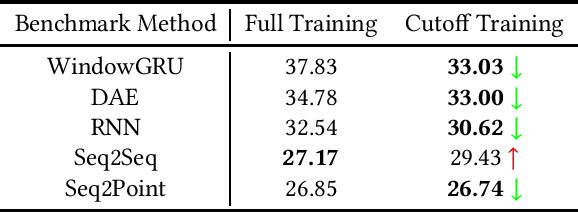
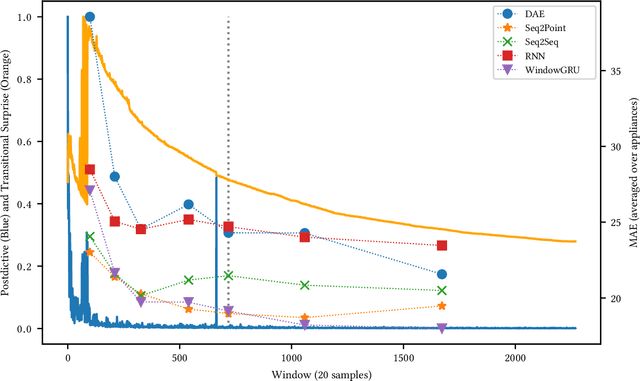
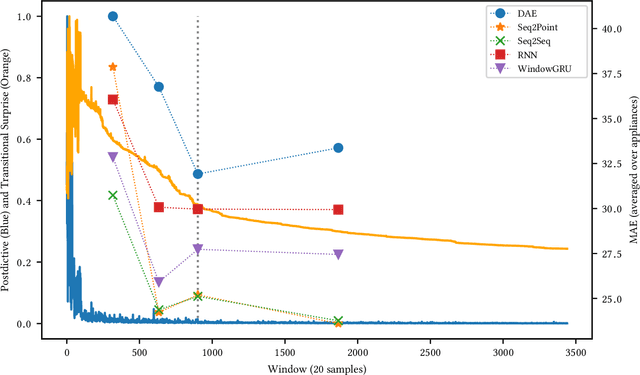
Non-Intrusive Load Monitoring (NILM) is a field of research focused on segregating constituent electrical loads in a system based only on their aggregated signal. Significant computational resources and research time are spent training models, often using as much data as possible, perhaps driven by the preconception that more data equates to more accurate models and better performing algorithms. When has enough prior training been done? When has a NILM algorithm encountered new, unseen data? This work applies the notion of Bayesian surprise to answer these questions which are important for both supervised and unsupervised algorithms. We quantify the degree of surprise between the predictive distribution (termed postdictive surprise), as well as the transitional probabilities (termed transitional surprise), before and after a window of observations. We compare the performance of several benchmark NILM algorithms supported by NILMTK, in order to establish a useful threshold on the two combined measures of surprise. We validate the use of transitional surprise by exploring the performance of a popular Hidden Markov Model as a function of surprise threshold. Finally, we explore the use of a surprise threshold as a regularization technique to avoid overfitting in cross-dataset performance. Although the generality of the specific surprise threshold discussed herein may be suspect without further testing, this work provides clear evidence that a point of diminishing returns of model performance with respect to dataset size exists. This has implications for future model development, dataset acquisition, as well as aiding in model flexibility during deployment.
Neural Machine Translation For Paraphrase Generation
Jun 25, 2020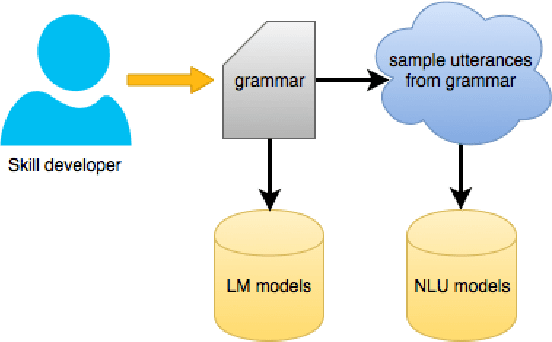
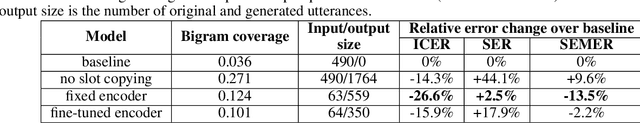
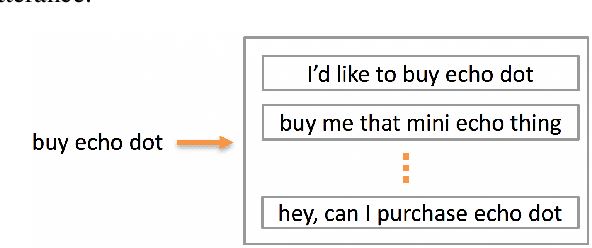
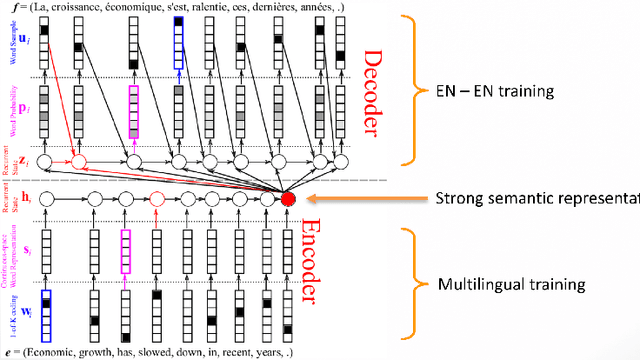
Training a spoken language understanding system, as the one in Alexa, typically requires a large human-annotated corpus of data. Manual annotations are expensive and time consuming. In Alexa Skill Kit (ASK) user experience with the skill greatly depends on the amount of data provided by skill developer. In this work, we present an automatic natural language generation system, capable of generating both human-like interactions and annotations by the means of paraphrasing. Our approach consists of machine translation (MT) inspired encoder-decoder deep recurrent neural network. We evaluate our model on the impact it has on ASK skill, intent, named entity classification accuracy and sentence level coverage, all of which demonstrate significant improvements for unseen skills on natural language understanding (NLU) models, trained on the data augmented with paraphrases.
Time Varying Undirected Graphs
Apr 29, 2008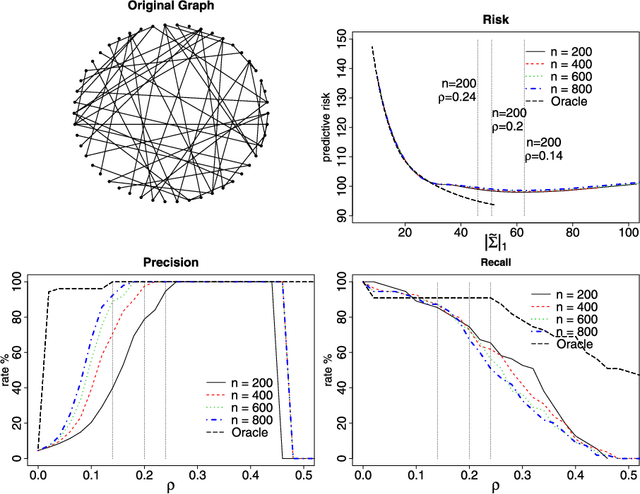
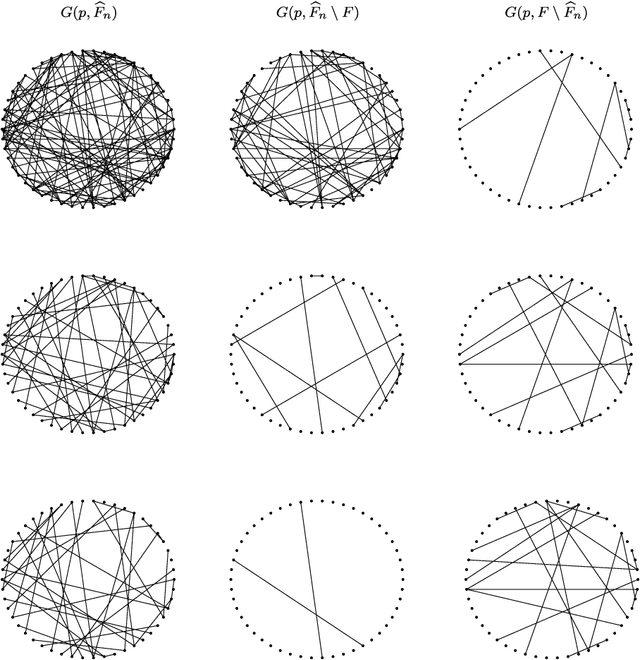
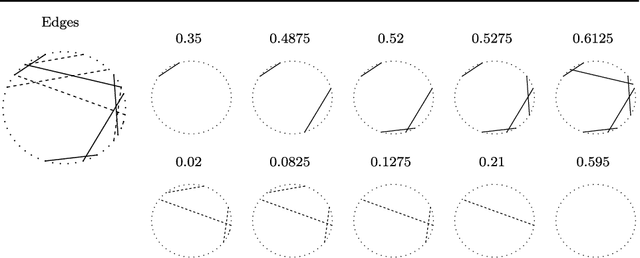
Undirected graphs are often used to describe high dimensional distributions. Under sparsity conditions, the graph can be estimated using $\ell_1$ penalization methods. However, current methods assume that the data are independent and identically distributed. If the distribution, and hence the graph, evolves over time then the data are not longer identically distributed. In this paper, we show how to estimate the sequence of graphs for non-identically distributed data, where the distribution evolves over time.
* 12 pages, 3 figures, to appear in COLT 2008
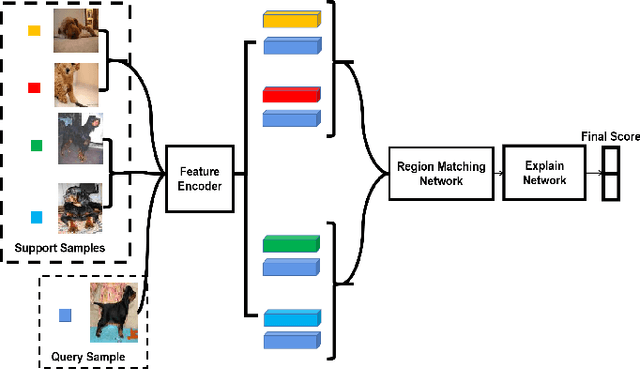
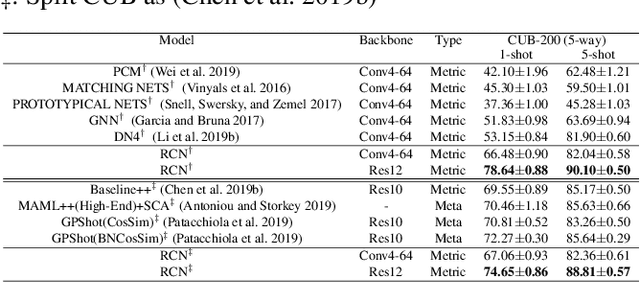
Region Comparison Network for Interpretable Few-shot Image Classification
Sep 08, 2020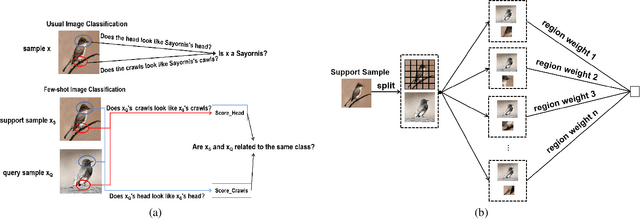
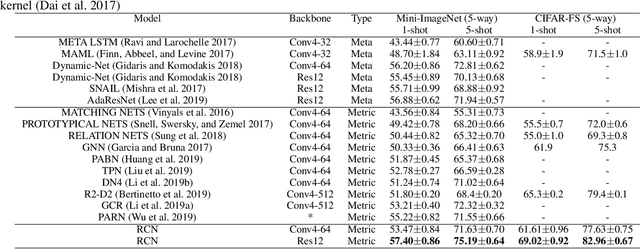
While deep learning has been successfully applied to many real-world computer vision tasks, training robust classifiers usually requires a large amount of well-labeled data. However, the annotation is often expensive and time-consuming. Few-shot image classification has thus been proposed to effectively use only a limited number of labeled examples to train models for new classes. Recent works based on transferable metric learning methods have achieved promising classification performance through learning the similarity between the features of samples from the query and support sets. However, rare of them explicitly considers the model interpretability, which can actually be revealed during the training phase. For that, in this work, we propose a metric learning based method named Region Comparison Network (RCN), which is able to reveal how few-shot learning works as in a neural network as well as to find out specific regions that are related to each other in images coming from the query and support sets. Moreover, we also present a visualization strategy named Region Activation Mapping (RAM) to intuitively explain what our method has learned by visualizing intermediate variables in our network. We also present a new way to generalize the interpretability from the level of tasks to categories, which can also be viewed as a method to find the prototypical parts for supporting the final decision of our RCN. Extensive experiments on four benchmark datasets clearly show the effectiveness of our method over existing baselines.