 Add to Chrome
 Add to Firefox
 Add to Edge
Safeguarding System Prompts for LLMs
Dec 18, 2024


Large language models (LLMs) are increasingly utilized in applications where system prompts, which guide model outputs, play a crucial role. These prompts often contain business logic and sensitive information, making their protection essential. However, adversarial and even regular user queries can exploit LLM vulnerabilities to expose these hidden prompts. To address this issue, we present PromptKeeper, a novel defense mechanism for system prompt privacy. By reliably detecting worst-case leakage and regenerating outputs without the system prompt when necessary, PromptKeeper ensures robust protection against prompt extraction attacks via either adversarial or regular queries, while preserving conversational capability and runtime efficiency during benign user interactions.
JailbreakHunter: A Visual Analytics Approach for Jailbreak Prompts Discovery from Large-Scale Human-LLM Conversational Datasets
Jul 03, 2024


Large Language Models (LLMs) have gained significant attention but also raised concerns due to the risk of misuse. Jailbreak prompts, a popular type of adversarial attack towards LLMs, have appeared and constantly evolved to breach the safety protocols of LLMs. To address this issue, LLMs are regularly updated with safety patches based on reported jailbreak prompts. However, malicious users often keep their successful jailbreak prompts private to exploit LLMs. To uncover these private jailbreak prompts, extensive analysis of large-scale conversational datasets is necessary to identify prompts that still manage to bypass the system's defenses. This task is highly challenging due to the immense volume of conversation data, diverse characteristics of jailbreak prompts, and their presence in complex multi-turn conversations. To tackle these challenges, we introduce JailbreakHunter, a visual analytics approach for identifying jailbreak prompts in large-scale human-LLM conversational datasets. We have designed a workflow with three analysis levels: group-level, conversation-level, and turn-level. Group-level analysis enables users to grasp the distribution of conversations and identify suspicious conversations using multiple criteria, such as similarity with reported jailbreak prompts in previous research and attack success rates. Conversation-level analysis facilitates the understanding of the progress of conversations and helps discover jailbreak prompts within their conversation contexts. Turn-level analysis allows users to explore the semantic similarity and token overlap between a singleturn prompt and the reported jailbreak prompts, aiding in the identification of new jailbreak strategies. The effectiveness and usability of the system were verified through multiple case studies and expert interviews.
CommonsenseVIS: Visualizing and Understanding Commonsense Reasoning Capabilities of Natural Language Models
Jul 23, 2023


Recently, large pretrained language models have achieved compelling performance on commonsense benchmarks. Nevertheless, it is unclear what commonsense knowledge the models learn and whether they solely exploit spurious patterns. Feature attributions are popular explainability techniques that identify important input concepts for model outputs. However, commonsense knowledge tends to be implicit and rarely explicitly presented in inputs. These methods cannot infer models' implicit reasoning over mentioned concepts. We present CommonsenseVIS, a visual explanatory system that utilizes external commonsense knowledge bases to contextualize model behavior for commonsense question-answering. Specifically, we extract relevant commonsense knowledge in inputs as references to align model behavior with human knowledge. Our system features multi-level visualization and interactive model probing and editing for different concepts and their underlying relations. Through a user study, we show that CommonsenseVIS helps NLP experts conduct a systematic and scalable visual analysis of models' relational reasoning over concepts in different situations.
HAPI: A Large-scale Longitudinal Dataset of Commercial ML API Predictions
Sep 18, 2022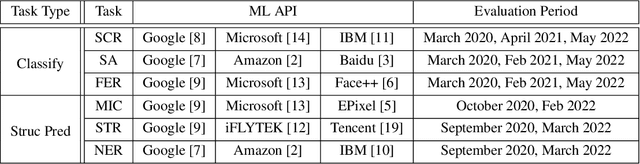
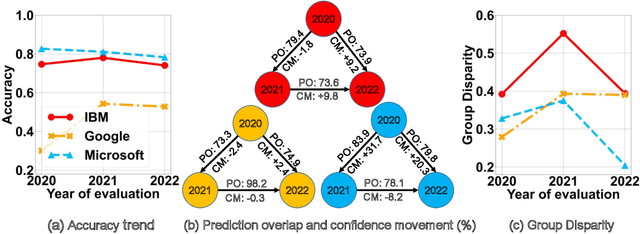
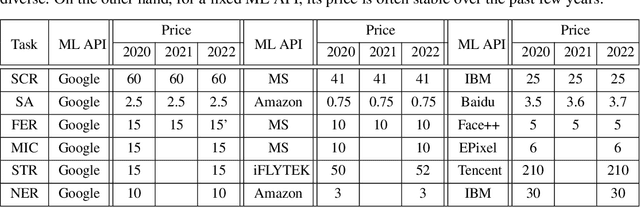
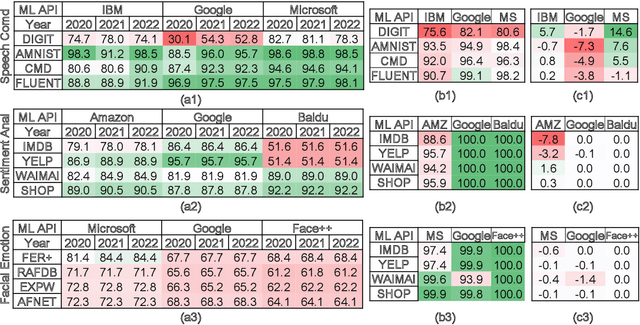
Commercial ML APIs offered by providers such as Google, Amazon and Microsoft have dramatically simplified ML adoption in many applications. Numerous companies and academics pay to use ML APIs for tasks such as object detection, OCR and sentiment analysis. Different ML APIs tackling the same task can have very heterogeneous performance. Moreover, the ML models underlying the APIs also evolve over time. As ML APIs rapidly become a valuable marketplace and a widespread way to consume machine learning, it is critical to systematically study and compare different APIs with each other and to characterize how APIs change over time. However, this topic is currently underexplored due to the lack of data. In this paper, we present HAPI (History of APIs), a longitudinal dataset of 1,761,417 instances of commercial ML API applications (involving APIs from Amazon, Google, IBM, Microsoft and other providers) across diverse tasks including image tagging, speech recognition and text mining from 2020 to 2022. Each instance consists of a query input for an API (e.g., an image or text) along with the API's output prediction/annotation and confidence scores. HAPI is the first large-scale dataset of ML API usages and is a unique resource for studying ML-as-a-service (MLaaS). As examples of the types of analyses that HAPI enables, we show that ML APIs' performance change substantially over time--several APIs' accuracies dropped on specific benchmark datasets. Even when the API's aggregate performance stays steady, its error modes can shift across different subtypes of data between 2020 and 2022. Such changes can substantially impact the entire analytics pipelines that use some ML API as a component. We further use HAPI to study commercial APIs' performance disparities across demographic subgroups over time. HAPI can stimulate more research in the growing field of MLaaS.
ShortcutLens: A Visual Analytics Approach for Exploring Shortcuts in Natural Language Understanding Dataset
Aug 17, 2022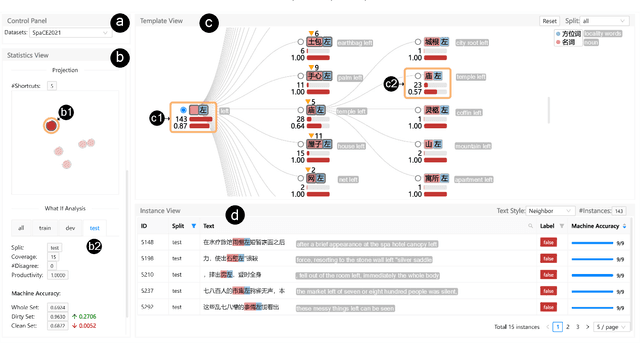
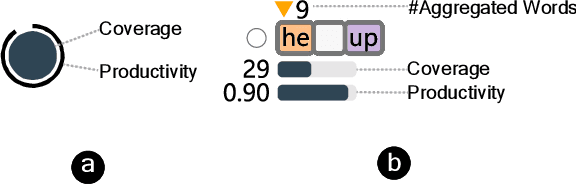
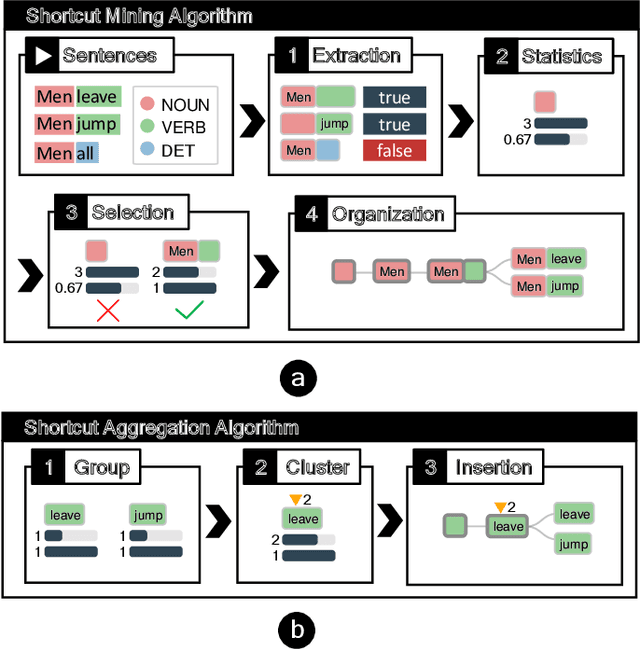
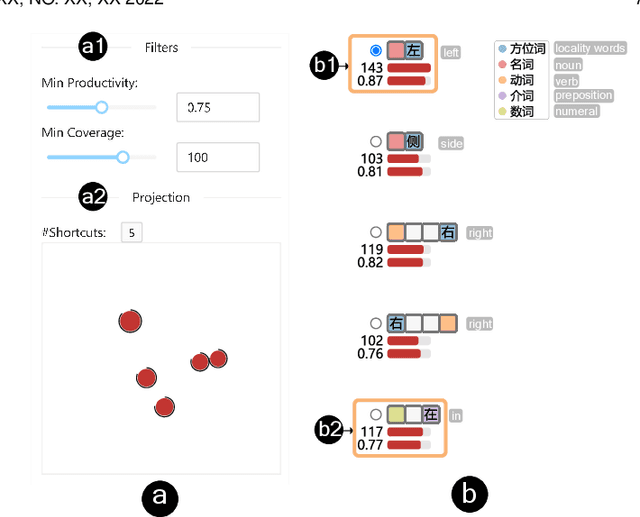
Benchmark datasets play an important role in evaluating Natural Language Understanding (NLU) models. However, shortcuts -- unwanted biases in the benchmark datasets -- can damage the effectiveness of benchmark datasets in revealing models' real capabilities. Since shortcuts vary in coverage, productivity, and semantic meaning, it is challenging for NLU experts to systematically understand and avoid them when creating benchmark datasets. In this paper, we develop a visual analytics system, ShortcutLens, to help NLU experts explore shortcuts in NLU benchmark datasets. The system allows users to conduct multi-level exploration of shortcuts. Specifically, Statistics View helps users grasp the statistics such as coverage and productivity of shortcuts in the benchmark dataset. Template View employs hierarchical and interpretable templates to summarize different types of shortcuts. Instance View allows users to check the corresponding instances covered by the shortcuts. We conduct case studies and expert interviews to evaluate the effectiveness and usability of the system. The results demonstrate that ShortcutLens supports users in gaining a better understanding of benchmark dataset issues through shortcuts, inspiring them to create challenging and pertinent benchmark datasets.
NumGPT: Improving Numeracy Ability of Generative Pre-trained Models
Sep 07, 2021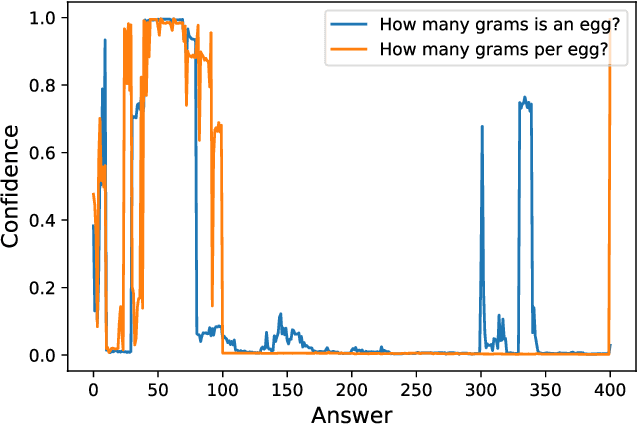
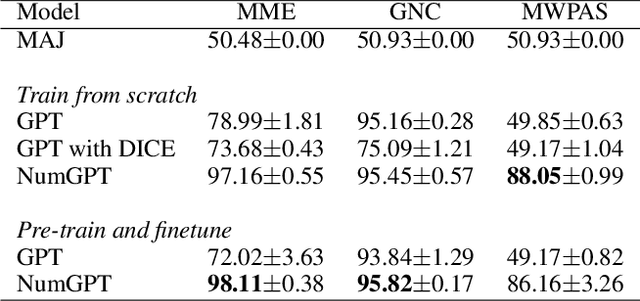
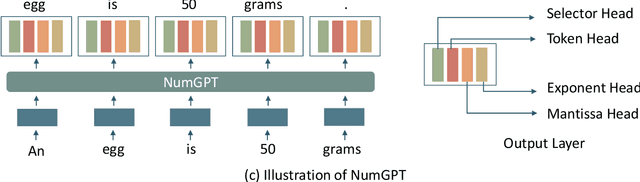
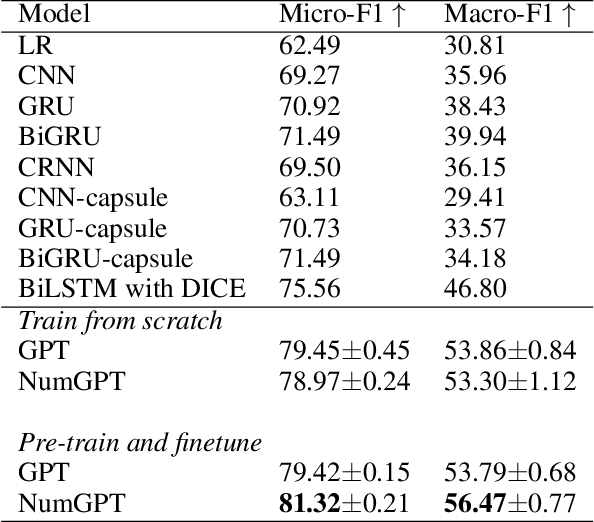
Existing generative pre-trained language models (e.g., GPT) focus on modeling the language structure and semantics of general texts. However, those models do not consider the numerical properties of numbers and cannot perform robustly on numerical reasoning tasks (e.g., math word problems and measurement estimation). In this paper, we propose NumGPT, a generative pre-trained model that explicitly models the numerical properties of numbers in texts. Specifically, it leverages a prototype-based numeral embedding to encode the mantissa of the number and an individual embedding to encode the exponent of the number. A numeral-aware loss function is designed to integrate numerals into the pre-training objective of NumGPT. We conduct extensive experiments on four different datasets to evaluate the numeracy ability of NumGPT. The experiment results show that NumGPT outperforms baseline models (e.g., GPT and GPT with DICE) on a range of numerical reasoning tasks such as measurement estimation, number comparison, math word problems, and magnitude classification. Ablation studies are also conducted to evaluate the impact of pre-training and model hyperparameters on the performance.
M2Lens: Visualizing and Explaining Multimodal Models for Sentiment Analysis
Aug 01, 2021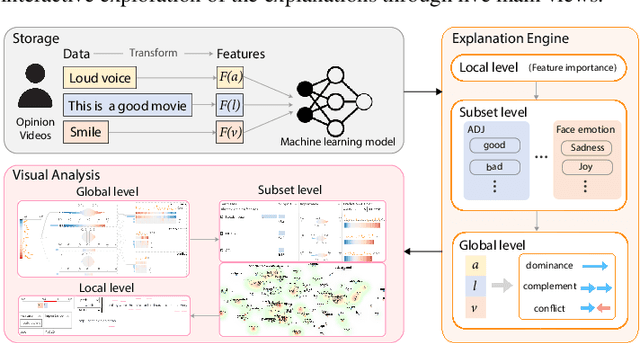
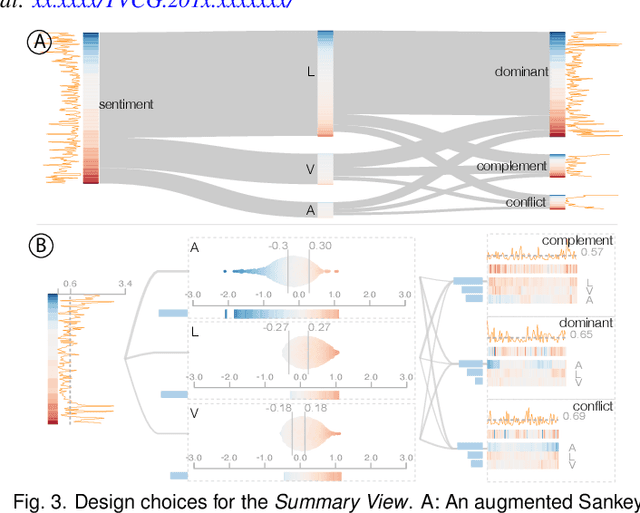
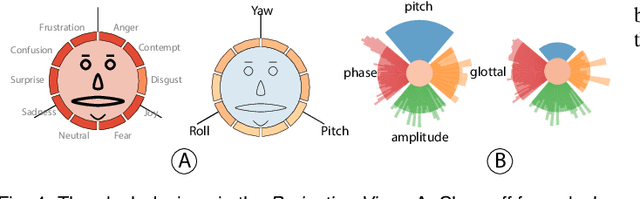
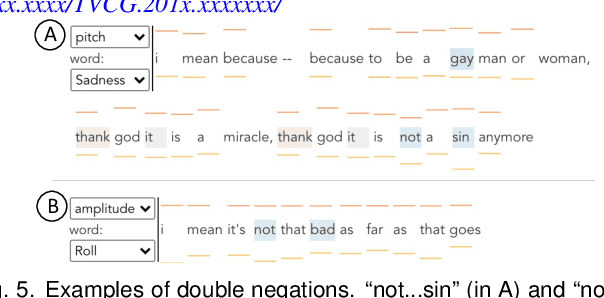
Multimodal sentiment analysis aims to recognize people's attitudes from multiple communication channels such as verbal content (i.e., text), voice, and facial expressions. It has become a vibrant and important research topic in natural language processing. Much research focuses on modeling the complex intra- and inter-modal interactions between different communication channels. However, current multimodal models with strong performance are often deep-learning-based techniques and work like black boxes. It is not clear how models utilize multimodal information for sentiment predictions. Despite recent advances in techniques for enhancing the explainability of machine learning models, they often target unimodal scenarios (e.g., images, sentences), and little research has been done on explaining multimodal models. In this paper, we present an interactive visual analytics system, M2Lens, to visualize and explain multimodal models for sentiment analysis. M2Lens provides explanations on intra- and inter-modal interactions at the global, subset, and local levels. Specifically, it summarizes the influence of three typical interaction types (i.e., dominance, complement, and conflict) on the model predictions. Moreover, M2Lens identifies frequent and influential multimodal features and supports the multi-faceted exploration of model behaviors from language, acoustic, and visual modalities. Through two case studies and expert interviews, we demonstrate our system can help users gain deep insights into the multimodal models for sentiment analysis.
BiGCN: A Bi-directional Low-Pass Filtering Graph Neural Network
Jan 14, 2021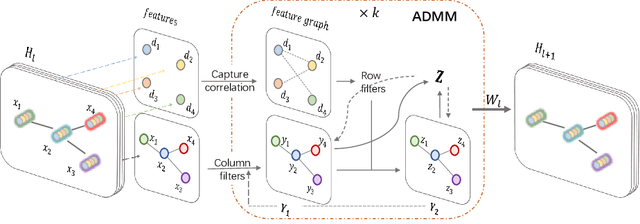
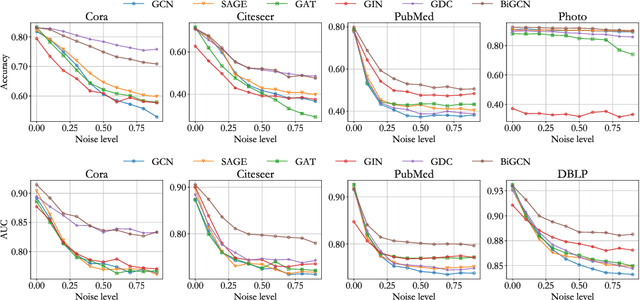
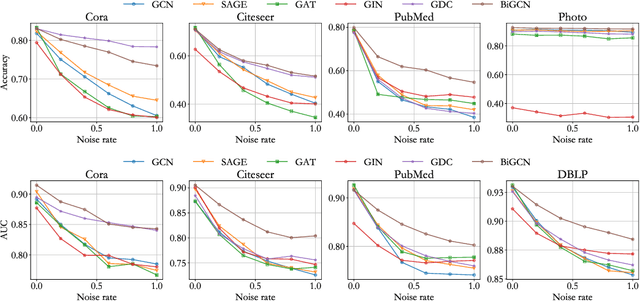
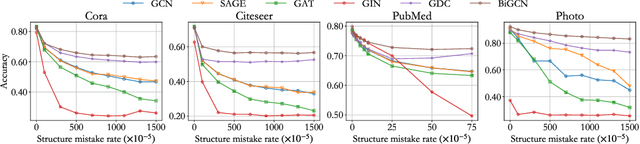
Graph convolutional networks have achieved great success on graph-structured data. Many graph convolutional networks can be regarded as low-pass filters for graph signals. In this paper, we propose a new model, BiGCN, which represents a graph neural network as a bi-directional low-pass filter. Specifically, we not only consider the original graph structure information but also the latent correlation between features, thus BiGCN can filter the signals along with both the original graph and a latent feature-connection graph. Our model outperforms previous graph neural networks in the tasks of node classification and link prediction on most of the benchmark datasets, especially when we add noise to the node features.
GNNVis: A Visual Analytics Approach for Prediction Error Diagnosis of Graph Neural Networks
Dec 03, 2020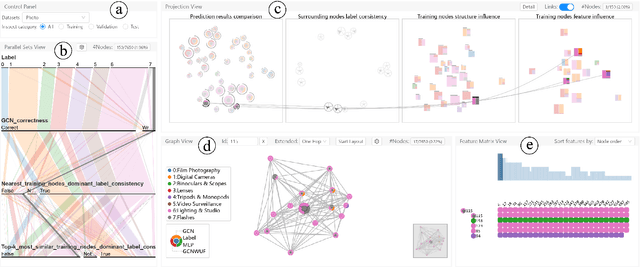
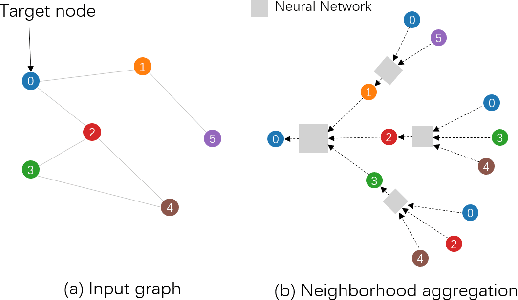
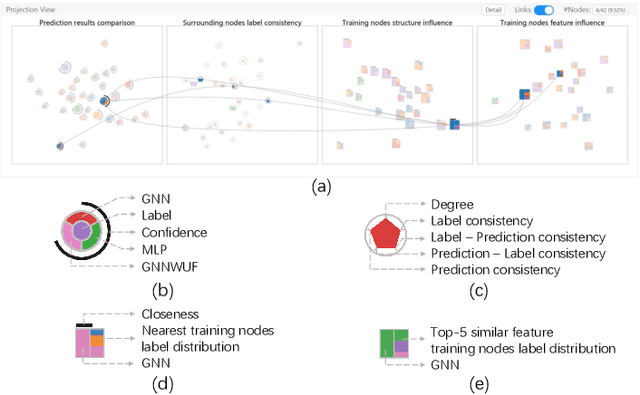
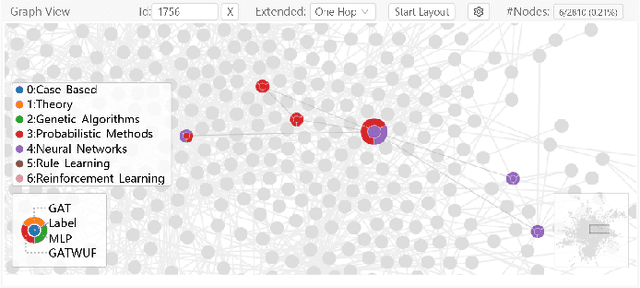
Graph Neural Networks (GNNs) aim to extend deep learning techniques to graph data and have achieved significant progress in graph analysis tasks (e.g., node classification) in recent years. However, similar to other deep neural networks like Convolutional Neural Networks (CNNs) and Recurrent Neural Networks (RNNs), GNNs behave like a black box with their details hidden from model developers and users. It is therefore difficult to diagnose possible errors of GNNs. Despite many visual analytics studies being done on CNNs and RNNs, little research has addressed the challenges for GNNs. This paper fills the research gap with an interactive visual analysis tool, GNNVis, to assist model developers and users in understanding and analyzing GNNs. Specifically, Parallel Sets View and Projection View enable users to quickly identify and validate error patterns in the set of wrong predictions; Graph View and Feature Matrix View offer a detailed analysis of individual nodes to assist users in forming hypotheses about the error patterns. Since GNNs jointly model the graph structure and the node features, we reveal the relative influences of the two types of information by comparing the predictions of three models: GNN, Multi-Layer Perceptron (MLP), and GNN Without Using Features (GNNWUF). Two case studies and interviews with domain experts demonstrate the effectiveness of GNNVis in facilitating the understanding of GNN models and their errors.
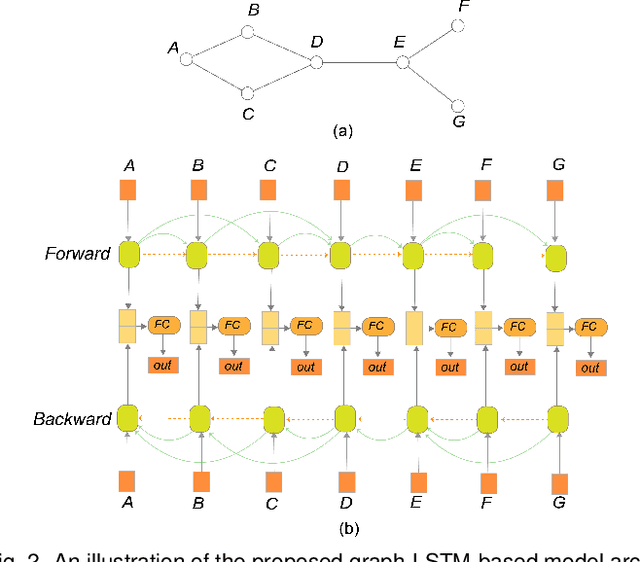
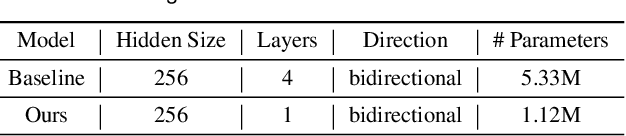
DeepDrawing: A Deep Learning Approach to Graph Drawing
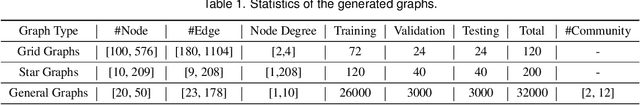
Jul 27, 2019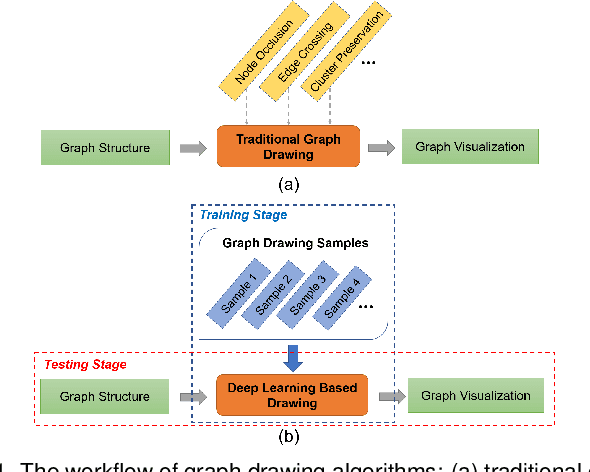
Node-link diagrams are widely used to facilitate network explorations. However, when using a graph drawing technique to visualize networks, users often need to tune different algorithm-specific parameters iteratively by comparing the corresponding drawing results in order to achieve a desired visual effect. This trial and error process is often tedious and time-consuming, especially for non-expert users. Inspired by the powerful data modelling and prediction capabilities of deep learning techniques, we explore the possibility of applying deep learning techniques to graph drawing. Specifically, we propose using a graph-LSTM-based approach to directly map network structures to graph drawings. Given a set of layout examples as the training dataset, we train the proposed graph-LSTM-based model to capture their layout characteristics. Then, the trained model is used to generate graph drawings in a similar style for new networks. We evaluated the proposed approach on two special types of layouts (i.e., grid layouts and star layouts) and two general types of layouts (i.e., ForceAtlas2 and PivotMDS) in both qualitative and quantitative ways. The results provide support for the effectiveness of our approach. We also conducted a time cost assessment on the drawings of small graphs with 20 to 50 nodes. We further report the lessons we learned and discuss the limitations and future work.