 Add to Chrome
 Add to Firefox
 Add to Edge
OCTolyzer: Fully automatic analysis toolkit for segmentation and feature extracting in optical coherence tomography (OCT) and scanning laser ophthalmoscopy (SLO) data
Jul 19, 2024Purpose: To describe OCTolyzer: an open-source toolkit for retinochoroidal analysis in optical coherence tomography (OCT) and scanning laser ophthalmoscopy (SLO) images. Method: OCTolyzer has two analysis suites, for SLO and OCT images. The former enables anatomical segmentation and feature measurement of the en face retinal vessels. The latter leverages image metadata for retinal layer segmentations and deep learning-based choroid layer segmentation to compute retinochoroidal measurements such as thickness and volume. We introduce OCTolyzer and assess the reproducibility of its OCT analysis suite for choroid analysis. Results: At the population-level, choroid region metrics were highly reproducible (Mean absolute error/Pearson/Spearman correlation for macular volume choroid thickness (CT):6.7$\mu$m/0.9933/0.9969, macular B-scan CT:11.6$\mu$m/0.9858/0.9889, peripapillary CT:5.0$\mu$m/0.9942/0.9940). Macular choroid vascular index (CVI) had good reproducibility (volume CVI:0.0271/0.9669/0.9655, B-scan CVI:0.0130/0.9090/0.9145). At the eye-level, measurement error in regional and vessel metrics were below 5% and 20% of the population's variability, respectively. Major outliers were from poor quality B-scans with thick choroids and invisible choroid-sclera boundary. Conclusions: OCTolyzer is the first open-source pipeline to convert OCT/SLO data into reproducible and clinically meaningful retinochoroidal measurements. OCT processing on a standard laptop CPU takes under 2 seconds for macular or peripapillary B-scans and 85 seconds for volume scans. OCTolyzer can help improve standardisation in the field of OCT/SLO image analysis and is freely available here: https://github.com/jaburke166/OCTolyzer.
SLOctolyzer: Fully automatic analysis toolkit for segmentation and feature extracting in scanning laser ophthalmoscopy images
Jun 24, 2024


Purpose: To describe SLOctolyzer: an open-source analysis toolkit for en face retinal vessels appearing in infrared reflectance scanning laser ophthalmoscopy (SLO) images. Methods: SLOctolyzer includes two main modules: segmentation and measurement. The segmentation module use deep learning methods to delineate retinal anatomy, while the measurement module quantifies key retinal vascular features such as vessel complexity, density, tortuosity, and calibre. We evaluate the segmentation module using unseen data and measure its reproducibility. Results: SLOctolyzer's segmentation module performed well against unseen internal test data (Dice for all-vessels, 0.9097; arteries, 0.8376; veins, 0.8525; optic disc, 0.9430; fovea, 0.8837). External validation against severe retinal pathology showed decreased performance (Dice for arteries, 0.7180; veins, 0.7470; optic disc, 0.9032). SLOctolyzer had good reproducibility (mean difference for fractal dimension, -0.0007; vessel density, -0.0003; vessel calibre, -0.3154 $\mu$m; tortuosity density, 0.0013). SLOctolyzer can process a macula-centred SLO image in under 20 seconds and a disc-centred SLO image in under 30 seconds using a standard laptop CPU. Conclusions: To our knowledge, SLOctolyzer is the first open-source tool to convert raw SLO images into reproducible and clinically meaningful retinal vascular parameters. SLO images are captured simultaneous to optical coherence tomography (OCT), and we believe our software will be useful for extracting retinal vascular measurements from large OCT image sets and linking them to ocular or systemic diseases. It requires no specialist knowledge or proprietary software, and allows manual correction of segmentations and re-computing of vascular metrics. SLOctolyzer is freely available at https://github.com/jaburke166/SLOctolyzer.
Domain-specific augmentations with resolution agnostic self-attention mechanism improves choroid segmentation in optical coherence tomography images
May 23, 2024


The choroid is a key vascular layer of the eye, supplying oxygen to the retinal photoreceptors. Non-invasive enhanced depth imaging optical coherence tomography (EDI-OCT) has recently improved access and visualisation of the choroid, making it an exciting frontier for discovering novel vascular biomarkers in ophthalmology and wider systemic health. However, current methods to measure the choroid often require use of multiple, independent semi-automatic and deep learning-based algorithms which are not made open-source. Previously, Choroidalyzer -- an open-source, fully automatic deep learning method trained on 5,600 OCT B-scans from 385 eyes -- was developed to fully segment and quantify the choroid in EDI-OCT images, thus addressing these issues. Using the same dataset, we propose a Robust, Resolution-agnostic and Efficient Attention-based network for CHoroid segmentation (REACH). REACHNet leverages multi-resolution training with domain-specific data augmentation to promote generalisation, and uses a lightweight architecture with resolution-agnostic self-attention which is not only faster than Choroidalyzer's previous network (4 images/s vs. 2.75 images/s on a standard laptop CPU), but has greater performance for segmenting the choroid region, vessels and fovea (Dice coefficient for region 0.9769 vs. 0.9749, vessels 0.8612 vs. 0.8192 and fovea 0.8243 vs. 0.3783) due to its improved hyperparameter configuration and model training pipeline. REACHNet can be used with Choroidalyzer as a drop-in replacement for the original model and will be made available upon publication.
Choroidalyzer: An open-source, end-to-end pipeline for choroidal analysis in optical coherence tomography
Dec 05, 2023


Purpose: To develop Choroidalyzer, an open-source, end-to-end pipeline for segmenting the choroid region, vessels, and fovea, and deriving choroidal thickness, area, and vascular index. Methods: We used 5,600 OCT B-scans (233 subjects, 6 systemic disease cohorts, 3 device types, 2 manufacturers). To generate region and vessel ground-truths, we used state-of-the-art automatic methods following manual correction of inaccurate segmentations, with foveal positions manually annotated. We trained a U-Net deep-learning model to detect the region, vessels, and fovea to calculate choroid thickness, area, and vascular index in a fovea-centred region of interest. We analysed segmentation agreement (AUC, Dice) and choroid metrics agreement (Pearson, Spearman, mean absolute error (MAE)) in internal and external test sets. We compared Choroidalyzer to two manual graders on a small subset of external test images and examined cases of high error. Results: Choroidalyzer took 0.299 seconds per image on a standard laptop and achieved excellent region (Dice: internal 0.9789, external 0.9749), very good vessel segmentation performance (Dice: internal 0.8817, external 0.8703) and excellent fovea location prediction (MAE: internal 3.9 pixels, external 3.4 pixels). For thickness, area, and vascular index, Pearson correlations were 0.9754, 0.9815, and 0.8285 (internal) / 0.9831, 0.9779, 0.7948 (external), respectively (all p<0.0001). Choroidalyzer's agreement with graders was comparable to the inter-grader agreement across all metrics. Conclusions: Choroidalyzer is an open-source, end-to-end pipeline that accurately segments the choroid and reliably extracts thickness, area, and vascular index. Especially choroidal vessel segmentation is a difficult and subjective task, and fully-automatic methods like Choroidalyzer could provide objectivity and standardisation.
A publicly available vessel segmentation algorithm for SLO images
Nov 29, 2023


Background and Objective: Infra-red scanning laser ophthalmoscope (IRSLO) images are akin to colour fundus photographs in displaying the posterior pole and retinal vasculature fine detail. While there are many trained networks readily available for retinal vessel segmentation in colour fundus photographs, none cater to IRSLO images. Accordingly, we aimed to develop (and release as open source) a vessel segmentation algorithm tailored specifically to IRSLO images. Materials and Methods: We used 23 expertly annotated IRSLO images from the RAVIR dataset, combined with 7 additional images annotated in-house. We trained a U-Net (convolutional neural network) to label pixels as 'vessel' or 'background'. Results: On an unseen test set (4 images), our model achieved an AUC of 0.981, and an AUPRC of 0.815. Upon thresholding, it achieved a sensitivity of 0.844, a specificity of 0.983, and an F1 score of 0.857. Conclusion: We have made our automatic segmentation algorithm publicly available and easy to use. Researchers can use the generated vessel maps to compute metrics such as fractal dimension and vessel density.
Efficient and fully-automatic retinal choroid segmentation in OCT through DL-based distillation of a hand-crafted pipeline
Jul 03, 2023


Retinal vascular phenotypes, derived from low-cost, non-invasive retinal imaging, have been linked to systemic conditions such as cardio-, neuro- and reno-vascular disease. Recent high-resolution optical coherence tomography (OCT) allows imaging of the choroidal microvasculature which could provide more information about vascular health that complements the superficial retinal vessels, which current vascular phenotypes are based on. Segmentation of the choroid in OCT is a key step in quantifying choroidal parameters like thickness and area. Gaussian Process Edge Tracing (GPET) is a promising, clinically validated method for this. However, GPET is semi-automatic and thus requires time-consuming manual interventions by specifically trained personnel which introduces subjectivity and limits the potential for analysing larger datasets or deploying GPET into clinical practice. We introduce DeepGPET, which distils GPET into a neural network to yield a fully-automatic and efficient choroidal segmentation method. DeepGPET achieves excellent agreement with GPET on data from 3 clinical studies (AUC=0.9994, Dice=0.9664; Pearson correlation of 0.8908 for choroidal thickness and 0.9082 for choroidal area), while reducing the mean processing time per image from 34.49s ($\pm$15.09) to 1.25s ($\pm$0.10) on a standard laptop CPU and removing all manual interventions. DeepGPET will be made available for researchers upon publication.
Evaluation of an automated choroid segmentation algorithm in a longitudinal kidney donor and recipient cohort
Jun 19, 2023This study evaluated the performance of an automated choroid segmentation algorithm in enhanced depth imaging optical coherence tomography (EDI-OCT) images from a longitudinal kidney donor and recipient cohort. We assessed 22 donors and 23 patients with end-stage kidney disease during the course of donating and receiving a kidney transplant, respectively, over a period of 1 year. We assessed choroid thickness and area on EDI-OCT scans and compared our automated measurements to manual ones at the same locations. We estimated associations between measurements of the choroid and markers of renal function (serum urea and creatinine, estimated glomerular filtration rate (eGFR)) using correlation and linear mixed-effects models. There was good agreement between manual and automated measures. Automated measures were more precise because of smaller measurement error, especially with repeated measures over time. Associations with renal function were stronger with automated measures (creatinine P=0.01, eGFR P=0.02) compared to manual ones (creatinine P=0.12, eGFR P=0.06). Significant linear associations were observed between the choroid and urea, creatinine, and eGFR in recipients, and urea in donors. Our automated approach has greater precision than manual measurements. Greater longitudinal reproducibility of automated measurements may explain stronger associations with renal function compared to manual measurements. To improve detection of meaningful associations with clinical endpoints in longitudinal studies of OCT, reducing measurement error should be a priority, and automated measurements help achieve this.
Automated and Network Structure Preserving Segmentation of Optical Coherence Tomography Angiograms
Dec 20, 2019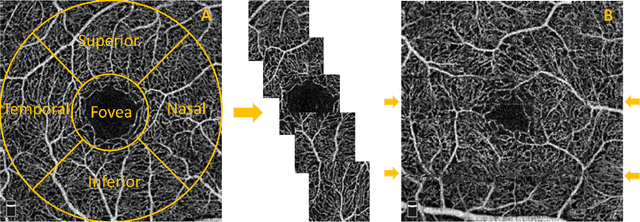
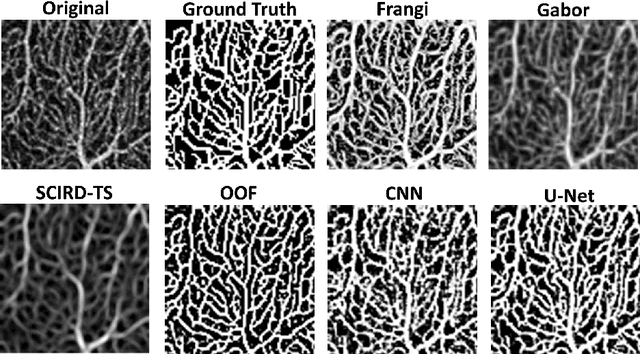
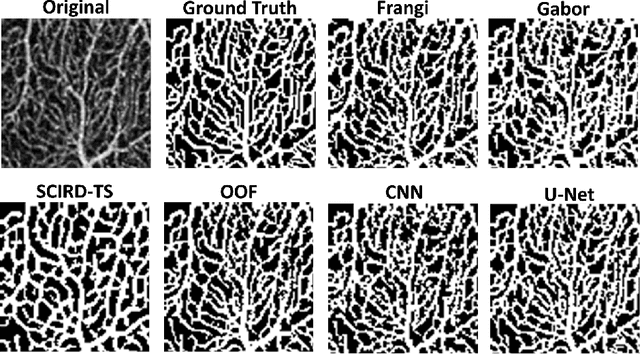
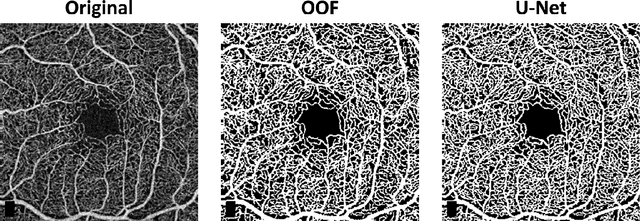
Optical coherence tomography angiography (OCTA) is a novel non-invasive imaging modality for the visualisation of microvasculature in vivo. OCTA has encountered broad adoption in retinal research. OCTA potential in the assessment of pathological conditions and the reproducibility of studies relies on the quality of the image analysis. However, automated segmentation of parafoveal OCTA images is still an open problem in the field. In this study, we generate the first open dataset of retinal parafoveal OCTA images with associated ground truth manual segmentations. Furthermore, we establish a standard for OCTA image segmentation by surveying a broad range of state-of-the-art vessel enhancement and binarisation procedures. We provide the most comprehensive comparison of these methods under a unified framework to date. Our results show that, for the set of images considered, the U-Net machine learning (ML) architecture achieves the best performance with a Dice similarity coefficient of 0.89. For applications where manually segmented data is not available to retrain this ML approach, our findings suggest that optimal oriented flux is the best handcrafted filter enhancement method for OCTA images from those considered. Furthermore, we report on the importance of preserving network connectivity in the segmentation to enable vascular network phenotyping. We introduce a new metric for network connectivity evaluations in segmented angiograms and report an accuracy of up to 0.94 in preserving the morphological structure of the network in our segmentations. Finally, we release our data and source code to support standardisation efforts in OCTA image segmentation.
Evaluation of Algorithms for Multi-Modality Whole Heart Segmentation: An Open-Access Grand Challenge
Feb 21, 2019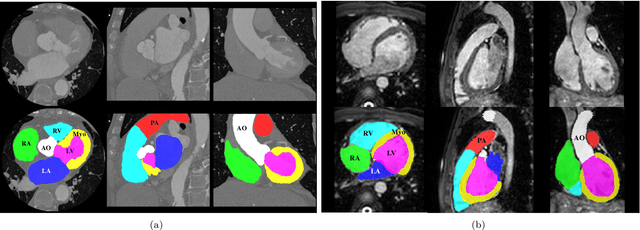
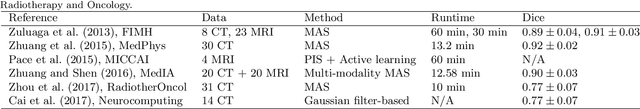
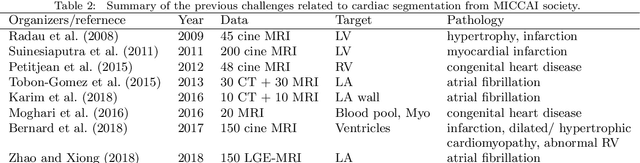
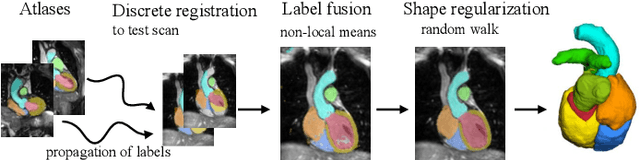
Knowledge of whole heart anatomy is a prerequisite for many clinical applications. Whole heart segmentation (WHS), which delineates substructures of the heart, can be very valuable for modeling and analysis of the anatomy and functions of the heart. However, automating this segmentation can be arduous due to the large variation of the heart shape, and different image qualities of the clinical data. To achieve this goal, a set of training data is generally needed for constructing priors or for training. In addition, it is difficult to perform comparisons between different methods, largely due to differences in the datasets and evaluation metrics used. This manuscript presents the methodologies and evaluation results for the WHS algorithms selected from the submissions to the Multi-Modality Whole Heart Segmentation (MM-WHS) challenge, in conjunction with MICCAI 2017. The challenge provides 120 three-dimensional cardiac images covering the whole heart, including 60 CT and 60 MRI volumes, all acquired in clinical environments with manual delineation. Ten algorithms for CT data and eleven algorithms for MRI data, submitted from twelve groups, have been evaluated. The results show that many of the deep learning (DL) based methods achieved high accuracy, even though the number of training datasets was limited. A number of them also reported poor results in the blinded evaluation, probably due to overfitting in their training. The conventional algorithms, mainly based on multi-atlas segmentation, demonstrated robust and stable performance, even though the accuracy is not as good as the best DL method in CT segmentation. The challenge, including the provision of the annotated training data and the blinded evaluation for submitted algorithms on the test data, continues as an ongoing benchmarking resource via its homepage (\url{www.sdspeople.fudan.edu.cn/zhuangxiahai/0/mmwhs/}).
Unsupervised learning for cross-domain medical image synthesis using deformation invariant cycle consistency networks
Aug 12, 2018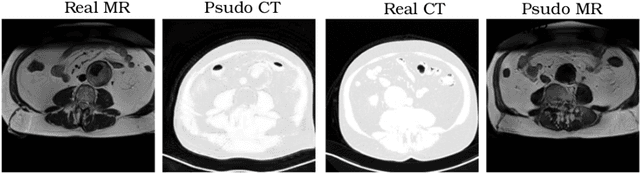
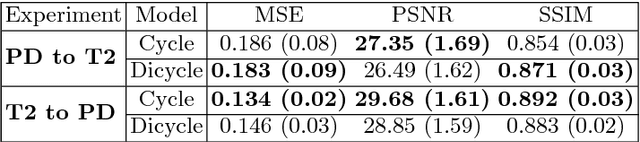
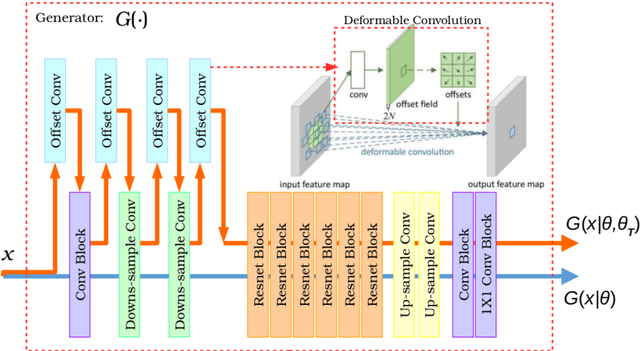
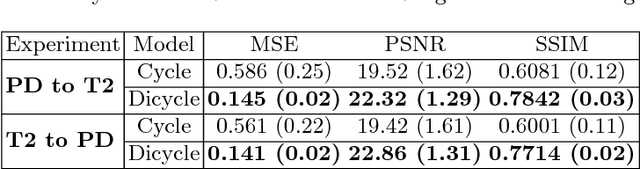
Recently, the cycle-consistent generative adversarial networks (CycleGAN) has been widely used for synthesis of multi-domain medical images. The domain-specific nonlinear deformations captured by CycleGAN make the synthesized images difficult to be used for some applications, for example, generating pseudo-CT for PET-MR attenuation correction. This paper presents a deformation-invariant CycleGAN (DicycleGAN) method using deformable convolutional layers and new cycle-consistency losses. Its robustness dealing with data that suffer from domain-specific nonlinear deformations has been evaluated through comparison experiments performed on a multi-sequence brain MR dataset and a multi-modality abdominal dataset. Our method has displayed its ability to generate synthesized data that is aligned with the source while maintaining a proper quality of signal compared to CycleGAN-generated data. The proposed model also obtained comparable performance with CycleGAN when data from the source and target domains are alignable through simple affine transformations.