 Add to Chrome
 Add to Firefox
 Add to Edge
Generalist versus Specialist Vision Foundation Models for Ocular Disease and Oculomics
Sep 03, 2025Medical foundation models, pre-trained with large-scale clinical data, demonstrate strong performance in diverse clinically relevant applications. RETFound, trained on nearly one million retinal images, exemplifies this approach in applications with retinal images. However, the emergence of increasingly powerful and multifold larger generalist foundation models such as DINOv2 and DINOv3 raises the question of whether domain-specific pre-training remains essential, and if so, what gap persists. To investigate this, we systematically evaluated the adaptability of DINOv2 and DINOv3 in retinal image applications, compared to two specialist RETFound models, RETFound-MAE and RETFound-DINOv2. We assessed performance on ocular disease detection and systemic disease prediction using two adaptation strategies: fine-tuning and linear probing. Data efficiency and adaptation efficiency were further analysed to characterise trade-offs between predictive performance and computational cost. Our results show that although scaling generalist models yields strong adaptability across diverse tasks, RETFound-DINOv2 consistently outperforms these generalist foundation models in ocular-disease detection and oculomics tasks, demonstrating stronger generalisability and data efficiency. These findings suggest that specialist retinal foundation models remain the most effective choice for clinical applications, while the narrowing gap with generalist foundation models suggests that continued data and model scaling can deliver domain-relevant gains and position them as strong foundations for future medical foundation models.
OCTolyzer: Fully automatic analysis toolkit for segmentation and feature extracting in optical coherence tomography (OCT) and scanning laser ophthalmoscopy (SLO) data
Jul 19, 2024Purpose: To describe OCTolyzer: an open-source toolkit for retinochoroidal analysis in optical coherence tomography (OCT) and scanning laser ophthalmoscopy (SLO) images. Method: OCTolyzer has two analysis suites, for SLO and OCT images. The former enables anatomical segmentation and feature measurement of the en face retinal vessels. The latter leverages image metadata for retinal layer segmentations and deep learning-based choroid layer segmentation to compute retinochoroidal measurements such as thickness and volume. We introduce OCTolyzer and assess the reproducibility of its OCT analysis suite for choroid analysis. Results: At the population-level, choroid region metrics were highly reproducible (Mean absolute error/Pearson/Spearman correlation for macular volume choroid thickness (CT):6.7$\mu$m/0.9933/0.9969, macular B-scan CT:11.6$\mu$m/0.9858/0.9889, peripapillary CT:5.0$\mu$m/0.9942/0.9940). Macular choroid vascular index (CVI) had good reproducibility (volume CVI:0.0271/0.9669/0.9655, B-scan CVI:0.0130/0.9090/0.9145). At the eye-level, measurement error in regional and vessel metrics were below 5% and 20% of the population's variability, respectively. Major outliers were from poor quality B-scans with thick choroids and invisible choroid-sclera boundary. Conclusions: OCTolyzer is the first open-source pipeline to convert OCT/SLO data into reproducible and clinically meaningful retinochoroidal measurements. OCT processing on a standard laptop CPU takes under 2 seconds for macular or peripapillary B-scans and 85 seconds for volume scans. OCTolyzer can help improve standardisation in the field of OCT/SLO image analysis and is freely available here: https://github.com/jaburke166/OCTolyzer.
SLOctolyzer: Fully automatic analysis toolkit for segmentation and feature extracting in scanning laser ophthalmoscopy images
Jun 24, 2024


Purpose: To describe SLOctolyzer: an open-source analysis toolkit for en face retinal vessels appearing in infrared reflectance scanning laser ophthalmoscopy (SLO) images. Methods: SLOctolyzer includes two main modules: segmentation and measurement. The segmentation module use deep learning methods to delineate retinal anatomy, while the measurement module quantifies key retinal vascular features such as vessel complexity, density, tortuosity, and calibre. We evaluate the segmentation module using unseen data and measure its reproducibility. Results: SLOctolyzer's segmentation module performed well against unseen internal test data (Dice for all-vessels, 0.9097; arteries, 0.8376; veins, 0.8525; optic disc, 0.9430; fovea, 0.8837). External validation against severe retinal pathology showed decreased performance (Dice for arteries, 0.7180; veins, 0.7470; optic disc, 0.9032). SLOctolyzer had good reproducibility (mean difference for fractal dimension, -0.0007; vessel density, -0.0003; vessel calibre, -0.3154 $\mu$m; tortuosity density, 0.0013). SLOctolyzer can process a macula-centred SLO image in under 20 seconds and a disc-centred SLO image in under 30 seconds using a standard laptop CPU. Conclusions: To our knowledge, SLOctolyzer is the first open-source tool to convert raw SLO images into reproducible and clinically meaningful retinal vascular parameters. SLO images are captured simultaneous to optical coherence tomography (OCT), and we believe our software will be useful for extracting retinal vascular measurements from large OCT image sets and linking them to ocular or systemic diseases. It requires no specialist knowledge or proprietary software, and allows manual correction of segmentations and re-computing of vascular metrics. SLOctolyzer is freely available at https://github.com/jaburke166/SLOctolyzer.
Domain-specific augmentations with resolution agnostic self-attention mechanism improves choroid segmentation in optical coherence tomography images
May 23, 2024


The choroid is a key vascular layer of the eye, supplying oxygen to the retinal photoreceptors. Non-invasive enhanced depth imaging optical coherence tomography (EDI-OCT) has recently improved access and visualisation of the choroid, making it an exciting frontier for discovering novel vascular biomarkers in ophthalmology and wider systemic health. However, current methods to measure the choroid often require use of multiple, independent semi-automatic and deep learning-based algorithms which are not made open-source. Previously, Choroidalyzer -- an open-source, fully automatic deep learning method trained on 5,600 OCT B-scans from 385 eyes -- was developed to fully segment and quantify the choroid in EDI-OCT images, thus addressing these issues. Using the same dataset, we propose a Robust, Resolution-agnostic and Efficient Attention-based network for CHoroid segmentation (REACH). REACHNet leverages multi-resolution training with domain-specific data augmentation to promote generalisation, and uses a lightweight architecture with resolution-agnostic self-attention which is not only faster than Choroidalyzer's previous network (4 images/s vs. 2.75 images/s on a standard laptop CPU), but has greater performance for segmenting the choroid region, vessels and fovea (Dice coefficient for region 0.9769 vs. 0.9749, vessels 0.8612 vs. 0.8192 and fovea 0.8243 vs. 0.3783) due to its improved hyperparameter configuration and model training pipeline. REACHNet can be used with Choroidalyzer as a drop-in replacement for the original model and will be made available upon publication.
Training a high-performance retinal foundation model with half-the-data and 400 times less compute
Apr 30, 2024Artificial Intelligence holds tremendous potential in medicine, but is traditionally limited by the lack of massive datasets to train models on. Foundation models, pre-trained models that can be adapted to downstream tasks with small datasets, could alleviate this problem. Researchers at Moorfields Eye Hospital (MEH) proposed RETFound-MEH, a foundation model for retinal imaging that was trained on 900,000 images, including private hospital data. Recently, data-efficient DERETFound was proposed that provides comparable performance while being trained on only 150,000 images that are all publicly available. However, both these models required very substantial resources to train initially and are resource-intensive in downstream use. We propose a novel Token Reconstruction objective that we use to train RETFound-Green, a retinal foundation model trained using only 75,000 publicly available images and 400 times less compute. We estimate the cost of training RETFound-MEH and DERETFound at $10,000 and $14,000, respectively, while RETFound-Green could be trained for less than $100, with equally reduced environmental impact. RETFound-Green is also far more efficient in downstream use: it can be downloaded 14 times faster, computes vector embeddings 2.7 times faster which then require 2.6 times less storage space. Despite this, RETFound-Green does not perform systematically worse. In fact, it performs best on 14 tasks, compared to six for DERETFound and two for RETFound-MEH. Our results suggest that RETFound-Green is a very efficient, high-performance retinal foundation model. We anticipate that our Token Reconstruction objective could be scaled up for even higher performance and be applied to other domains beyond retinal imaging.
Applicability of oculomics for individual risk prediction: Repeatability and robustness of retinal Fractal Dimension using DART and AutoMorph
Mar 11, 2024


Purpose: To investigate whether Fractal Dimension (FD)-based oculomics could be used for individual risk prediction by evaluating repeatability and robustness. Methods: We used two datasets: Caledonia, healthy adults imaged multiple times in quick succession for research (26 subjects, 39 eyes, 377 colour fundus images), and GRAPE, glaucoma patients with baseline and follow-up visits (106 subjects, 196 eyes, 392 images). Mean follow-up time was 18.3 months in GRAPE, thus it provides a pessimistic lower-bound as vasculature could change. FD was computed with DART and AutoMorph. Image quality was assessed with QuickQual, but no images were initially excluded. Pearson, Spearman, and Intraclass Correlation (ICC) were used for population-level repeatability. For individual-level repeatability, we introduce measurement noise parameter {\lambda} which is within-eye Standard Deviation (SD) of FD measurements in units of between-eyes SD. Results: In Caledonia, ICC was 0.8153 for DART and 0.5779 for AutoMorph, Pearson/Spearman correlation (first and last image) 0.7857/0.7824 for DART, and 0.3933/0.6253 for AutoMorph. In GRAPE, Pearson/Spearman correlation (first and next visit) was 0.7479/0.7474 for DART, and 0.7109/0.7208 for AutoMorph (all p<0.0001). Median {\lambda} in Caledonia without exclusions was 3.55\% for DART and 12.65\% for AutoMorph, and improved to up to 1.67\% and 6.64\% with quality-based exclusions, respectively. Quality exclusions primarily mitigated large outliers. Worst quality in an eye correlated strongly with {\lambda} (Pearson 0.5350-0.7550, depending on dataset and method, all p<0.0001). Conclusions: Repeatability was sufficient for individual-level predictions in heterogeneous populations. DART performed better on all metrics and might be able to detect small, longitudinal changes, highlighting the potential of robust methods.
Choroidalyzer: An open-source, end-to-end pipeline for choroidal analysis in optical coherence tomography
Dec 05, 2023


Purpose: To develop Choroidalyzer, an open-source, end-to-end pipeline for segmenting the choroid region, vessels, and fovea, and deriving choroidal thickness, area, and vascular index. Methods: We used 5,600 OCT B-scans (233 subjects, 6 systemic disease cohorts, 3 device types, 2 manufacturers). To generate region and vessel ground-truths, we used state-of-the-art automatic methods following manual correction of inaccurate segmentations, with foveal positions manually annotated. We trained a U-Net deep-learning model to detect the region, vessels, and fovea to calculate choroid thickness, area, and vascular index in a fovea-centred region of interest. We analysed segmentation agreement (AUC, Dice) and choroid metrics agreement (Pearson, Spearman, mean absolute error (MAE)) in internal and external test sets. We compared Choroidalyzer to two manual graders on a small subset of external test images and examined cases of high error. Results: Choroidalyzer took 0.299 seconds per image on a standard laptop and achieved excellent region (Dice: internal 0.9789, external 0.9749), very good vessel segmentation performance (Dice: internal 0.8817, external 0.8703) and excellent fovea location prediction (MAE: internal 3.9 pixels, external 3.4 pixels). For thickness, area, and vascular index, Pearson correlations were 0.9754, 0.9815, and 0.8285 (internal) / 0.9831, 0.9779, 0.7948 (external), respectively (all p<0.0001). Choroidalyzer's agreement with graders was comparable to the inter-grader agreement across all metrics. Conclusions: Choroidalyzer is an open-source, end-to-end pipeline that accurately segments the choroid and reliably extracts thickness, area, and vascular index. Especially choroidal vessel segmentation is a difficult and subjective task, and fully-automatic methods like Choroidalyzer could provide objectivity and standardisation.
QuickQual: Lightweight, convenient retinal image quality scoring with off-the-shelf pretrained models
Jul 25, 2023Image quality remains a key problem for both traditional and deep learning (DL)-based approaches to retinal image analysis, but identifying poor quality images can be time consuming and subjective. Thus, automated methods for retinal image quality scoring (RIQS) are needed. The current state-of-the-art is MCFNet, composed of three Densenet121 backbones each operating in a different colour space. MCFNet, and the EyeQ dataset released by the same authors, was a huge step forward for RIQS. We present QuickQual, a simple approach to RIQS, consisting of a single off-the-shelf ImageNet-pretrained Densenet121 backbone plus a Support Vector Machine (SVM). QuickQual performs very well, setting a new state-of-the-art for EyeQ (Accuracy: 88.50% vs 88.00% for MCFNet; AUC: 0.9687 vs 0.9588). This suggests that RIQS can be solved with generic perceptual features learned on natural images, as opposed to requiring DL models trained on large amounts of fundus images. Additionally, we propose a Fixed Prior linearisation scheme, that converts EyeQ from a 3-way classification to a continuous logistic regression task. For this task, we present a second model, QuickQual MEga Minified Estimator (QuickQual-MEME), that consists of only 10 parameters on top of an off-the-shelf Densenet121 and can distinguish between gradable and ungradable images with an accuracy of 89.18% (AUC: 0.9537). Code and model are available on GitHub: https://github.com/justinengelmann/QuickQual . QuickQual is so lightweight, that the entire inference code (and even the parameters for QuickQual-MEME) is already contained in this paper.
Efficient and fully-automatic retinal choroid segmentation in OCT through DL-based distillation of a hand-crafted pipeline
Jul 03, 2023


Retinal vascular phenotypes, derived from low-cost, non-invasive retinal imaging, have been linked to systemic conditions such as cardio-, neuro- and reno-vascular disease. Recent high-resolution optical coherence tomography (OCT) allows imaging of the choroidal microvasculature which could provide more information about vascular health that complements the superficial retinal vessels, which current vascular phenotypes are based on. Segmentation of the choroid in OCT is a key step in quantifying choroidal parameters like thickness and area. Gaussian Process Edge Tracing (GPET) is a promising, clinically validated method for this. However, GPET is semi-automatic and thus requires time-consuming manual interventions by specifically trained personnel which introduces subjectivity and limits the potential for analysing larger datasets or deploying GPET into clinical practice. We introduce DeepGPET, which distils GPET into a neural network to yield a fully-automatic and efficient choroidal segmentation method. DeepGPET achieves excellent agreement with GPET on data from 3 clinical studies (AUC=0.9994, Dice=0.9664; Pearson correlation of 0.8908 for choroidal thickness and 0.9082 for choroidal area), while reducing the mean processing time per image from 34.49s ($\pm$15.09) to 1.25s ($\pm$0.10) on a standard laptop CPU and removing all manual interventions. DeepGPET will be made available for researchers upon publication.
Robust and efficient computation of retinal fractal dimension through deep approximation
Jul 12, 2022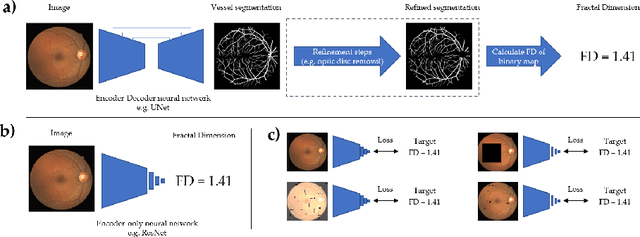
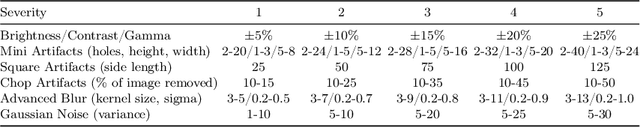
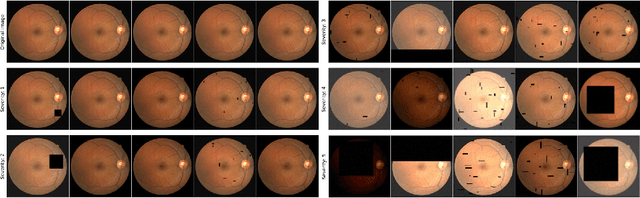
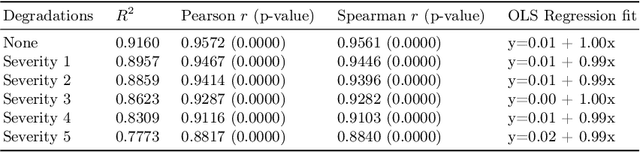
A retinal trait, or phenotype, summarises a specific aspect of a retinal image in a single number. This can then be used for further analyses, e.g. with statistical methods. However, reducing an aspect of a complex image to a single, meaningful number is challenging. Thus, methods for calculating retinal traits tend to be complex, multi-step pipelines that can only be applied to high quality images. This means that researchers often have to discard substantial portions of the available data. We hypothesise that such pipelines can be approximated with a single, simpler step that can be made robust to common quality issues. We propose Deep Approximation of Retinal Traits (DART) where a deep neural network is used predict the output of an existing pipeline on high quality images from synthetically degraded versions of these images. We demonstrate DART on retinal Fractal Dimension (FD) calculated by VAMPIRE, using retinal images from UK Biobank that previous work identified as high quality. Our method shows very high agreement with FD VAMPIRE on unseen test images (Pearson r=0.9572). Even when those images are severely degraded, DART can still recover an FD estimate that shows good agreement with FD VAMPIRE obtained from the original images (Pearson r=0.8817). This suggests that our method could enable researchers to discard fewer images in the future. Our method can compute FD for over 1,000img/s using a single GPU. We consider these to be very encouraging initial results and hope to develop this approach into a useful tool for retinal analysis.