 Add to Chrome
 Add to Firefox
 Add to Edge
Choroidal image analysis for OCT image sequences with applications in systemic health
Feb 10, 2025The choroid, a highly vascular layer behind the retina, is an extension of the central nervous system and has parallels with the renal cortex, with blood flow far exceeding that of the brain and kidney. Thus, there has been growing interest of choroidal blood flow reflecting physiological status of systemic disease. Optical coherence tomography (OCT) enables high-resolution imaging of the choroid, but conventional analysis methods remain manual or semi-automatic, limiting reproducibility, standardisation and clinical utility. In this thesis, I develop several new methods to analyse the choroid in OCT image sequences, with each successive method improving on its predecessors. I first develop two semi-automatic approaches for choroid region (Gaussian Process Edge Tracing, GPET) and vessel (Multi-scale Median Cut Quantisation, MMCQ) analysis, which improve on manual approaches but remain user-dependent. To address this, I introduce DeepGPET, a deep learning-based region segmentation method which improves on execution time, reproducibility, and end-user accessibility, but lacks choroid vessel analysis and automatic feature measurement. Improving on this, I developed Choroidalyzer, a deep learning-based pipeline to segment the choroidal space and vessels and generate fully automatic, clinically meaningful and reproducible choroidal features. I provide rigorous evaluation of these four approaches and consider their potential clinical value in three applications into systemic health: OCTANE, assessing choroidal changes in renal transplant recipients and donors; PREVENT, exploring choroidal associations with Alzheimer's risk factors at mid-life; D-RISCii, assessing choroidal variation and feasibility of OCT in critical care. In short, this thesis contributes many open-source tools for standardised choroidal measurement and highlights the choroid's potential as a biomarker in systemic health.
OCTolyzer: Fully automatic analysis toolkit for segmentation and feature extracting in optical coherence tomography (OCT) and scanning laser ophthalmoscopy (SLO) data
Jul 19, 2024Purpose: To describe OCTolyzer: an open-source toolkit for retinochoroidal analysis in optical coherence tomography (OCT) and scanning laser ophthalmoscopy (SLO) images. Method: OCTolyzer has two analysis suites, for SLO and OCT images. The former enables anatomical segmentation and feature measurement of the en face retinal vessels. The latter leverages image metadata for retinal layer segmentations and deep learning-based choroid layer segmentation to compute retinochoroidal measurements such as thickness and volume. We introduce OCTolyzer and assess the reproducibility of its OCT analysis suite for choroid analysis. Results: At the population-level, choroid region metrics were highly reproducible (Mean absolute error/Pearson/Spearman correlation for macular volume choroid thickness (CT):6.7$\mu$m/0.9933/0.9969, macular B-scan CT:11.6$\mu$m/0.9858/0.9889, peripapillary CT:5.0$\mu$m/0.9942/0.9940). Macular choroid vascular index (CVI) had good reproducibility (volume CVI:0.0271/0.9669/0.9655, B-scan CVI:0.0130/0.9090/0.9145). At the eye-level, measurement error in regional and vessel metrics were below 5% and 20% of the population's variability, respectively. Major outliers were from poor quality B-scans with thick choroids and invisible choroid-sclera boundary. Conclusions: OCTolyzer is the first open-source pipeline to convert OCT/SLO data into reproducible and clinically meaningful retinochoroidal measurements. OCT processing on a standard laptop CPU takes under 2 seconds for macular or peripapillary B-scans and 85 seconds for volume scans. OCTolyzer can help improve standardisation in the field of OCT/SLO image analysis and is freely available here: https://github.com/jaburke166/OCTolyzer.
SLOctolyzer: Fully automatic analysis toolkit for segmentation and feature extracting in scanning laser ophthalmoscopy images
Jun 24, 2024


Purpose: To describe SLOctolyzer: an open-source analysis toolkit for en face retinal vessels appearing in infrared reflectance scanning laser ophthalmoscopy (SLO) images. Methods: SLOctolyzer includes two main modules: segmentation and measurement. The segmentation module use deep learning methods to delineate retinal anatomy, while the measurement module quantifies key retinal vascular features such as vessel complexity, density, tortuosity, and calibre. We evaluate the segmentation module using unseen data and measure its reproducibility. Results: SLOctolyzer's segmentation module performed well against unseen internal test data (Dice for all-vessels, 0.9097; arteries, 0.8376; veins, 0.8525; optic disc, 0.9430; fovea, 0.8837). External validation against severe retinal pathology showed decreased performance (Dice for arteries, 0.7180; veins, 0.7470; optic disc, 0.9032). SLOctolyzer had good reproducibility (mean difference for fractal dimension, -0.0007; vessel density, -0.0003; vessel calibre, -0.3154 $\mu$m; tortuosity density, 0.0013). SLOctolyzer can process a macula-centred SLO image in under 20 seconds and a disc-centred SLO image in under 30 seconds using a standard laptop CPU. Conclusions: To our knowledge, SLOctolyzer is the first open-source tool to convert raw SLO images into reproducible and clinically meaningful retinal vascular parameters. SLO images are captured simultaneous to optical coherence tomography (OCT), and we believe our software will be useful for extracting retinal vascular measurements from large OCT image sets and linking them to ocular or systemic diseases. It requires no specialist knowledge or proprietary software, and allows manual correction of segmentations and re-computing of vascular metrics. SLOctolyzer is freely available at https://github.com/jaburke166/SLOctolyzer.
Domain-specific augmentations with resolution agnostic self-attention mechanism improves choroid segmentation in optical coherence tomography images
May 23, 2024


The choroid is a key vascular layer of the eye, supplying oxygen to the retinal photoreceptors. Non-invasive enhanced depth imaging optical coherence tomography (EDI-OCT) has recently improved access and visualisation of the choroid, making it an exciting frontier for discovering novel vascular biomarkers in ophthalmology and wider systemic health. However, current methods to measure the choroid often require use of multiple, independent semi-automatic and deep learning-based algorithms which are not made open-source. Previously, Choroidalyzer -- an open-source, fully automatic deep learning method trained on 5,600 OCT B-scans from 385 eyes -- was developed to fully segment and quantify the choroid in EDI-OCT images, thus addressing these issues. Using the same dataset, we propose a Robust, Resolution-agnostic and Efficient Attention-based network for CHoroid segmentation (REACH). REACHNet leverages multi-resolution training with domain-specific data augmentation to promote generalisation, and uses a lightweight architecture with resolution-agnostic self-attention which is not only faster than Choroidalyzer's previous network (4 images/s vs. 2.75 images/s on a standard laptop CPU), but has greater performance for segmenting the choroid region, vessels and fovea (Dice coefficient for region 0.9769 vs. 0.9749, vessels 0.8612 vs. 0.8192 and fovea 0.8243 vs. 0.3783) due to its improved hyperparameter configuration and model training pipeline. REACHNet can be used with Choroidalyzer as a drop-in replacement for the original model and will be made available upon publication.
Choroidalyzer: An open-source, end-to-end pipeline for choroidal analysis in optical coherence tomography
Dec 05, 2023


Purpose: To develop Choroidalyzer, an open-source, end-to-end pipeline for segmenting the choroid region, vessels, and fovea, and deriving choroidal thickness, area, and vascular index. Methods: We used 5,600 OCT B-scans (233 subjects, 6 systemic disease cohorts, 3 device types, 2 manufacturers). To generate region and vessel ground-truths, we used state-of-the-art automatic methods following manual correction of inaccurate segmentations, with foveal positions manually annotated. We trained a U-Net deep-learning model to detect the region, vessels, and fovea to calculate choroid thickness, area, and vascular index in a fovea-centred region of interest. We analysed segmentation agreement (AUC, Dice) and choroid metrics agreement (Pearson, Spearman, mean absolute error (MAE)) in internal and external test sets. We compared Choroidalyzer to two manual graders on a small subset of external test images and examined cases of high error. Results: Choroidalyzer took 0.299 seconds per image on a standard laptop and achieved excellent region (Dice: internal 0.9789, external 0.9749), very good vessel segmentation performance (Dice: internal 0.8817, external 0.8703) and excellent fovea location prediction (MAE: internal 3.9 pixels, external 3.4 pixels). For thickness, area, and vascular index, Pearson correlations were 0.9754, 0.9815, and 0.8285 (internal) / 0.9831, 0.9779, 0.7948 (external), respectively (all p<0.0001). Choroidalyzer's agreement with graders was comparable to the inter-grader agreement across all metrics. Conclusions: Choroidalyzer is an open-source, end-to-end pipeline that accurately segments the choroid and reliably extracts thickness, area, and vascular index. Especially choroidal vessel segmentation is a difficult and subjective task, and fully-automatic methods like Choroidalyzer could provide objectivity and standardisation.
Efficient and fully-automatic retinal choroid segmentation in OCT through DL-based distillation of a hand-crafted pipeline
Jul 03, 2023


Retinal vascular phenotypes, derived from low-cost, non-invasive retinal imaging, have been linked to systemic conditions such as cardio-, neuro- and reno-vascular disease. Recent high-resolution optical coherence tomography (OCT) allows imaging of the choroidal microvasculature which could provide more information about vascular health that complements the superficial retinal vessels, which current vascular phenotypes are based on. Segmentation of the choroid in OCT is a key step in quantifying choroidal parameters like thickness and area. Gaussian Process Edge Tracing (GPET) is a promising, clinically validated method for this. However, GPET is semi-automatic and thus requires time-consuming manual interventions by specifically trained personnel which introduces subjectivity and limits the potential for analysing larger datasets or deploying GPET into clinical practice. We introduce DeepGPET, which distils GPET into a neural network to yield a fully-automatic and efficient choroidal segmentation method. DeepGPET achieves excellent agreement with GPET on data from 3 clinical studies (AUC=0.9994, Dice=0.9664; Pearson correlation of 0.8908 for choroidal thickness and 0.9082 for choroidal area), while reducing the mean processing time per image from 34.49s ($\pm$15.09) to 1.25s ($\pm$0.10) on a standard laptop CPU and removing all manual interventions. DeepGPET will be made available for researchers upon publication.
Evaluation of an automated choroid segmentation algorithm in a longitudinal kidney donor and recipient cohort
Jun 19, 2023This study evaluated the performance of an automated choroid segmentation algorithm in enhanced depth imaging optical coherence tomography (EDI-OCT) images from a longitudinal kidney donor and recipient cohort. We assessed 22 donors and 23 patients with end-stage kidney disease during the course of donating and receiving a kidney transplant, respectively, over a period of 1 year. We assessed choroid thickness and area on EDI-OCT scans and compared our automated measurements to manual ones at the same locations. We estimated associations between measurements of the choroid and markers of renal function (serum urea and creatinine, estimated glomerular filtration rate (eGFR)) using correlation and linear mixed-effects models. There was good agreement between manual and automated measures. Automated measures were more precise because of smaller measurement error, especially with repeated measures over time. Associations with renal function were stronger with automated measures (creatinine P=0.01, eGFR P=0.02) compared to manual ones (creatinine P=0.12, eGFR P=0.06). Significant linear associations were observed between the choroid and urea, creatinine, and eGFR in recipients, and urea in donors. Our automated approach has greater precision than manual measurements. Greater longitudinal reproducibility of automated measurements may explain stronger associations with renal function compared to manual measurements. To improve detection of meaningful associations with clinical endpoints in longitudinal studies of OCT, reducing measurement error should be a priority, and automated measurements help achieve this.
Edge Tracing using Gaussian Process Regression
Nov 05, 2021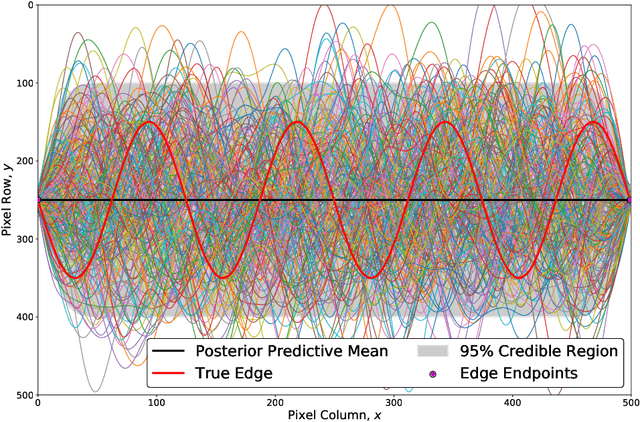
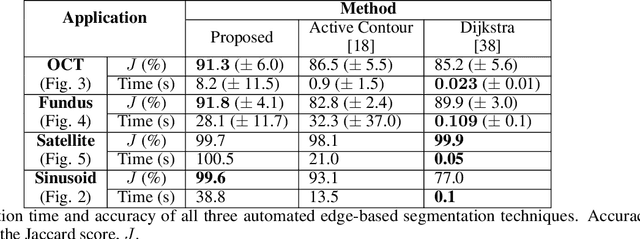
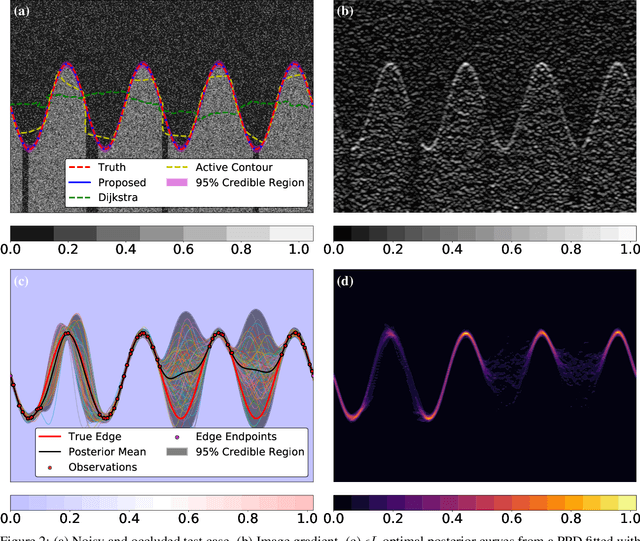
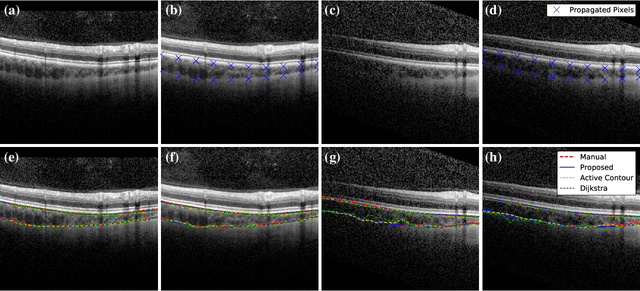
We introduce a novel edge tracing algorithm using Gaussian process regression. Our edge-based segmentation algorithm models an edge of interest using Gaussian process regression and iteratively searches the image for edge pixels in a recursive Bayesian scheme. This procedure combines local edge information from the image gradient and global structural information from posterior curves, sampled from the model's posterior predictive distribution, to sequentially build and refine an observation set of edge pixels. This accumulation of pixels converges the distribution to the edge of interest. Hyperparameters can be tuned by the user at initialisation and optimised given the refined observation set. This tunable approach does not require any prior training and is not restricted to any particular type of imaging domain. Due to the model's uncertainty quantification, the algorithm is robust to artefacts and occlusions which degrade the quality and continuity of edges in images. Our approach also has the ability to efficiently trace edges in image sequences by using previous-image edge traces as a priori information for consecutive images. Various applications to medical imaging and satellite imaging are used to validate the technique and comparisons are made with two commonly used edge tracing algorithms.