 Add to Chrome
 Add to Firefox
 Add to Edge
Layer-Wise Perturbations via Sparse Autoencoders for Adversarial Text Generation
Aug 14, 2025With the rapid proliferation of Natural Language Processing (NLP), especially Large Language Models (LLMs), generating adversarial examples to jailbreak LLMs remains a key challenge for understanding model vulnerabilities and improving robustness. In this context, we propose a new black-box attack method that leverages the interpretability of large models. We introduce the Sparse Feature Perturbation Framework (SFPF), a novel approach for adversarial text generation that utilizes sparse autoencoders to identify and manipulate critical features in text. After using the SAE model to reconstruct hidden layer representations, we perform feature clustering on the successfully attacked texts to identify features with higher activations. These highly activated features are then perturbed to generate new adversarial texts. This selective perturbation preserves the malicious intent while amplifying safety signals, thereby increasing their potential to evade existing defenses. Our method enables a new red-teaming strategy that balances adversarial effectiveness with safety alignment. Experimental results demonstrate that adversarial texts generated by SFPF can bypass state-of-the-art defense mechanisms, revealing persistent vulnerabilities in current NLP systems.However, the method's effectiveness varies across prompts and layers, and its generalizability to other architectures and larger models remains to be validated.
Spatial Speech Translation: Translating Across Space With Binaural Hearables
Apr 25, 2025


Imagine being in a crowded space where people speak a different language and having hearables that transform the auditory space into your native language, while preserving the spatial cues for all speakers. We introduce spatial speech translation, a novel concept for hearables that translate speakers in the wearer's environment, while maintaining the direction and unique voice characteristics of each speaker in the binaural output. To achieve this, we tackle several technical challenges spanning blind source separation, localization, real-time expressive translation, and binaural rendering to preserve the speaker directions in the translated audio, while achieving real-time inference on the Apple M2 silicon. Our proof-of-concept evaluation with a prototype binaural headset shows that, unlike existing models, which fail in the presence of interference, we achieve a BLEU score of up to 22.01 when translating between languages, despite strong interference from other speakers in the environment. User studies further confirm the system's effectiveness in spatially rendering the translated speech in previously unseen real-world reverberant environments. Taking a step back, this work marks the first step towards integrating spatial perception into speech translation.
Full-Duplex-Bench: A Benchmark to Evaluate Full-duplex Spoken Dialogue Models on Turn-taking Capabilities
Mar 06, 2025


Spoken dialogue modeling introduces unique challenges beyond text-based language modeling, demanding robust turn-taking, backchanneling, and real-time interaction. Although most Spoken Dialogue Models (SDMs) rely on half-duplex processing (handling speech one turn at a time), emerging full-duplex SDMs can listen and speak simultaneously, enabling more natural and engaging conversations. However, current evaluations of such models remain limited, often focusing on turn-based metrics or high-level corpus analyses (e.g., turn gaps, pauses). To address this gap, we present Full-Duplex-Bench, a new benchmark that systematically evaluates key conversational behaviors: pause handling, backchanneling, turn-taking, and interruption management. Our framework uses automatic metrics for consistent and reproducible assessments of SDMs' interactive performance. By offering an open and standardized evaluation benchmark, we aim to advance spoken dialogue modeling and encourage the development of more interactive and natural dialogue systems.
Multi-Modal Video Feature Extraction for Popularity Prediction
Jan 02, 2025This work aims to predict the popularity of short videos using the videos themselves and their related features. Popularity is measured by four key engagement metrics: view count, like count, comment count, and share count. This study employs video classification models with different architectures and training methods as backbone networks to extract video modality features. Meanwhile, the cleaned video captions are incorporated into a carefully designed prompt framework, along with the video, as input for video-to-text generation models, which generate detailed text-based video content understanding. These texts are then encoded into vectors using a pre-trained BERT model. Based on the six sets of vectors mentioned above, a neural network is trained for each of the four prediction metrics. Moreover, the study conducts data mining and feature engineering based on the video and tabular data, constructing practical features such as the total frequency of hashtag appearances, the total frequency of mention appearances, video duration, frame count, frame rate, and total time online. Multiple machine learning models are trained, and the most stable model, XGBoost, is selected. Finally, the predictions from the neural network and XGBoost models are averaged to obtain the final result.
A Closer Look at Neural Codec Resynthesis: Bridging the Gap between Codec and Waveform Generation
Oct 29, 2024


Neural Audio Codecs, initially designed as a compression technique, have gained more attention recently for speech generation. Codec models represent each audio frame as a sequence of tokens, i.e., discrete embeddings. The discrete and low-frequency nature of neural codecs introduced a new way to generate speech with token-based models. As these tokens encode information at various levels of granularity, from coarse to fine, most existing works focus on how to better generate the coarse tokens. In this paper, we focus on an equally important but often overlooked question: How can we better resynthesize the waveform from coarse tokens? We point out that both the choice of learning target and resynthesis approach have a dramatic impact on the generated audio quality. Specifically, we study two different strategies based on token prediction and regression, and introduce a new method based on Schr\"odinger Bridge. We examine how different design choices affect machine and human perception.
Effect of Adaptation Rate and Cost Display in a Human-AI Interaction Game
Aug 26, 2024


As interactions between humans and AI become more prevalent, it is critical to have better predictors of human behavior in these interactions. We investigated how changes in the AI's adaptive algorithm impact behavior predictions in two-player continuous games. In our experiments, the AI adapted its actions using a gradient descent algorithm under different adaptation rates while human participants were provided cost feedback. The cost feedback was provided by one of two types of visual displays: (a) cost at the current joint action vector, or (b) cost in a local neighborhood of the current joint action vector. Our results demonstrate that AI adaptation rate can significantly affect human behavior, having the ability to shift the outcome between two game theoretic equilibrium. We observed that slow adaptation rates shift the outcome towards the Nash equilibrium, while fast rates shift the outcome towards the human-led Stackelberg equilibrium. The addition of localized cost information had the effect of shifting outcomes towards Nash, compared to the outcomes from cost information at only the current joint action vector. Future work will investigate other effects that influence the convergence of gradient descent games.
Target conversation extraction: Source separation using turn-taking dynamics
Jul 15, 2024


Extracting the speech of participants in a conversation amidst interfering speakers and noise presents a challenging problem. In this paper, we introduce the novel task of target conversation extraction, where the goal is to extract the audio of a target conversation based on the speaker embedding of one of its participants. To accomplish this, we propose leveraging temporal patterns inherent in human conversations, particularly turn-taking dynamics, which uniquely characterize speakers engaged in conversation and distinguish them from interfering speakers and noise. Using neural networks, we show the feasibility of our approach on English and Mandarin conversation datasets. In the presence of interfering speakers, our results show an 8.19 dB improvement in signal-to-noise ratio for 2-speaker conversations and a 7.92 dB improvement for 2-4-speaker conversations. Code, dataset available at https://github.com/chentuochao/Target-Conversation-Extraction.
MaskSR: Masked Language Model for Full-band Speech Restoration
Jun 04, 2024Speech restoration aims at restoring high quality speech in the presence of a diverse set of distortions. Although several deep learning paradigms have been studied for this task, the power of the recently emerging language models has not been fully explored. In this paper, we propose MaskSR, a masked language model capable of restoring full-band 44.1 kHz speech jointly considering noise, reverb, clipping, and low bandwidth. MaskSR works with discrete acoustic tokens extracted using a pre-trained neural codec. During training, MaskSR is optimized to predict randomly masked tokens extracted from the high quality target speech, conditioned on the corrupted speech with various distortions. During inference, MaskSR reconstructs the target speech tokens with efficient iterative sampling. Extensive experiments show that MaskSR obtains competitive results on both the full-band speech restoration task and also on sub-tasks compared with a wide range of models.
A Co-analysis Framework for Exploring Multivariate Scientific Data
Aug 19, 2019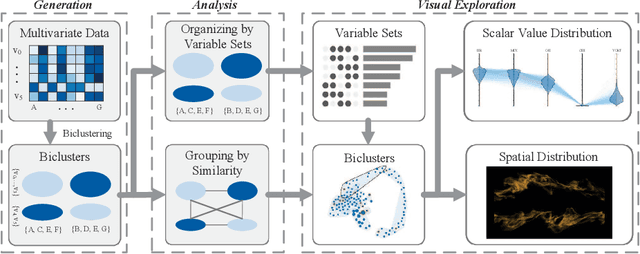
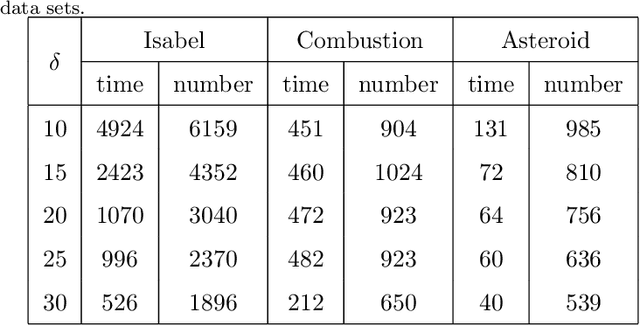
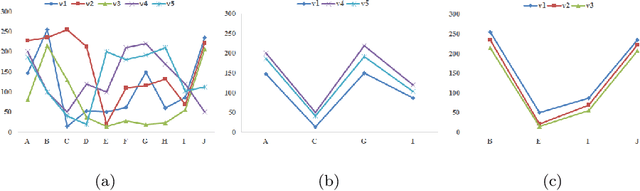
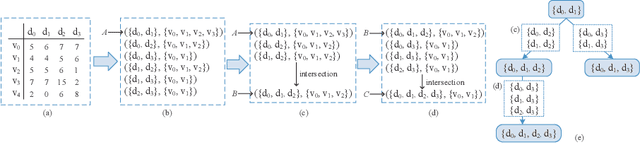
In complex multivariate data sets, different features usually include diverse associations with different variables, and different variables are associated within different regions. Therefore, exploring the associations between variables and voxels locally becomes necessary to better understand the underlying phenomena. In this paper, we propose a co-analysis framework based on biclusters, which are two subsets of variables and voxels with close scalar-value relationships, to guide the process of visually exploring multivariate data. We first automatically extract all meaningful biclusters, each of which only contains voxels with a similar scalar-value pattern over a subset of variables. These biclusters are organized according to their variable sets, and biclusters in each variable set are further grouped by a similarity metric to reduce redundancy and support diversity during visual exploration. Biclusters are visually represented in coordinated views to facilitate interactive exploration of multivariate data based on the similarity between biclusters and the correlation of scalar values with different variables. Experiments on several representative multivariate scientific data sets demonstrate the effectiveness of our framework in exploring local relationships among variables, biclusters and scalar values in the data.
* 31 pages, 7 figures
Multivariate Spatial Data Visualization: A Survey
Aug 18, 2019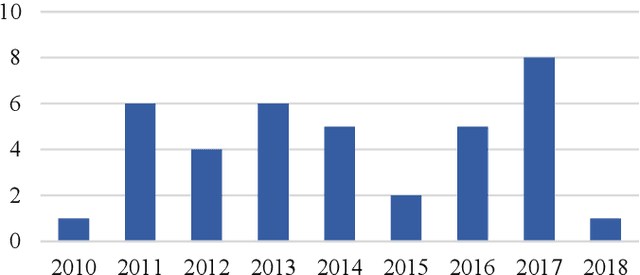
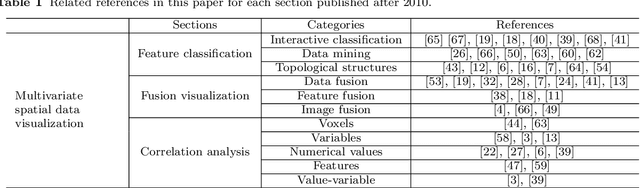
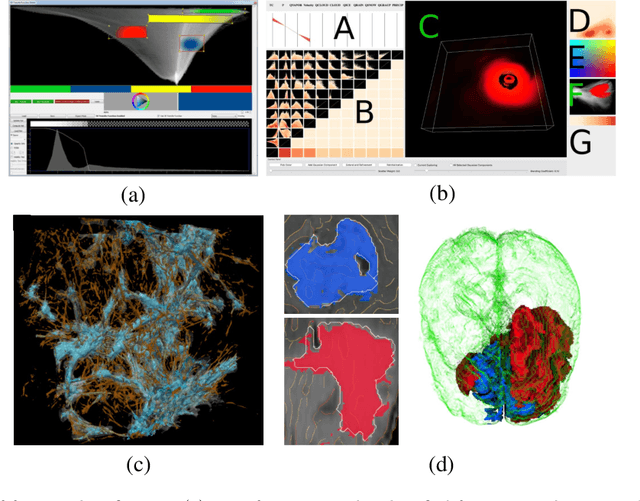
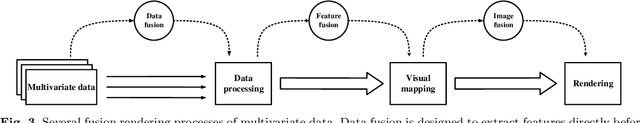
Multivariate spatial data plays an important role in computational science and engineering simulations. The potential features and hidden relationships in multivariate data can assist scientists to gain an in-depth understanding of a scientific process, verify a hypothesis and further discover a new physical or chemical law. In this paper, we present a comprehensive survey of the state-of-the-art techniques for multivariate spatial data visualization. We first introduce the basic concept and characteristics of multivariate spatial data, and describe three main tasks in multivariate data visualization: feature classification, fusion visualization, and correlation analysis. Finally, we prospect potential research topics for multivariate data visualization according to the current research.
* 16 pages, 5 figures. Corresponding author: Yubo Tao