 Add to Chrome
 Add to Firefox
 Add to Edge
CAFOSat: A Strongly Annotated Dataset for Infrastructure-Aware CAFO Mapping Using High-Resolution Imagery
May 30, 2026Concentrated Animal Feeding Operations (CAFOs) play an important role in agricultural production but are also associated with environmental, public health, and disease surveillance concerns. Large-scale mapping of CAFOs from remote sensing imagery remains challenging due to heterogeneous infrastructure layouts, noisy location records, inconsistent annotations, and incomplete inventories. We introduce CAFOSat, a strongly annotated, infrastructure-aware dataset for CAFO mapping across the United States. CAFOSat integrates high-resolution National Agriculture Imagery Program (NAIP) imagery with multi-source CAFO inventories collected across multiple states and transforms weak geolocation records into refined annotations through a human-in-the-loop pipeline combining AI-assisted annotation, GradCAM-based localization, and geometric clustering. To improve dataset quality, we curate challenging negative samples using land-cover-guided sampling with spatial exclusion constraints and provide infrastructure-level annotations, including barns, manure ponds, and grazing-related features, through manual verification. The resulting dataset contains more than 45,000 image patches spanning 20 states and four major CAFO categories. We benchmark a diverse set of convolutional, transformer-based, and vision-language models, demonstrating the value of refined annotations and curated negative samples for CAFO classification and generalization. In addition, we introduce a synthetic augmentation pipeline that generates infrastructure-aware variations to increase training diversity and improve robustness under distribution shifts. CAFOSat provides a large-scale benchmark for advancing infrastructure-aware agricultural monitoring and CAFO mapping from high-resolution remote sensing imagery.
IDOBE: Infectious Disease Outbreak forecasting Benchmark Ecosystem
Apr 20, 2026Epidemic forecasting has become an integral part of real-time infectious disease outbreak response. While collaborative ensembles composed of statistical and machine learning models have become the norm for real-time forecasting, standardized benchmark datasets for evaluating such methods are lacking. Further, there is limited understanding on performance of these methods for novel outbreaks with limited historical data. In this paper, we propose IDOBE, a curated collection of epidemiological time series focused on outbreak forecasting. IDOBE compiles from multiple data repositories spanning over a century of surveillance and across U.S. states and global locations. We perform derivative-based segmentation to generate over 10,000 outbreaks covering multiple outcomes such as cases and hospitalizations for 13 diseases. We consider a variety of information-theoretic and distributional measures to quantify the epidemiological diversity of the dataset. Finally, we perform multi-horizon short-term forecasting (1- to 4-week-ahead) through the progression of the outbreak using 11 baseline models and report on their performance. In addition to standard metrics such as NMSE and MAPE for point forecasts, we include probabilistic scoring rules such as Normalized Weighted Interval Score (NWIS) to quantify the performance. We find that MLP-based methods have the most robust performance, with statistical methods having a slight edge during the pre-peak phase. IDOBE dataset along with baselines are released publicly on https://github.com/NSSAC/IDOBE to enable standardized, reproducible benchmarking of outbreak forecasting methods.
PRISM-CAFO: Prior-conditioned Remote-sensing Infrastructure Segmentation and Mapping for CAFOs
Jan 16, 2026Large-scale livestock operations pose significant risks to human health and the environment, while also being vulnerable to threats such as infectious diseases and extreme weather events. As the number of such operations continues to grow, accurate and scalable mapping has become increasingly important. In this work, we present an infrastructure-first, explainable pipeline for identifying and characterizing Concentrated Animal Feeding Operations (CAFOs) from aerial and satellite imagery. Our method (1) detects candidate infrastructure (e.g., barns, feedlots, manure lagoons, silos) with a domain-tuned YOLOv8 detector, then derives SAM2 masks from these boxes and filters component-specific criteria, (2) extracts structured descriptors (e.g., counts, areas, orientations, and spatial relations) and fuses them with deep visual features using a lightweight spatial cross-attention classifier, and (3) outputs both CAFO type predictions and mask-level attributions that link decisions to visible infrastructure. Through comprehensive evaluation, we show that our approach achieves state-of-the-art performance, with Swin-B+PRISM-CAFO surpassing the best performing baseline by up to 15\%. Beyond strong predictive performance across diverse U.S. regions, we run systematic gradient--activation analyses that quantify the impact of domain priors and show ho
IrrMap: A Large-Scale Comprehensive Dataset for Irrigation Method Mapping
May 13, 2025


We introduce IrrMap, the first large-scale dataset (1.1 million patches) for irrigation method mapping across regions. IrrMap consists of multi-resolution satellite imagery from LandSat and Sentinel, along with key auxiliary data such as crop type, land use, and vegetation indices. The dataset spans 1,687,899 farms and 14,117,330 acres across multiple western U.S. states from 2013 to 2023, providing a rich and diverse foundation for irrigation analysis and ensuring geospatial alignment and quality control. The dataset is ML-ready, with standardized 224x224 GeoTIFF patches, the multiple input modalities, carefully chosen train-test-split data, and accompanying dataloaders for seamless deep learning model training andbenchmarking in irrigation mapping. The dataset is also accompanied by a complete pipeline for dataset generation, enabling researchers to extend IrrMap to new regions for irrigation data collection or adapt it with minimal effort for other similar applications in agricultural and geospatial analysis. We also analyze the irrigation method distribution across crop groups, spatial irrigation patterns (using Shannon diversity indices), and irrigated area variations for both LandSat and Sentinel, providing insights into regional and resolution-based differences. To promote further exploration, we openly release IrrMap, along with the derived datasets, benchmark models, and pipeline code, through a GitHub repository: https://github.com/Nibir088/IrrMap and Data repository: https://huggingface.co/Nibir/IrrMap, providing comprehensive documentation and implementation details.
Knowledge-Informed Deep Learning for Irrigation Type Mapping from Remote Sensing
May 13, 2025Accurate mapping of irrigation methods is crucial for sustainable agricultural practices and food systems. However, existing models that rely solely on spectral features from satellite imagery are ineffective due to the complexity of agricultural landscapes and limited training data, making this a challenging problem. We present Knowledge-Informed Irrigation Mapping (KIIM), a novel Swin-Transformer based approach that uses (i) a specialized projection matrix to encode crop to irrigation probability, (ii) a spatial attention map to identify agricultural lands from non-agricultural lands, (iii) bi-directional cross-attention to focus complementary information from different modalities, and (iv) a weighted ensemble for combining predictions from images and crop information. Our experimentation on five states in the US shows up to 22.9\% (IoU) improvement over baseline with a 71.4% (IoU) improvement for hard-to-classify drip irrigation. In addition, we propose a two-phase transfer learning approach to enhance cross-state irrigation mapping, achieving a 51% IoU boost in a state with limited labeled data. The ability to achieve baseline performance with only 40% of the training data highlights its efficiency, reducing the dependency on extensive manual labeling efforts and making large-scale, automated irrigation mapping more feasible and cost-effective.
A Generative AI Technique for Synthesizing a Digital Twin for U.S. Residential Solar Adoption and Generation
Oct 10, 2024


Residential rooftop solar adoption is considered crucial for reducing carbon emissions. The lack of photovoltaic (PV) data at a finer resolution (e.g., household, hourly levels) poses a significant roadblock to informed decision-making. We discuss a novel methodology to generate a highly granular, residential-scale realistic dataset for rooftop solar adoption across the contiguous United States. The data-driven methodology consists of: (i) integrated machine learning models to identify PV adopters, (ii) methods to augment the data using explainable AI techniques to glean insights about key features and their interactions, and (iii) methods to generate household-level hourly solar energy output using an analytical model. The resulting synthetic datasets are validated using real-world data and can serve as a digital twin for modeling downstream tasks. Finally, a policy-based case study utilizing the digital twin for Virginia demonstrated increased rooftop solar adoption with the 30\% Federal Solar Investment Tax Credit, especially in Low-to-Moderate-Income communities.
IrrNet: Advancing Irrigation Mapping with Incremental Patch Size Training on Remote Sensing Imagery
Apr 17, 2024


Irrigation mapping plays a crucial role in effective water management, essential for preserving both water quality and quantity, and is key to mitigating the global issue of water scarcity. The complexity of agricultural fields, adorned with diverse irrigation practices, especially when multiple systems coexist in close quarters, poses a unique challenge. This complexity is further compounded by the nature of Landsat's remote sensing data, where each pixel is rich with densely packed information, complicating the task of accurate irrigation mapping. In this study, we introduce an innovative approach that employs a progressive training method, which strategically increases patch sizes throughout the training process, utilizing datasets from Landsat 5 and 7, labeled with the WRLU dataset for precise labeling. This initial focus allows the model to capture detailed features, progressively shifting to broader, more general features as the patch size enlarges. Remarkably, our method enhances the performance of existing state-of-the-art models by approximately 20%. Furthermore, our analysis delves into the significance of incorporating various spectral bands into the model, assessing their impact on performance. The findings reveal that additional bands are instrumental in enabling the model to discern finer details more effectively. This work sets a new standard for leveraging remote sensing imagery in irrigation mapping.
High-resolution synthetic residential energy use profiles for the United States
Oct 14, 2022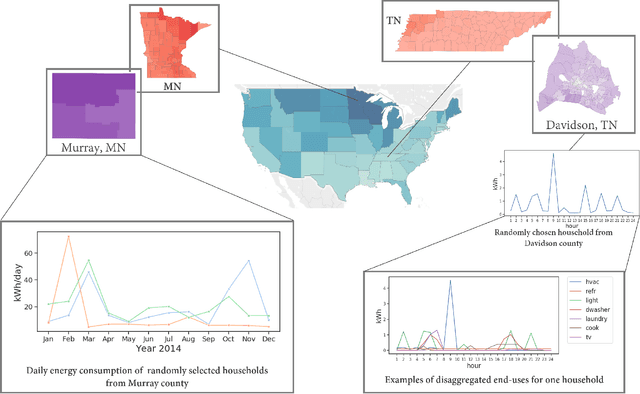
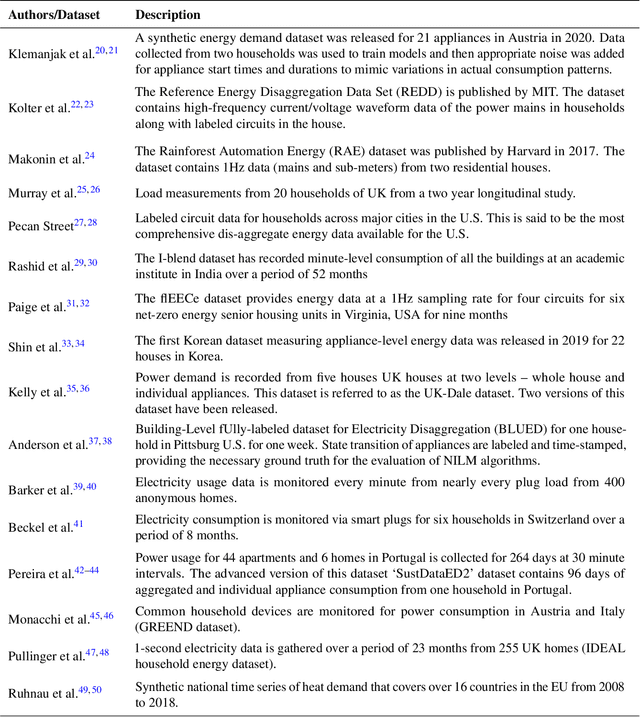
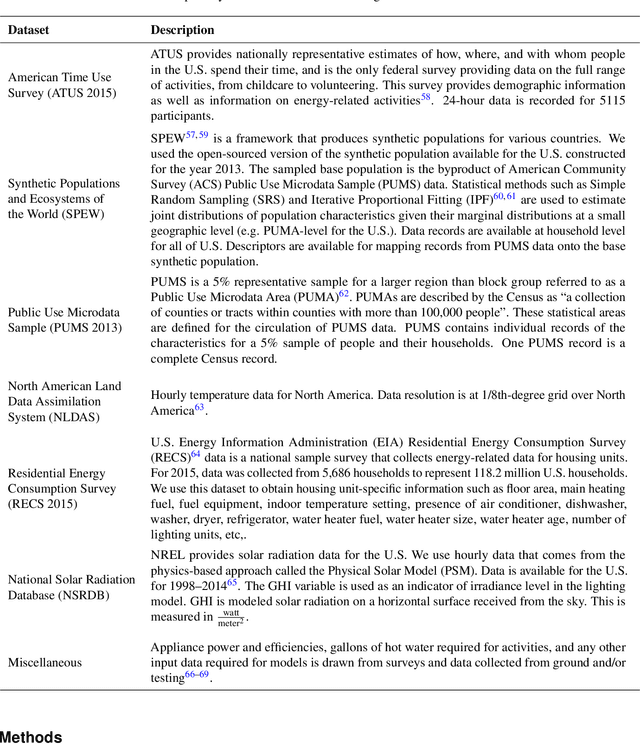
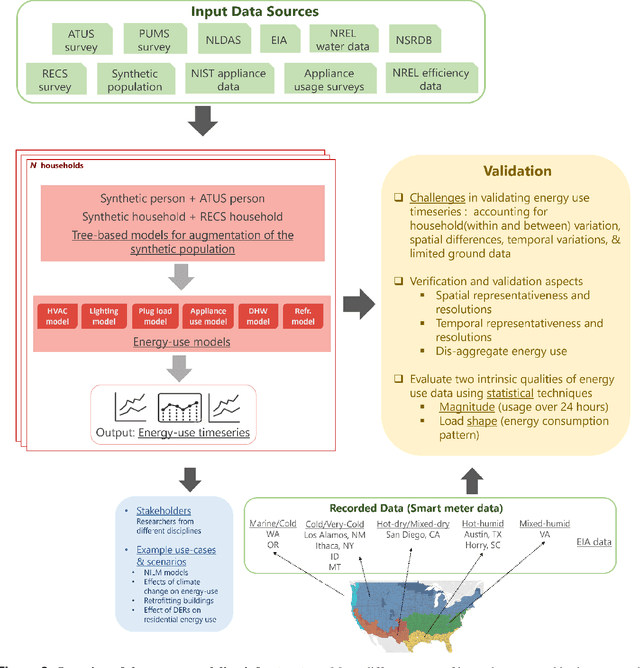
Efficient energy consumption is crucial for achieving sustainable energy goals in the era of climate change and grid modernization. Thus, it is vital to understand how energy is consumed at finer resolutions such as household in order to plan demand-response events or analyze the impacts of weather, electricity prices, electric vehicles, solar, and occupancy schedules on energy consumption. However, availability and access to detailed energy-use data, which would enable detailed studies, has been rare. In this paper, we release a unique, large-scale, synthetic, residential energy-use dataset for the residential sector across the contiguous United States covering millions of households. The data comprise of hourly energy use profiles for synthetic households, disaggregated into Thermostatically Controlled Loads (TCL) and appliance use. The underlying framework is constructed using a bottom-up approach. Diverse open-source surveys and first principles models are used for end-use modeling. Extensive validation of the synthetic dataset has been conducted through comparisons with reported energy-use data. We present a detailed, open, high-resolution, residential energy-use dataset for the United States.
A Scalable Data-Driven Technique for Joint Evacuation Routing and Scheduling Problems
Sep 12, 2022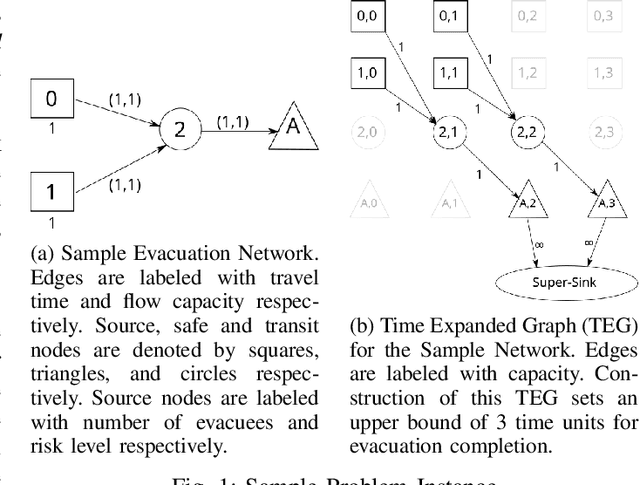
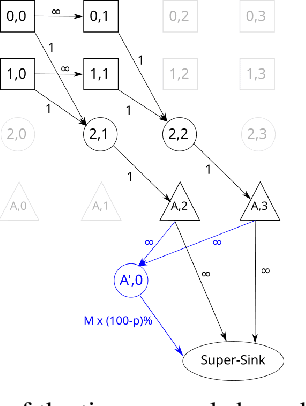
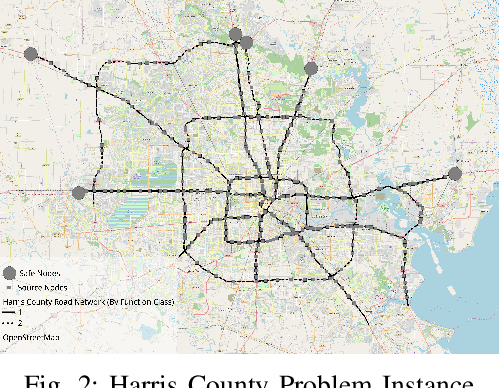
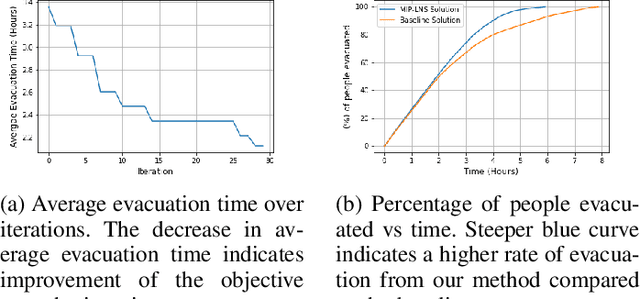
Evacuation planning is a crucial part of disaster management where the goal is to relocate people to safety and minimize casualties. Every evacuation plan has two essential components: routing and scheduling. However, joint optimization of these two components with objectives such as minimizing average evacuation time or evacuation completion time, is a computationally hard problem. To approach it, we present MIP-LNS, a scalable optimization method that combines heuristic search with mathematical optimization and can optimize a variety of objective functions. We use real-world road network and population data from Harris County in Houston, Texas, and apply MIP-LNS to find evacuation routes and schedule for the area. We show that, within a given time limit, our proposed method finds better solutions than existing methods in terms of average evacuation time, evacuation completion time and optimality guarantee of the solutions. We perform agent-based simulations of evacuation in our study area to demonstrate the efficacy and robustness of our solution. We show that our prescribed evacuation plan remains effective even if the evacuees deviate from the suggested schedule upto a certain extent. We also examine how evacuation plans are affected by road failures. Our results show that MIP-LNS can use information regarding estimated deadline of roads to come up with better evacuation plans in terms evacuating more people successfully and conveniently.
Deploying Vaccine Distribution Sites for Improved Accessibility and Equity to Support Pandemic Response
Feb 09, 2022
In response to COVID-19, many countries have mandated social distancing and banned large group gatherings in order to slow down the spread of SARS-CoV-2. These social interventions along with vaccines remain the best way forward to reduce the spread of SARS CoV-2. In order to increase vaccine accessibility, states such as Virginia have deployed mobile vaccination centers to distribute vaccines across the state. When choosing where to place these sites, there are two important factors to take into account: accessibility and equity. We formulate a combinatorial problem that captures these factors and then develop efficient algorithms with theoretical guarantees on both of these aspects. Furthermore, we study the inherent hardness of the problem, and demonstrate strong impossibility results. Finally, we run computational experiments on real-world data to show the efficacy of our methods.