 Add to Chrome
 Add to Firefox
 Add to Edge
CiQi-Agent: Aligning Vision, Tools and Aesthetics in Multimodal Agent for Cultural Reasoning on Chinese Porcelains
Mar 30, 2026The connoisseurship of antique Chinese porcelain demands extensive historical expertise, material understanding, and aesthetic sensitivity, making it difficult for non-specialists to engage. To democratize cultural-heritage understanding and assist expert connoisseurship, we introduce CiQi-Agent -- a domain-specific Porcelain Connoisseurship Agent for intelligent analysis of antique Chinese porcelain. CiQi-Agent supports multi-image porcelain inputs and enables vision tool invocation and multimodal retrieval-augmented generation, performing fine-grained connoisseurship analysis across six attributes: dynasty, reign period, kiln site, glaze color, decorative motif, and vessel shape. Beyond attribute classification, it captures subtle visual details, retrieves relevant domain knowledge, and integrates visual and textual evidence to produce coherent, explainable connoisseurship descriptions. To achieve this capability, we construct a large-scale, expert-annotated dataset CiQi-VQA, comprising 29,596 porcelain specimens, 51,553 images, and 557,940 visual question--answering pairs, and further establish a comprehensive benchmark CiQi-Bench aligned with the previously mentioned six attributes. CiQi-Agent is trained through supervised fine-tuning, reinforcement learning, and a tool-augmented reasoning framework that integrates two categories of tools: a vision tool and multimodal retrieval tools. Experimental results show that CiQi-Agent (7B) outperforms all competitive open- and closed-source models across all six attributes on CiQi-Bench, achieving on average 12.2\% higher accuracy than GPT-5. The model and dataset have been released and are publicly available at https://huggingface.co/datasets/SII-Monument-Valley/CiQi-VQA.
OpenAI GPT-5 System Card
Dec 19, 2025This is the system card published alongside the OpenAI GPT-5 launch, August 2025. GPT-5 is a unified system with a smart and fast model that answers most questions, a deeper reasoning model for harder problems, and a real-time router that quickly decides which model to use based on conversation type, complexity, tool needs, and explicit intent (for example, if you say 'think hard about this' in the prompt). The router is continuously trained on real signals, including when users switch models, preference rates for responses, and measured correctness, improving over time. Once usage limits are reached, a mini version of each model handles remaining queries. This system card focuses primarily on gpt-5-thinking and gpt-5-main, while evaluations for other models are available in the appendix. The GPT-5 system not only outperforms previous models on benchmarks and answers questions more quickly, but -- more importantly -- is more useful for real-world queries. We've made significant advances in reducing hallucinations, improving instruction following, and minimizing sycophancy, and have leveled up GPT-5's performance in three of ChatGPT's most common uses: writing, coding, and health. All of the GPT-5 models additionally feature safe-completions, our latest approach to safety training to prevent disallowed content. Similarly to ChatGPT agent, we have decided to treat gpt-5-thinking as High capability in the Biological and Chemical domain under our Preparedness Framework, activating the associated safeguards. While we do not have definitive evidence that this model could meaningfully help a novice to create severe biological harm -- our defined threshold for High capability -- we have chosen to take a precautionary approach.
OpenAI o1 System Card
Dec 21, 2024


The o1 model series is trained with large-scale reinforcement learning to reason using chain of thought. These advanced reasoning capabilities provide new avenues for improving the safety and robustness of our models. In particular, our models can reason about our safety policies in context when responding to potentially unsafe prompts, through deliberative alignment. This leads to state-of-the-art performance on certain benchmarks for risks such as generating illicit advice, choosing stereotyped responses, and succumbing to known jailbreaks. Training models to incorporate a chain of thought before answering has the potential to unlock substantial benefits, while also increasing potential risks that stem from heightened intelligence. Our results underscore the need for building robust alignment methods, extensively stress-testing their efficacy, and maintaining meticulous risk management protocols. This report outlines the safety work carried out for the OpenAI o1 and OpenAI o1-mini models, including safety evaluations, external red teaming, and Preparedness Framework evaluations.
Detecting Neighborhood Gentrification at Scale via Street-level Visual Data
Jan 04, 2023


Neighborhood gentrification plays a significant role in shaping the social and economic well-being of both individuals and communities at large. While some efforts have been made to detect gentrification in cities, existing approaches rely mainly on estimated measures from survey data, require substantial work of human labeling, and are limited in characterizing the neighborhood as a whole. We propose a novel approach to detecting neighborhood gentrification at a large-scale based on the physical appearance of neighborhoods by incorporating historical street-level visual data. We show the effectiveness of the proposed method by comparing results from our approach with gentrification measures from previous literature and case studies. Our approach has the potential to supplement existing indicators of gentrification and become a valid resource for urban researchers and policy makers.
Extracting Built Environment Features for Planning Research with Computer Vision: A Review and Discussion of State-of-the-Art Approaches
Jan 30, 2022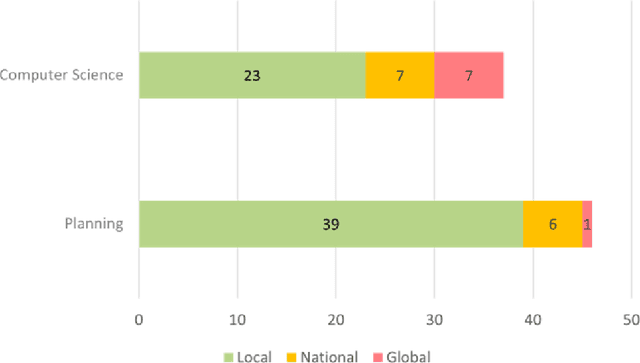
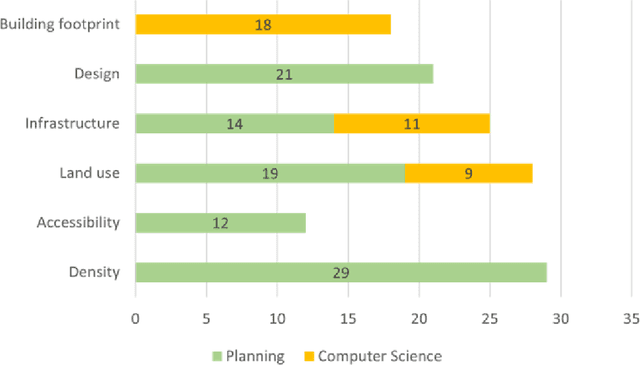
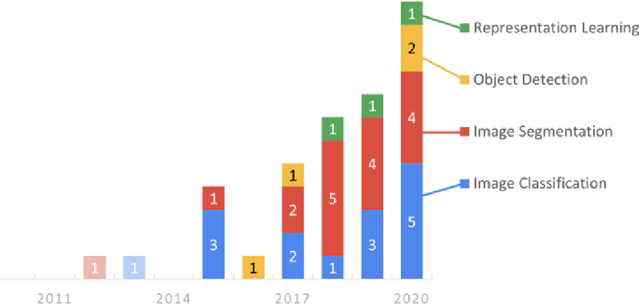
This is an extended abstract for a presentation at The 17th International Conference on CUPUM - Computational Urban Planning and Urban Management in June 2021. This study presents an interdisciplinary synthesis of the state-of-the-art approaches in computer vision technologies to extract built environment features that could improve the robustness of empirical research in planning. We discussed the findings from the review of studies in both planning and computer science.
Probability Paths and the Structure of Predictions over Time
Jun 11, 2021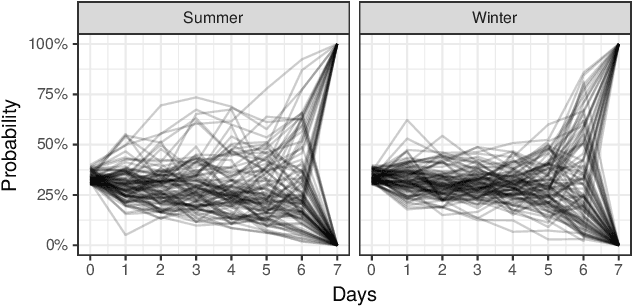
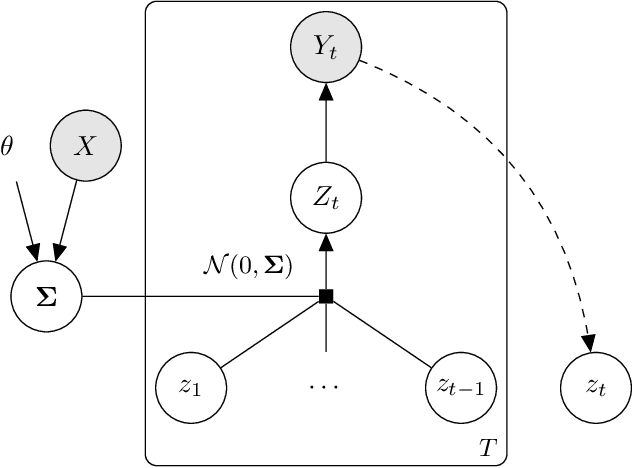
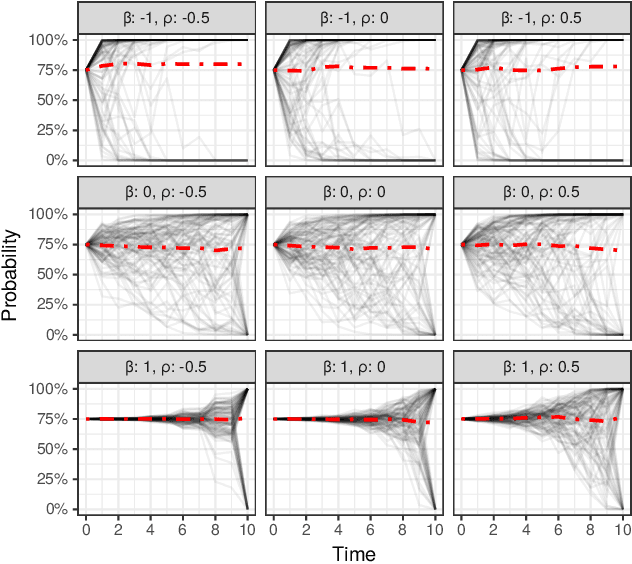
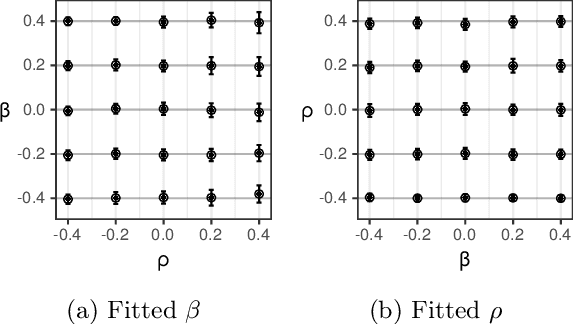
In settings ranging from weather forecasts to political prognostications to financial projections, probability estimates of future binary outcomes often evolve over time. For example, the estimated likelihood of rain on a specific day changes by the hour as new information becomes available. Given a collection of such probability paths, we introduce a Bayesian framework -- which we call the Gaussian latent information martingale, or GLIM -- for modeling the structure of dynamic predictions over time. Suppose, for example, that the likelihood of rain in a week is 50%, and consider two hypothetical scenarios. In the first, one expects the forecast is equally likely to become either 25% or 75% tomorrow; in the second, one expects the forecast to stay constant for the next several days. A time-sensitive decision-maker might select a course of action immediately in the latter scenario, but may postpone their decision in the former, knowing that new information is imminent. We model these trajectories by assuming predictions update according to a latent process of information flow, which is inferred from historical data. In contrast to general methods for time series analysis, this approach preserves the martingale structure of probability paths and better quantifies future uncertainties around probability paths. We show that GLIM outperforms three popular baseline methods, producing better estimated posterior probability path distributions measured by three different metrics. By elucidating the dynamic structure of predictions over time, we hope to help individuals make more informed choices.
Learning Neighborhood Representation from Multi-Modal Multi-Graph: Image, Text, Mobility Graph and Beyond
May 06, 2021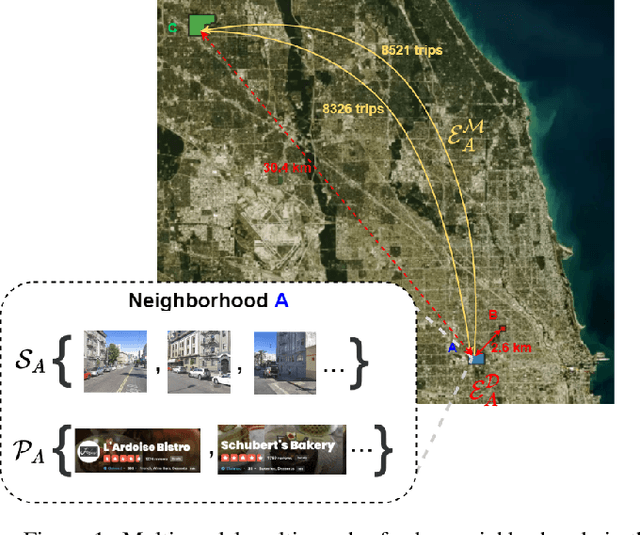
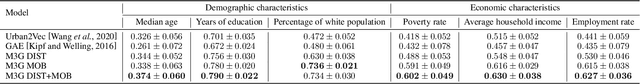
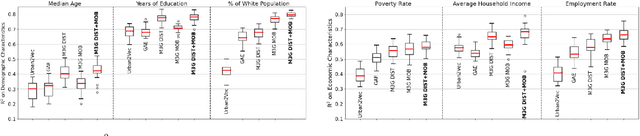
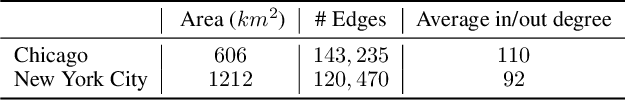
Recent urbanization has coincided with the enrichment of geotagged data, such as street view and point-of-interest (POI). Region embedding enhanced by the richer data modalities has enabled researchers and city administrators to understand the built environment, socioeconomics, and the dynamics of cities better. While some efforts have been made to simultaneously use multi-modal inputs, existing methods can be improved by incorporating different measures of 'proximity' in the same embedding space - leveraging not only the data that characterizes the regions (e.g., street view, local businesses pattern) but also those that depict the relationship between regions (e.g., trips, road network). To this end, we propose a novel approach to integrate multi-modal geotagged inputs as either node or edge features of a multi-graph based on their relations with the neighborhood region (e.g., tiles, census block, ZIP code region, etc.). We then learn the neighborhood representation based on a contrastive-sampling scheme from the multi-graph. Specifically, we use street view images and POI features to characterize neighborhoods (nodes) and use human mobility to characterize the relationship between neighborhoods (directed edges). We show the effectiveness of the proposed methods with quantitative downstream tasks as well as qualitative analysis of the embedding space: The embedding we trained outperforms the ones using only unimodal data as regional inputs.
Surveilling Surveillance: Estimating the Prevalence of Surveillance Cameras with Street View Data
May 04, 2021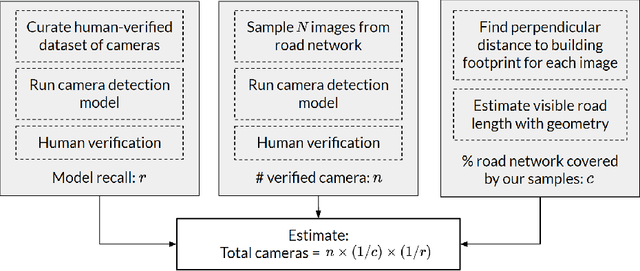
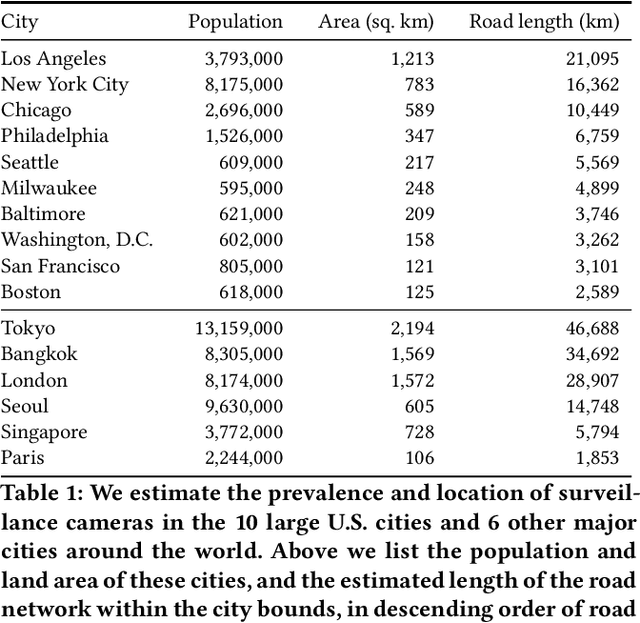
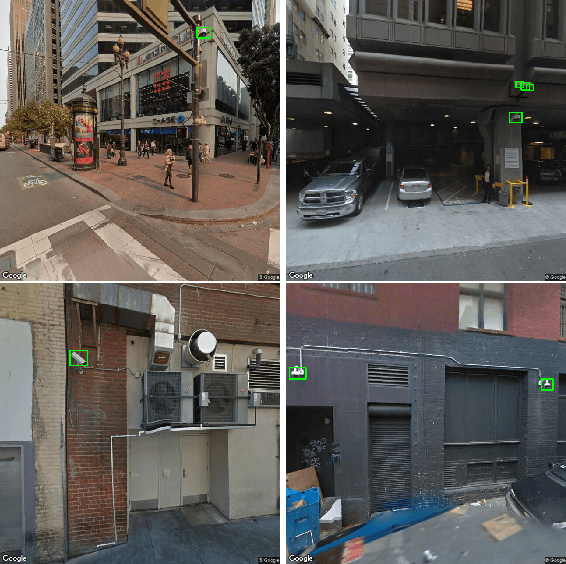
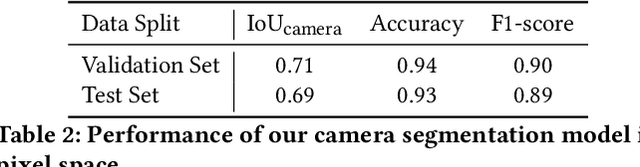
The use of video surveillance in public spaces -- both by government agencies and by private citizens -- has attracted considerable attention in recent years, particularly in light of rapid advances in face-recognition technology. But it has been difficult to systematically measure the prevalence and placement of cameras, hampering efforts to assess the implications of surveillance on privacy and public safety. Here we present a novel approach for estimating the spatial distribution of surveillance cameras: applying computer vision algorithms to large-scale street view image data. Specifically, we build a camera detection model and apply it to 1.6 million street view images sampled from 10 large U.S. cities and 6 other major cities around the world, with positive model detections verified by human experts. After adjusting for the estimated recall of our model, and accounting for the spatial coverage of our sampled images, we are able to estimate the density of surveillance cameras visible from the road. Across the 16 cities we consider, the estimated number of surveillance cameras per linear kilometer ranges from 0.1 (in Seattle) to 0.9 (in Seoul). In a detailed analysis of the 10 U.S. cities, we find that cameras are concentrated in commercial, industrial, and mixed zones, and in neighborhoods with higher shares of non-white residents -- a pattern that persists even after adjusting for land use. These results help inform ongoing discussions on the use of surveillance technology, including its potential disparate impacts on communities of color.
Multi-Task Time Series Forecasting With Shared Attention
Jan 24, 2021
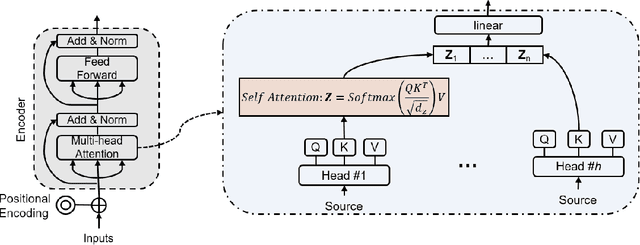
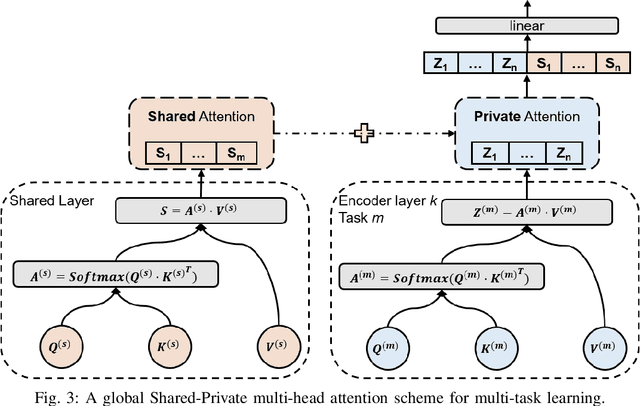
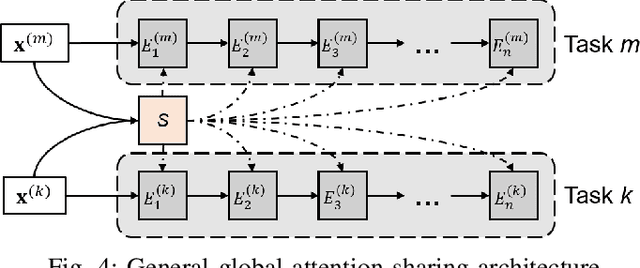
Time series forecasting is a key component in many industrial and business decision processes and recurrent neural network (RNN) based models have achieved impressive progress on various time series forecasting tasks. However, most of the existing methods focus on single-task forecasting problems by learning separately based on limited supervised objectives, which often suffer from insufficient training instances. As the Transformer architecture and other attention-based models have demonstrated its great capability of capturing long term dependency, we propose two self-attention based sharing schemes for multi-task time series forecasting which can train jointly across multiple tasks. We augment a sequence of paralleled Transformer encoders with an external public multi-head attention function, which is updated by all data of all tasks. Experiments on a number of real-world multi-task time series forecasting tasks show that our proposed architectures can not only outperform the state-of-the-art single-task forecasting baselines but also outperform the RNN-based multi-task forecasting method.
AGenT Zero: Zero-shot Automatic Multiple-Choice Question Generation for Skill Assessments
Dec 18, 2020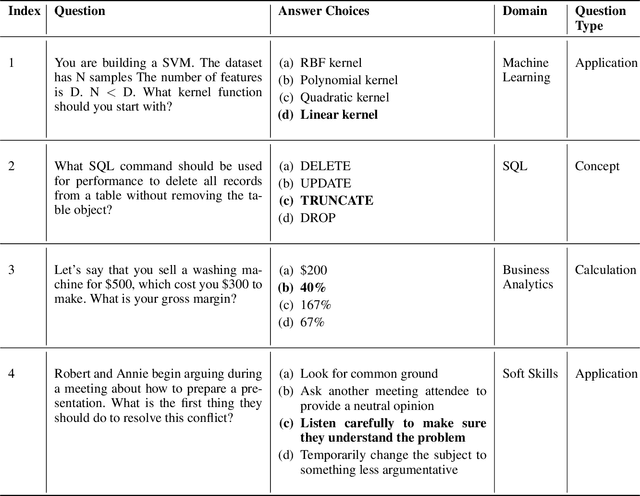
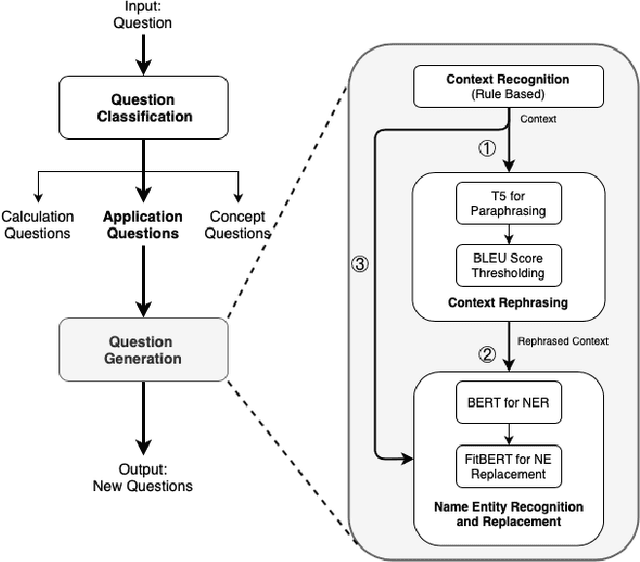
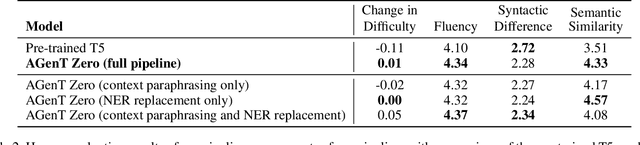
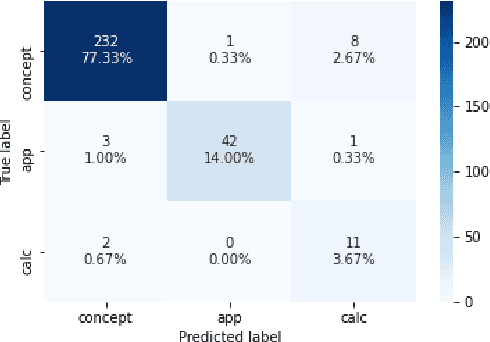
Multiple-choice questions (MCQs) offer the most promising avenue for skill evaluation in the era of virtual education and job recruiting, where traditional performance-based alternatives such as projects and essays have become less viable, and grading resources are constrained. The automated generation of MCQs would allow assessment creation at scale. Recent advances in natural language processing have given rise to many complex question generation methods. However, the few methods that produce deployable results in specific domains require a large amount of domain-specific training data that can be very costly to acquire. Our work provides an initial foray into MCQ generation under high data-acquisition cost scenarios by strategically emphasizing paraphrasing the question context (compared to the task). In addition to maintaining semantic similarity between the question-answer pairs, our pipeline, which we call AGenT Zero, consists of only pre-trained models and requires no fine-tuning, minimizing data acquisition costs for question generation. AGenT Zero successfully outperforms other pre-trained methods in fluency and semantic similarity. Additionally, with some small changes, our assessment pipeline can be generalized to a broader question and answer space, including short answer or fill in the blank questions.