 Add to Chrome
 Add to Firefox
 Add to Edge
UQ: Assessing Language Models on Unsolved Questions
Aug 25, 2025Benchmarks shape progress in AI research. A useful benchmark should be both difficult and realistic: questions should challenge frontier models while also reflecting real-world usage. Yet, current paradigms face a difficulty-realism tension: exam-style benchmarks are often made artificially difficult with limited real-world value, while benchmarks based on real user interaction often skew toward easy, high-frequency problems. In this work, we explore a radically different paradigm: assessing models on unsolved questions. Rather than a static benchmark scored once, we curate unsolved questions and evaluate models asynchronously over time with validator-assisted screening and community verification. We introduce UQ, a testbed of 500 challenging, diverse questions sourced from Stack Exchange, spanning topics from CS theory and math to sci-fi and history, probing capabilities including reasoning, factuality, and browsing. UQ is difficult and realistic by construction: unsolved questions are often hard and naturally arise when humans seek answers, thus solving them yields direct real-world value. Our contributions are threefold: (1) UQ-Dataset and its collection pipeline combining rule-based filters, LLM judges, and human review to ensure question quality (e.g., well-defined and difficult); (2) UQ-Validators, compound validation strategies that leverage the generator-validator gap to provide evaluation signals and pre-screen candidate solutions for human review; and (3) UQ-Platform, an open platform where experts collectively verify questions and solutions. The top model passes UQ-validation on only 15% of questions, and preliminary human verification has already identified correct answers among those that passed. UQ charts a path for evaluating frontier models on real-world, open-ended challenges, where success pushes the frontier of human knowledge. We release UQ at https://uq.stanford.edu.
MedAgentBench: Dataset for Benchmarking LLMs as Agents in Medical Applications
Jan 24, 2025Recent large language models (LLMs) have demonstrated significant advancements, particularly in their ability to serve as agents thereby surpassing their traditional role as chatbots. These agents can leverage their planning and tool utilization capabilities to address tasks specified at a high level. However, a standardized dataset to benchmark the agent capabilities of LLMs in medical applications is currently lacking, making the evaluation of LLMs on complex tasks in interactive healthcare environments challenging. To address this gap, we introduce MedAgentBench, a broad evaluation suite designed to assess the agent capabilities of large language models within medical records contexts. MedAgentBench encompasses 100 patient-specific clinically-derived tasks from 10 categories written by human physicians, realistic profiles of 100 patients with over 700,000 data elements, a FHIR-compliant interactive environment, and an accompanying codebase. The environment uses the standard APIs and communication infrastructure used in modern EMR systems, so it can be easily migrated into live EMR systems. MedAgentBench presents an unsaturated agent-oriented benchmark that current state-of-the-art LLMs exhibit some ability to succeed at. The best model (GPT-4o) achieves a success rate of 72%. However, there is still substantial space for improvement to give the community a next direction to optimize. Furthermore, there is significant variation in performance across task categories. MedAgentBench establishes this and is publicly available at https://github.com/stanfordmlgroup/MedAgentBench , offering a valuable framework for model developers to track progress and drive continuous improvements in the agent capabilities of large language models within the medical domain.
Many-Shot In-Context Learning in Multimodal Foundation Models
May 16, 2024


Large language models are well-known to be effective at few-shot in-context learning (ICL). Recent advancements in multimodal foundation models have enabled unprecedentedly long context windows, presenting an opportunity to explore their capability to perform ICL with many more demonstrating examples. In this work, we evaluate the performance of multimodal foundation models scaling from few-shot to many-shot ICL. We benchmark GPT-4o and Gemini 1.5 Pro across 10 datasets spanning multiple domains (natural imagery, medical imagery, remote sensing, and molecular imagery) and tasks (multi-class, multi-label, and fine-grained classification). We observe that many-shot ICL, including up to almost 2,000 multimodal demonstrating examples, leads to substantial improvements compared to few-shot (<100 examples) ICL across all of the datasets. Further, Gemini 1.5 Pro performance continues to improve log-linearly up to the maximum number of tested examples on many datasets. Given the high inference costs associated with the long prompts required for many-shot ICL, we also explore the impact of batching multiple queries in a single API call. We show that batching up to 50 queries can lead to performance improvements under zero-shot and many-shot ICL, with substantial gains in the zero-shot setting on multiple datasets, while drastically reducing per-query cost and latency. Finally, we measure ICL data efficiency of the models, or the rate at which the models learn from more demonstrating examples. We find that while GPT-4o and Gemini 1.5 Pro achieve similar zero-shot performance across the datasets, Gemini 1.5 Pro exhibits higher ICL data efficiency than GPT-4o on most datasets. Our results suggest that many-shot ICL could enable users to efficiently adapt multimodal foundation models to new applications and domains. Our codebase is publicly available at https://github.com/stanfordmlgroup/ManyICL .
CloudTracks: A Dataset for Localizing Ship Tracks in Satellite Images of Clouds
Jan 25, 2024Clouds play a significant role in global temperature regulation through their effect on planetary albedo. Anthropogenic emissions of aerosols can alter the albedo of clouds, but the extent of this effect, and its consequent impact on temperature change, remains uncertain. Human-induced clouds caused by ship aerosol emissions, commonly referred to as ship tracks, provide visible manifestations of this effect distinct from adjacent cloud regions and therefore serve as a useful sandbox to study human-induced clouds. However, the lack of large-scale ship track data makes it difficult to deduce their general effects on cloud formation. Towards developing automated approaches to localize ship tracks at scale, we present CloudTracks, a dataset containing 3,560 satellite images labeled with more than 12,000 ship track instance annotations. We train semantic segmentation and instance segmentation model baselines on our dataset and find that our best model substantially outperforms previous state-of-the-art for ship track localization (61.29 vs. 48.65 IoU). We also find that the best instance segmentation model is able to identify the number of ship tracks in each image more accurately than the previous state-of-the-art (1.64 vs. 4.99 MAE). However, we identify cases where the best model struggles to accurately localize and count ship tracks, so we believe CloudTracks will stimulate novel machine learning approaches to better detect elongated and overlapping features in satellite images. We release our dataset openly at {zenodo.org/records/10042922}.
USat: A Unified Self-Supervised Encoder for Multi-Sensor Satellite Imagery
Dec 02, 2023


Large, self-supervised vision models have led to substantial advancements for automatically interpreting natural images. Recent works have begun tailoring these methods to remote sensing data which has rich structure with multi-sensor, multi-spectral, and temporal information providing massive amounts of self-labeled data that can be used for self-supervised pre-training. In this work, we develop a new encoder architecture called USat that can input multi-spectral data from multiple sensors for self-supervised pre-training. USat is a vision transformer with modified patch projection layers and positional encodings to model spectral bands with varying spatial scales from multiple sensors. We integrate USat into a Masked Autoencoder (MAE) self-supervised pre-training procedure and find that a pre-trained USat outperforms state-of-the-art self-supervised MAE models trained on remote sensing data on multiple remote sensing benchmark datasets (up to 8%) and leads to improvements in low data regimes (up to 7%). Code and pre-trained weights are available at https://github.com/stanfordmlgroup/USat .
An Empirical Study of Automated Mislabel Detection in Real World Vision Datasets
Dec 02, 2023Major advancements in computer vision can primarily be attributed to the use of labeled datasets. However, acquiring labels for datasets often results in errors which can harm model performance. Recent works have proposed methods to automatically identify mislabeled images, but developing strategies to effectively implement them in real world datasets has been sparsely explored. Towards improved data-centric methods for cleaning real world vision datasets, we first conduct more than 200 experiments carefully benchmarking recently developed automated mislabel detection methods on multiple datasets under a variety of synthetic and real noise settings with varying noise levels. We compare these methods to a Simple and Efficient Mislabel Detector (SEMD) that we craft, and find that SEMD performs similarly to or outperforms prior mislabel detection approaches. We then apply SEMD to multiple real world computer vision datasets and test how dataset size, mislabel removal strategy, and mislabel removal amount further affect model performance after retraining on the cleaned data. With careful design of the approach, we find that mislabel removal leads per-class performance improvements of up to 8% of a retrained classifier in smaller data regimes.
Weakly-semi-supervised object detection in remotely sensed imagery
Nov 29, 2023


Deep learning for detecting objects in remotely sensed imagery can enable new technologies for important applications including mitigating climate change. However, these models often require large datasets labeled with bounding box annotations which are expensive to curate, prohibiting the development of models for new tasks and geographies. To address this challenge, we develop weakly-semi-supervised object detection (WSSOD) models on remotely sensed imagery which can leverage a small amount of bounding boxes together with a large amount of point labels that are easy to acquire at scale in geospatial data. We train WSSOD models which use large amounts of point-labeled images with varying fractions of bounding box labeled images in FAIR1M and a wind turbine detection dataset, and demonstrate that they substantially outperform fully supervised models trained with the same amount of bounding box labeled images on both datasets. Furthermore, we find that the WSSOD models trained with 2-10x fewer bounding box labeled images can perform similarly to or outperform fully supervised models trained on the full set of bounding-box labeled images. We believe that the approach can be extended to other remote sensing tasks to reduce reliance on bounding box labels and increase development of models for impactful applications.
Detecting Neighborhood Gentrification at Scale via Street-level Visual Data
Jan 04, 2023


Neighborhood gentrification plays a significant role in shaping the social and economic well-being of both individuals and communities at large. While some efforts have been made to detect gentrification in cities, existing approaches rely mainly on estimated measures from survey data, require substantial work of human labeling, and are limited in characterizing the neighborhood as a whole. We propose a novel approach to detecting neighborhood gentrification at a large-scale based on the physical appearance of neighborhoods by incorporating historical street-level visual data. We show the effectiveness of the proposed method by comparing results from our approach with gentrification measures from previous literature and case studies. Our approach has the potential to supplement existing indicators of gentrification and become a valid resource for urban researchers and policy makers.
Improving debris flow evacuation alerts in Taiwan using machine learning
Aug 27, 2022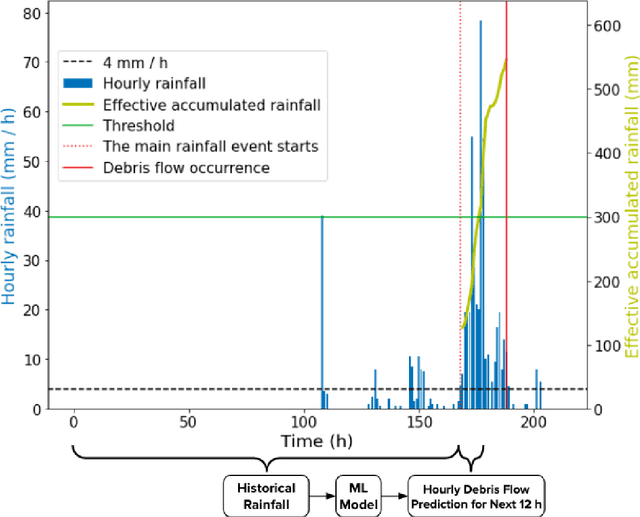
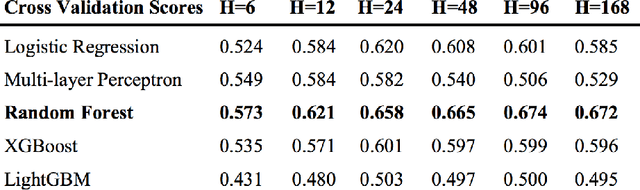
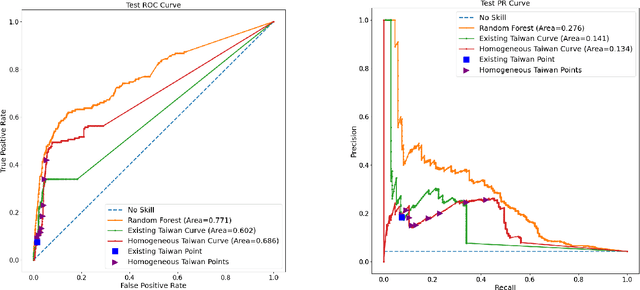
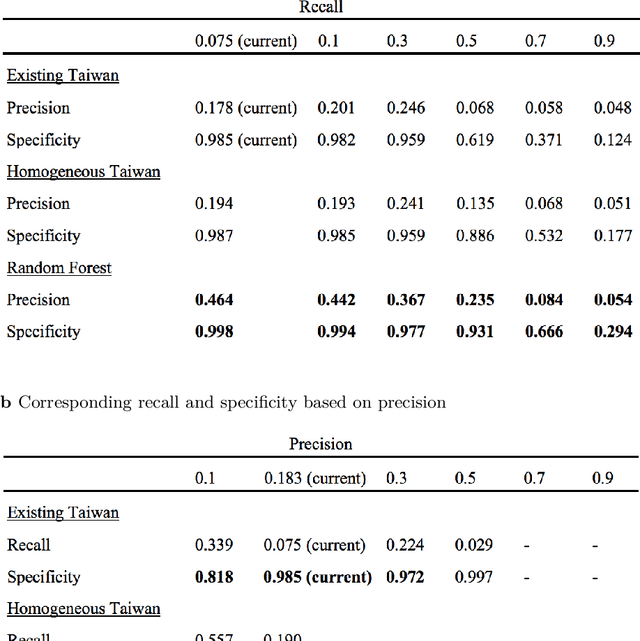
Taiwan has the highest susceptibility to and fatalities from debris flows worldwide. The existing debris flow warning system in Taiwan, which uses a time-weighted measure of rainfall, leads to alerts when the measure exceeds a predefined threshold. However, this system generates many false alarms and misses a substantial fraction of the actual debris flows. Towards improving this system, we implemented five machine learning models that input historical rainfall data and predict whether a debris flow will occur within a selected time. We found that a random forest model performed the best among the five models and outperformed the existing system in Taiwan. Furthermore, we identified the rainfall trajectories strongly related to debris flow occurrences and explored trade-offs between the risks of missing debris flows versus frequent false alerts. These results suggest the potential for machine learning models trained on hourly rainfall data alone to save lives while reducing false alerts.
METER-ML: A Multi-sensor Earth Observation Benchmark for Automated Methane Source Mapping
Jul 22, 2022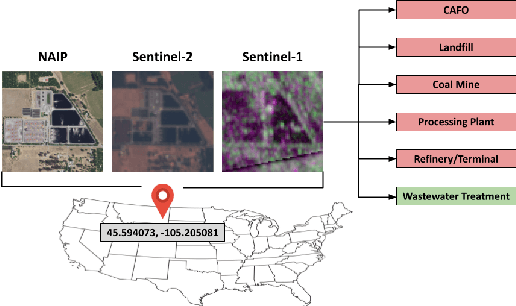
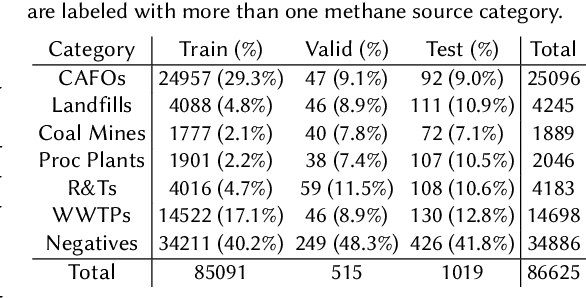
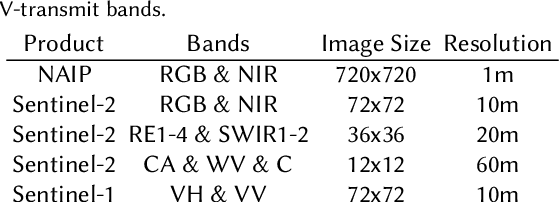
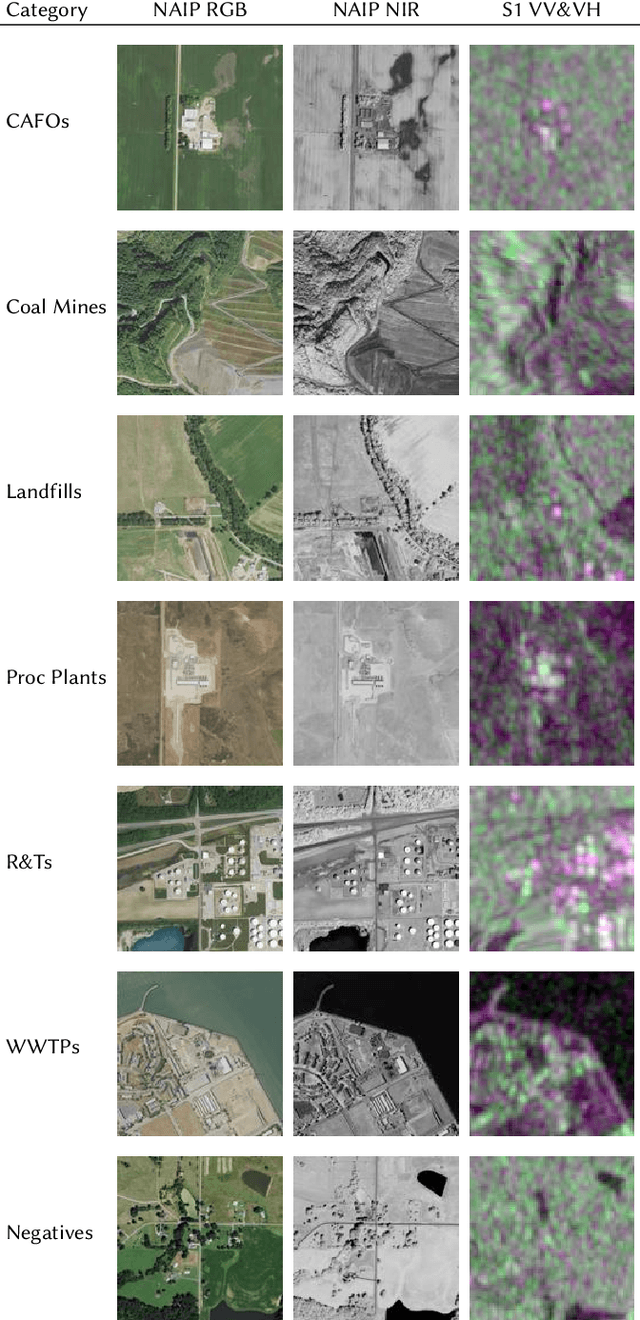
Reducing methane emissions is essential for mitigating global warming. To attribute methane emissions to their sources, a comprehensive dataset of methane source infrastructure is necessary. Recent advancements with deep learning on remotely sensed imagery have the potential to identify the locations and characteristics of methane sources, but there is a substantial lack of publicly available data to enable machine learning researchers and practitioners to build automated mapping approaches. To help fill this gap, we construct a multi-sensor dataset called METER-ML containing 86,625 georeferenced NAIP, Sentinel-1, and Sentinel-2 images in the U.S. labeled for the presence or absence of methane source facilities including concentrated animal feeding operations, coal mines, landfills, natural gas processing plants, oil refineries and petroleum terminals, and wastewater treatment plants. We experiment with a variety of models that leverage different spatial resolutions, spatial footprints, image products, and spectral bands. We find that our best model achieves an area under the precision recall curve of 0.915 for identifying concentrated animal feeding operations and 0.821 for oil refineries and petroleum terminals on an expert-labeled test set, suggesting the potential for large-scale mapping. We make METER-ML freely available at https://stanfordmlgroup.github.io/projects/meter-ml/ to support future work on automated methane source mapping.