 Add to Chrome
 Add to Firefox
 Add to Edge
Embedding Atlas: Low-Friction, Interactive Embedding Visualization
May 09, 2025


Embedding projections are popular for visualizing large datasets and models. However, people often encounter "friction" when using embedding visualization tools: (1) barriers to adoption, e.g., tedious data wrangling and loading, scalability limits, no integration of results into existing workflows, and (2) limitations in possible analyses, without integration with external tools to additionally show coordinated views of metadata. In this paper, we present Embedding Atlas, a scalable, interactive visualization tool designed to make interacting with large embeddings as easy as possible. Embedding Atlas uses modern web technologies and advanced algorithms -- including density-based clustering, and automated labeling -- to provide a fast and rich data analysis experience at scale. We evaluate Embedding Atlas with a competitive analysis against other popular embedding tools, showing that Embedding Atlas's feature set specifically helps reduce friction, and report a benchmark on its real-time rendering performance with millions of points. Embedding Atlas is available as open source to support future work in embedding-based analysis.
A Scalable Approach to Clustering Embedding Projections
Apr 09, 2025Interactive visualization of embedding projections is a useful technique for understanding data and evaluating machine learning models. Labeling data within these visualizations is critical for interpretation, as labels provide an overview of the projection and guide user navigation. However, most methods for producing labels require clustering the points, which can be computationally expensive as the number of points grows. In this paper, we describe an efficient clustering approach using kernel density estimation in the projected 2D space instead of points. This algorithm can produce high-quality cluster regions from a 2D density map in a few hundred milliseconds, orders of magnitude faster than current approaches. We contribute the design of the algorithm, benchmarks, and applications that demonstrate the utility of the algorithm, including labeling and summarization.
Exploring Empty Spaces: Human-in-the-Loop Data Augmentation
Oct 01, 2024


Data augmentation is crucial to make machine learning models more robust and safe. However, augmenting data can be challenging as it requires generating diverse data points to rigorously evaluate model behavior on edge cases and mitigate potential harms. Creating high-quality augmentations that cover these "unknown unknowns" is a time- and creativity-intensive task. In this work, we introduce Amplio, an interactive tool to help practitioners navigate "unknown unknowns" in unstructured text datasets and improve data diversity by systematically identifying empty data spaces to explore. Amplio includes three human-in-the-loop data augmentation techniques: Augment With Concepts, Augment by Interpolation, and Augment with Large Language Model. In a user study with 18 professional red teamers, we demonstrate the utility of our augmentation methods in helping generate high-quality, diverse, and relevant model safety prompts. We find that Amplio enabled red teamers to augment data quickly and creatively, highlighting the transformative potential of interactive augmentation workflows.
AI Policy Projector: Grounding LLM Policy Design in Iterative Mapmaking
Sep 26, 2024Whether a large language model policy is an explicit constitution or an implicit reward model, it is challenging to assess coverage over the unbounded set of real-world situations that a policy must contend with. We introduce an AI policy design process inspired by mapmaking, which has developed tactics for visualizing and iterating on maps even when full coverage is not possible. With Policy Projector, policy designers can survey the landscape of model input-output pairs, define custom regions (e.g., "violence"), and navigate these regions with rules that can be applied to LLM outputs (e.g., if output contains "violence" and "graphic details," then rewrite without "graphic details"). Policy Projector supports interactive policy authoring using LLM classification and steering and a map visualization reflecting the policy designer's work. In an evaluation with 12 AI safety experts, our system helps policy designers to address problematic model behaviors extending beyond an existing, comprehensive harm taxonomy.
Compress and Compare: Interactively Evaluating Efficiency and Behavior Across ML Model Compression Experiments
Aug 06, 2024To deploy machine learning models on-device, practitioners use compression algorithms to shrink and speed up models while maintaining their high-quality output. A critical aspect of compression in practice is model comparison, including tracking many compression experiments, identifying subtle changes in model behavior, and negotiating complex accuracy-efficiency trade-offs. However, existing compression tools poorly support comparison, leading to tedious and, sometimes, incomplete analyses spread across disjoint tools. To support real-world comparative workflows, we develop an interactive visual system called Compress and Compare. Within a single interface, Compress and Compare surfaces promising compression strategies by visualizing provenance relationships between compressed models and reveals compression-induced behavior changes by comparing models' predictions, weights, and activations. We demonstrate how Compress and Compare supports common compression analysis tasks through two case studies, debugging failed compression on generative language models and identifying compression artifacts in image classification models. We further evaluate Compress and Compare in a user study with eight compression experts, illustrating its potential to provide structure to compression workflows, help practitioners build intuition about compression, and encourage thorough analysis of compression's effect on model behavior. Through these evaluations, we identify compression-specific challenges that future visual analytics tools should consider and Compress and Compare visualizations that may generalize to broader model comparison tasks.
Apple Intelligence Foundation Language Models
Jul 29, 2024


We present foundation language models developed to power Apple Intelligence features, including a ~3 billion parameter model designed to run efficiently on devices and a large server-based language model designed for Private Cloud Compute. These models are designed to perform a wide range of tasks efficiently, accurately, and responsibly. This report describes the model architecture, the data used to train the model, the training process, how the models are optimized for inference, and the evaluation results. We highlight our focus on Responsible AI and how the principles are applied throughout the model development.
BISCUIT: Scaffolding LLM-Generated Code with Ephemeral UIs in Computational Notebooks
Apr 12, 2024


Novices frequently engage with machine learning tutorials in computational notebooks and have been adopting code generation technologies based on large language models (LLMs). However, they encounter difficulties in understanding and working with code produced by LLMs. To mitigate these challenges, we introduce a novel workflow into computational notebooks that augments LLM-based code generation with an additional ephemeral UI step, offering users UI-based scaffolds as an intermediate stage between user prompts and code generation. We present this workflow in BISCUIT, an extension for JupyterLab that provides users with ephemeral UIs generated by LLMs based on the context of their code and intentions, scaffolding users to understand, guide, and explore with LLM-generated code. Through a user study where 10 novices used BISCUIT for machine learning tutorials, we discover that BISCUIT offers user semantic representation of code to aid their understanding, reduces the complexity of prompt engineering, and creates a playground for users to explore different variables and iterate on their ideas. We discuss the implications of our findings for UI-centric interactive paradigm in code generation LLMs.
Talaria: Interactively Optimizing Machine Learning Models for Efficient Inference
Apr 03, 2024


On-device machine learning (ML) moves computation from the cloud to personal devices, protecting user privacy and enabling intelligent user experiences. However, fitting models on devices with limited resources presents a major technical challenge: practitioners need to optimize models and balance hardware metrics such as model size, latency, and power. To help practitioners create efficient ML models, we designed and developed Talaria: a model visualization and optimization system. Talaria enables practitioners to compile models to hardware, interactively visualize model statistics, and simulate optimizations to test the impact on inference metrics. Since its internal deployment two years ago, we have evaluated Talaria using three methodologies: (1) a log analysis highlighting its growth of 800+ practitioners submitting 3,600+ models; (2) a usability survey with 26 users assessing the utility of 20 Talaria features; and (3) a qualitative interview with the 7 most active users about their experience using Talaria.
Model Compression in Practice: Lessons Learned from Practitioners Creating On-device Machine Learning Experiences
Oct 06, 2023


On-device machine learning (ML) promises to improve the privacy, responsiveness, and proliferation of new, intelligent user experiences by moving ML computation onto everyday personal devices. However, today's large ML models must be drastically compressed to run efficiently on-device, a hurtle that requires deep, yet currently niche expertise. To engage the broader human-centered ML community in on-device ML experiences, we present the results from an interview study with 30 experts at Apple that specialize in producing efficient models. We compile tacit knowledge that experts have developed through practical experience with model compression across different hardware platforms. Our findings offer pragmatic considerations missing from prior work, covering the design process, trade-offs, and technical strategies that go into creating efficient models. Finally, we distill design recommendations for tooling to help ease the difficulty of this work and bring on-device ML into to more widespread practice.
WizMap: Scalable Interactive Visualization for Exploring Large Machine Learning Embeddings
Jun 15, 2023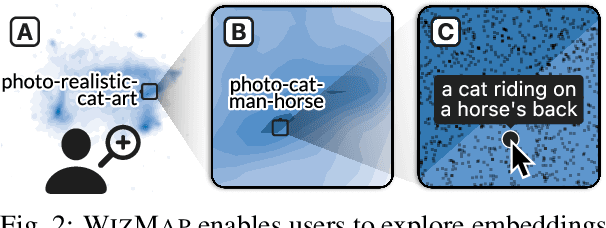
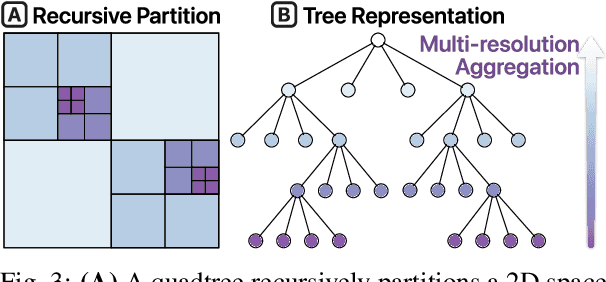
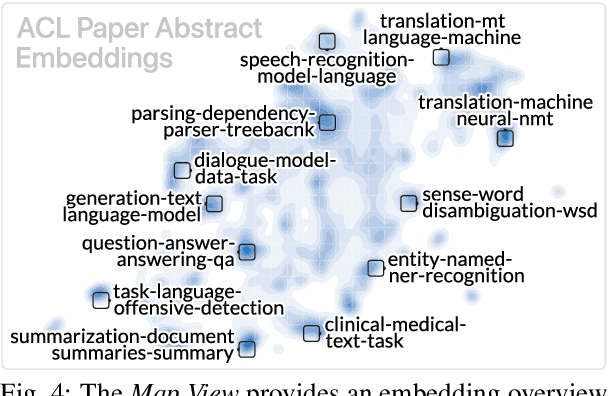
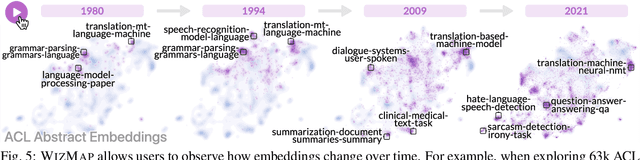
Machine learning models often learn latent embedding representations that capture the domain semantics of their training data. These embedding representations are valuable for interpreting trained models, building new models, and analyzing new datasets. However, interpreting and using embeddings can be challenging due to their opaqueness, high dimensionality, and the large size of modern datasets. To tackle these challenges, we present WizMap, an interactive visualization tool to help researchers and practitioners easily explore large embeddings. With a novel multi-resolution embedding summarization method and a familiar map-like interaction design, WizMap enables users to navigate and interpret embedding spaces with ease. Leveraging modern web technologies such as WebGL and Web Workers, WizMap scales to millions of embedding points directly in users' web browsers and computational notebooks without the need for dedicated backend servers. WizMap is open-source and available at the following public demo link: https://poloclub.github.io/wizmap.