 Add to Chrome
 Add to Firefox
 Add to Edge
Evaluating Large Language Models with fmeval
Jul 15, 2024


fmeval is an open source library to evaluate large language models (LLMs) in a range of tasks. It helps practitioners evaluate their model for task performance and along multiple responsible AI dimensions. This paper presents the library and exposes its underlying design principles: simplicity, coverage, extensibility and performance. We then present how these were implemented in the scientific and engineering choices taken when developing fmeval. A case study demonstrates a typical use case for the library: picking a suitable model for a question answering task. We close by discussing limitations and further work in the development of the library. fmeval can be found at https://github.com/aws/fmeval.
Where is VALDO? VAscular Lesions Detection and segmentatiOn challenge at MICCAI 2021
Aug 15, 2022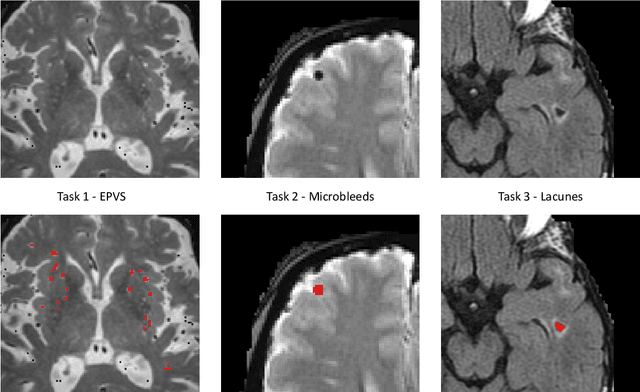
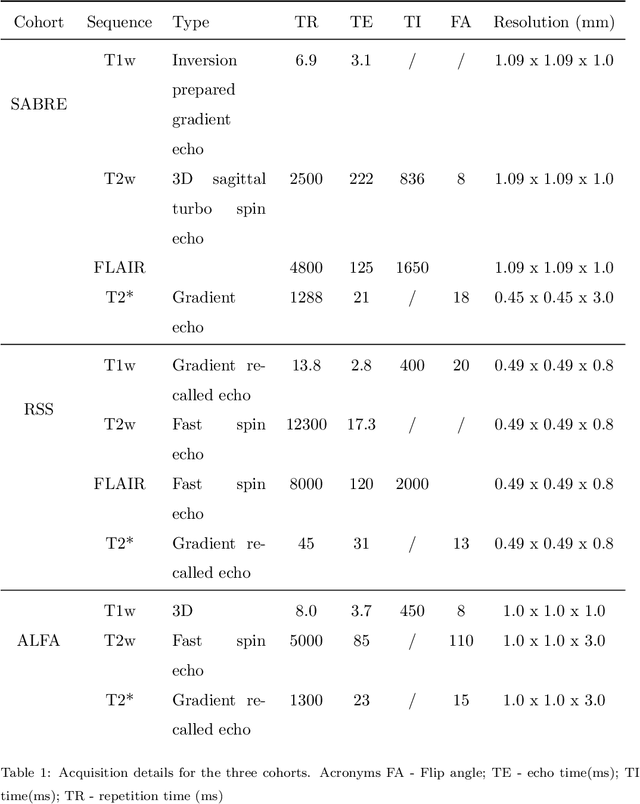

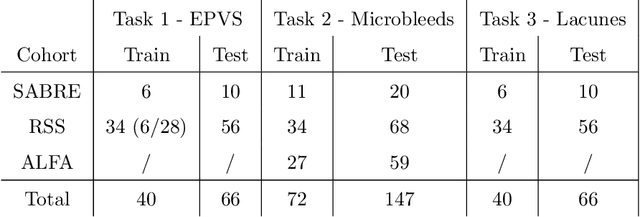
Imaging markers of cerebral small vessel disease provide valuable information on brain health, but their manual assessment is time-consuming and hampered by substantial intra- and interrater variability. Automated rating may benefit biomedical research, as well as clinical assessment, but diagnostic reliability of existing algorithms is unknown. Here, we present the results of the \textit{VAscular Lesions DetectiOn and Segmentation} (\textit{Where is VALDO?}) challenge that was run as a satellite event at the international conference on Medical Image Computing and Computer Aided Intervention (MICCAI) 2021. This challenge aimed to promote the development of methods for automated detection and segmentation of small and sparse imaging markers of cerebral small vessel disease, namely enlarged perivascular spaces (EPVS) (Task 1), cerebral microbleeds (Task 2) and lacunes of presumed vascular origin (Task 3) while leveraging weak and noisy labels. Overall, 12 teams participated in the challenge proposing solutions for one or more tasks (4 for Task 1 - EPVS, 9 for Task 2 - Microbleeds and 6 for Task 3 - Lacunes). Multi-cohort data was used in both training and evaluation. Results showed a large variability in performance both across teams and across tasks, with promising results notably for Task 1 - EPVS and Task 2 - Microbleeds and not practically useful results yet for Task 3 - Lacunes. It also highlighted the performance inconsistency across cases that may deter use at an individual level, while still proving useful at a population level.
Amazon SageMaker Clarify: Machine Learning Bias Detection and Explainability in the Cloud
Sep 07, 2021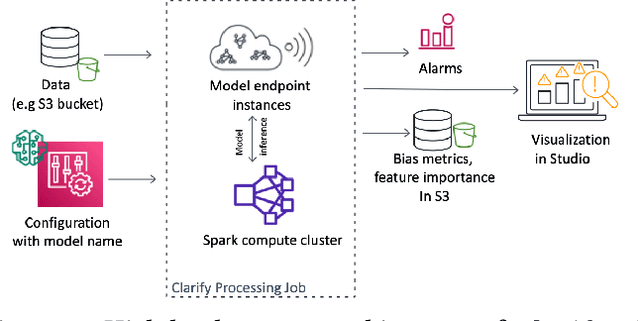
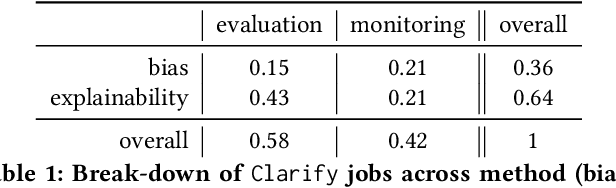
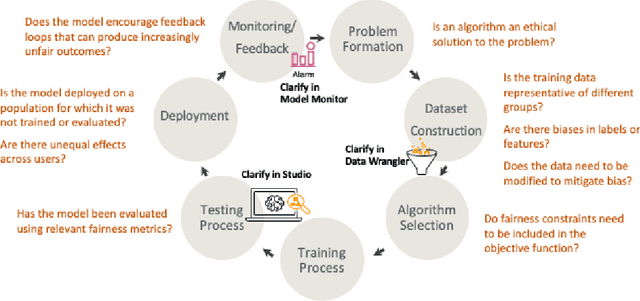
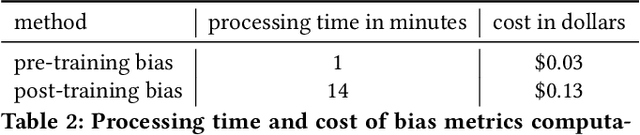
Understanding the predictions made by machine learning (ML) models and their potential biases remains a challenging and labor-intensive task that depends on the application, the dataset, and the specific model. We present Amazon SageMaker Clarify, an explainability feature for Amazon SageMaker that launched in December 2020, providing insights into data and ML models by identifying biases and explaining predictions. It is deeply integrated into Amazon SageMaker, a fully managed service that enables data scientists and developers to build, train, and deploy ML models at any scale. Clarify supports bias detection and feature importance computation across the ML lifecycle, during data preparation, model evaluation, and post-deployment monitoring. We outline the desiderata derived from customer input, the modular architecture, and the methodology for bias and explanation computations. Further, we describe the technical challenges encountered and the tradeoffs we had to make. For illustration, we discuss two customer use cases. We present our deployment results including qualitative customer feedback and a quantitative evaluation. Finally, we summarize lessons learned, and discuss best practices for the successful adoption of fairness and explanation tools in practice.
Automated Lesion Detection by Regressing Intensity-Based Distance with a Neural Network
Jul 29, 2019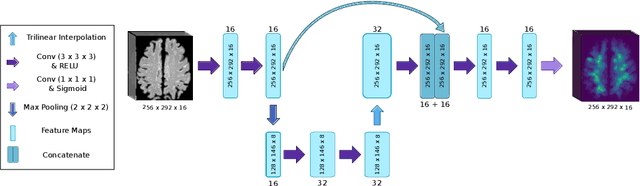
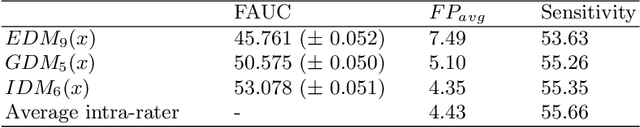
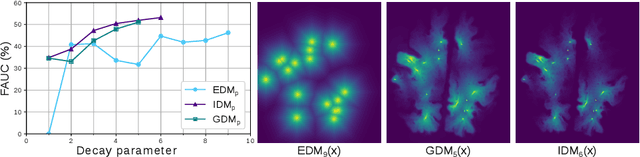
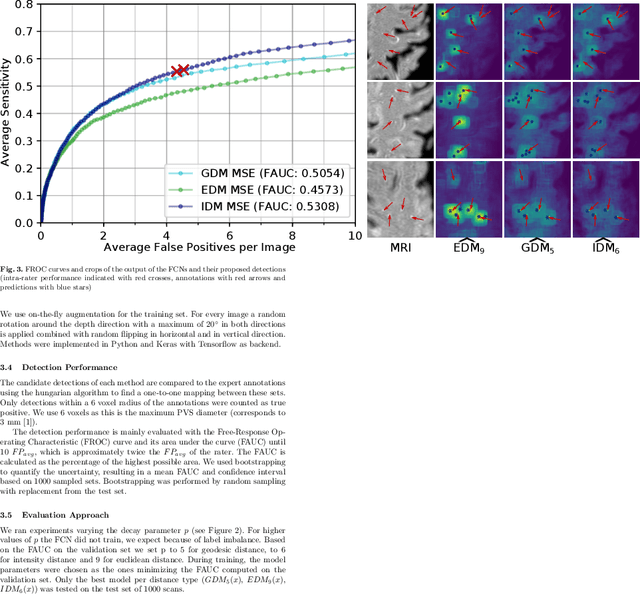
Localization of focal vascular lesions on brain MRI is an important component of research on the etiology of neurological disorders. However, manual annotation of lesions can be challenging, time-consuming and subject to observer bias. Automated detection methods often need voxel-wise annotations for training. We propose a novel approach for automated lesion detection that can be trained on scans only annotated with a dot per lesion instead of a full segmentation. From the dot annotations and their corresponding intensity images we compute various distance maps (DMs), indicating the distance to a lesion based on spatial distance, intensity distance, or both. We train a fully convolutional neural network (FCN) to predict these DMs for unseen intensity images. The local optima in the predicted DMs are expected to correspond to lesion locations. We show the potential of this approach to detect enlarged perivascular spaces in white matter on a large brain MRI dataset with an independent test set of 1000 scans. Our method matches the intra-rater performance of the expert rater that was computed on an independent set. We compare the different types of distance maps, showing that incorporating intensity information in the distance maps used to train an FCN greatly improves performance.
Weakly Supervised Object Detection with 2D and 3D Regression Neural Networks
Jun 14, 2019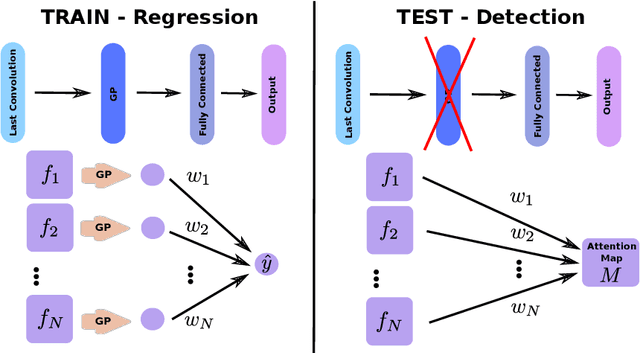
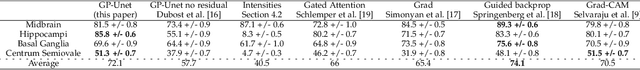
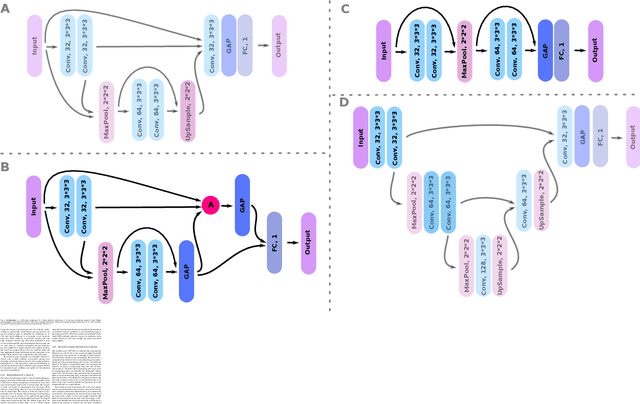
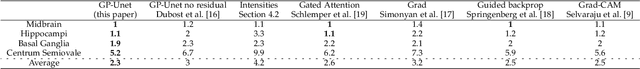
Weakly supervised detection methods can infer the location of target objects in an image without requiring location or appearance information during training. We propose a weakly supervised deep learning method for the detection of objects that appear at multiple locations in an image. The method computes attention maps using the last feature maps of an encoder-decoder network optimized only with global labels: the number of occurrences of the target object in an image. In contrast with previous approaches, attention maps are generated at full input resolution thanks to the decoder part. The proposed approach is compared to multiple state-of-the-art methods in two tasks: the detection of digits in MNIST-based datasets, and the real life application of detection of enlarged perivascular spaces -- a type of brain lesion -- in four brain regions in a dataset of 2202 3D brain MRI scans. In MNIST-based datasets, the proposed method outperforms the other methods. In the brain dataset, several weakly supervised detection methods come close to the human intrarater agreement in each region. The proposed method reaches the lowest number of false positive detections in all brain regions at the operating point, while its average sensitivity is similar to that of the other best methods.