 Add to Chrome
 Add to Firefox
 Add to Edge
TerraFormer: Automated Infrastructure-as-Code with LLMs Fine-Tuned via Policy-Guided Verifier Feedback
Jan 13, 2026Automating Infrastructure-as-Code (IaC) is challenging, and large language models (LLMs) often produce incorrect configurations from natural language (NL). We present TerraFormer, a neuro-symbolic framework for IaC generation and mutation that combines supervised fine-tuning with verifier-guided reinforcement learning, using formal verification tools to provide feedback on syntax, deployability, and policy compliance. We curate two large, high-quality NL-to-IaC datasets, TF-Gen (152k instances) and TF-Mutn (52k instances), via multi-stage verification and iterative LLM self-correction. Evaluations against 17 state-of-the-art LLMs, including ~50x larger models like Sonnet 3.7, DeepSeek-R1, and GPT-4.1, show that TerraFormer improves correctness over its base LLM by 15.94% on IaC-Eval, 11.65% on TF-Gen (Test), and 19.60% on TF-Mutn (Test). It outperforms larger models on both TF-Gen (Test) and TF-Mutn (Test), ranks third on IaC-Eval, and achieves top best-practices and security compliance.
Large Language Model Critics for Execution-Free Evaluation of Code Changes
Jan 28, 2025


Large language models (LLMs) offer a promising way forward for automating software engineering tasks, such as bug fixes, feature additions, etc., via multi-step LLM-based agentic workflows. However, existing metrics for evaluating such workflows, mainly build status and occasionally log analysis, are too sparse and limited in providing the information needed to assess the quality of changes made. In this work, we designed LLM-based critics to derive well-structured and rigorous intermediate/step-level, execution-free evaluation proxies for repo-level code changes. Importantly, we assume access to the gold test patch for the problem (i.e., reference-aware) to assess both semantics and executability of generated patches. With the gold test patch as a reference, we predict executability of all editing locations with an F1 score of 91.6%, aggregating which, we can predict the build status in 84.8% of the instances in SWE-bench. In particular, such an execution-focused LLM critic outperforms other reference-free and reference-aware LLM critics by 38.9% to 72.5%. Moreover, we demonstrate the usefulness of such a reference-aware framework in comparing patches generated by different agentic workflows. Finally, we open-source the library developed for this project, which allows further usage for either other agentic workflows or other benchmarks. The source code is available at https://github.com/amazon-science/code-agent-eval.
REDO: Execution-Free Runtime Error Detection for COding Agents
Oct 10, 2024


As LLM-based agents exhibit exceptional capabilities in addressing complex problems, there is a growing focus on developing coding agents to tackle increasingly sophisticated tasks. Despite their promising performance, these coding agents often produce programs or modifications that contain runtime errors, which can cause code failures and are difficult for static analysis tools to detect. Enhancing the ability of coding agents to statically identify such errors could significantly improve their overall performance. In this work, we introduce Execution-free Runtime Error Detection for COding Agents (REDO), a method that integrates LLMs with static analysis tools to detect runtime errors for coding agents, without code execution. Additionally, we propose a benchmark task, SWE-Bench-Error-Detection (SWEDE), based on SWE-Bench (lite), to evaluate error detection in repository-level problems with complex external dependencies. Finally, through both quantitative and qualitative analyses across various error detection tasks, we demonstrate that REDO outperforms current state-of-the-art methods by achieving a 11.0% higher accuracy and 9.1% higher weighted F1 score; and provide insights into the advantages of incorporating LLMs for error detection.
Automated Evaluation of Retrieval-Augmented Language Models with Task-Specific Exam Generation
May 22, 2024


We propose a new method to measure the task-specific accuracy of Retrieval-Augmented Large Language Models (RAG). Evaluation is performed by scoring the RAG on an automatically-generated synthetic exam composed of multiple choice questions based on the corpus of documents associated with the task. Our method is an automated, cost-efficient, interpretable, and robust strategy to select the optimal components for a RAG system. We leverage Item Response Theory (IRT) to estimate the quality of an exam and its informativeness on task-specific accuracy. IRT also provides a natural way to iteratively improve the exam by eliminating the exam questions that are not sufficiently informative about a model's ability. We demonstrate our approach on four new open-ended Question-Answering tasks based on Arxiv abstracts, StackExchange questions, AWS DevOps troubleshooting guides, and SEC filings. In addition, our experiments reveal more general insights into factors impacting RAG performance like size, retrieval mechanism, prompting and fine-tuning. Most notably, our findings show that choosing the right retrieval algorithms often leads to bigger performance gains than simply using a larger language model.
MELODY: Robust Semi-Supervised Hybrid Model for Entity-Level Online Anomaly Detection with Multivariate Time Series
Jan 18, 2024


In large IT systems, software deployment is a crucial process in online services as their code is regularly updated. However, a faulty code change may degrade the target service's performance and cause cascading outages in downstream services. Thus, software deployments should be comprehensively monitored, and their anomalies should be detected timely. In this paper, we study the problem of anomaly detection for deployments. We begin by identifying the challenges unique to this anomaly detection problem, which is at entity-level (e.g., deployments), relative to the more typical problem of anomaly detection in multivariate time series (MTS). The unique challenges include the heterogeneity of deployments, the low latency tolerance, the ambiguous anomaly definition, and the limited supervision. To address them, we propose a novel framework, semi-supervised hybrid Model for Entity-Level Online Detection of anomalY (MELODY). MELODY first transforms the MTS of different entities to the same feature space by an online feature extractor, then uses a newly proposed semi-supervised deep one-class model for detecting anomalous entities. We evaluated MELODY on real data of cloud services with 1.2M+ time series. The relative F1 score improvement of MELODY over the state-of-the-art methods ranges from 7.6% to 56.5%. The user evaluation suggests MELODY is suitable for monitoring deployments in large online systems.
Criteria for Classifying Forecasting Methods
Dec 07, 2022


Classifying forecasting methods as being either of a "machine learning" or "statistical" nature has become commonplace in parts of the forecasting literature and community, as exemplified by the M4 competition and the conclusion drawn by the organizers. We argue that this distinction does not stem from fundamental differences in the methods assigned to either class. Instead, this distinction is probably of a tribal nature, which limits the insights into the appropriateness and effectiveness of different forecasting methods. We provide alternative characteristics of forecasting methods which, in our view, allow to draw meaningful conclusions. Further, we discuss areas of forecasting which could benefit most from cross-pollination between the ML and the statistics communities.
SpectraNet: Multivariate Forecasting and Imputation under Distribution Shifts and Missing Data
Oct 25, 2022


In this work, we tackle two widespread challenges in real applications for time-series forecasting that have been largely understudied: distribution shifts and missing data. We propose SpectraNet, a novel multivariate time-series forecasting model that dynamically infers a latent space spectral decomposition to capture current temporal dynamics and correlations on the recent observed history. A Convolution Neural Network maps the learned representation by sequentially mixing its components and refining the output. Our proposed approach can simultaneously produce forecasts and interpolate past observations and can, therefore, greatly simplify production systems by unifying imputation and forecasting tasks into a single model. SpectraNet achieves SoTA performance simultaneously on both tasks on five benchmark datasets, compared to forecasting and imputation models, with up to 92% fewer parameters and comparable training times. On settings with up to 80% missing data, SpectraNet has average performance improvements of almost 50% over the second-best alternative. Our code is available at https://github.com/cchallu/spectranet.
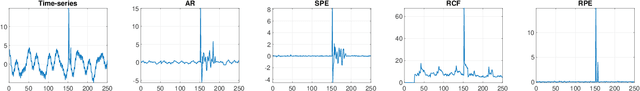
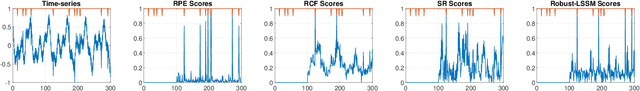
Unsupervised Model Selection for Time-series Anomaly Detection
Oct 03, 2022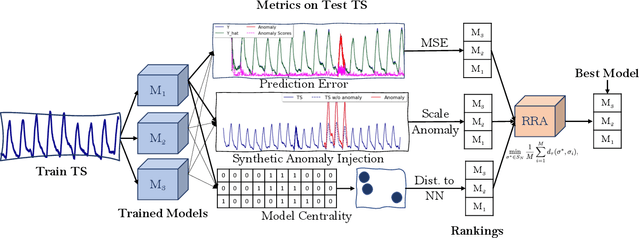
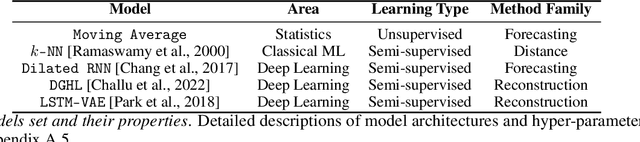
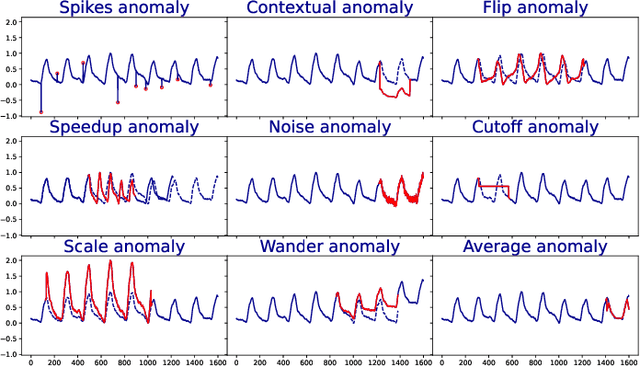
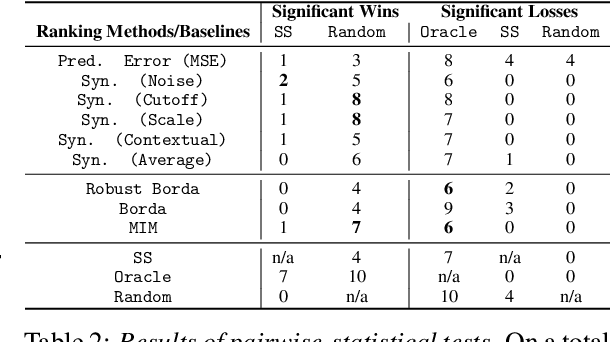
Anomaly detection in time-series has a wide range of practical applications. While numerous anomaly detection methods have been proposed in the literature, a recent survey concluded that no single method is the most accurate across various datasets. To make matters worse, anomaly labels are scarce and rarely available in practice. The practical problem of selecting the most accurate model for a given dataset without labels has received little attention in the literature. This paper answers this question i.e. Given an unlabeled dataset and a set of candidate anomaly detectors, how can we select the most accurate model? To this end, we identify three classes of surrogate (unsupervised) metrics, namely, prediction error, model centrality, and performance on injected synthetic anomalies, and show that some metrics are highly correlated with standard supervised anomaly detection performance metrics such as the $F_1$ score, but to varying degrees. We formulate metric combination with multiple imperfect surrogate metrics as a robust rank aggregation problem. We then provide theoretical justification behind the proposed approach. Large-scale experiments on multiple real-world datasets demonstrate that our proposed unsupervised approach is as effective as selecting the most accurate model based on partially labeled data.
Robust Projection based Anomaly Extraction (RPE) in Univariate Time-Series
May 31, 2022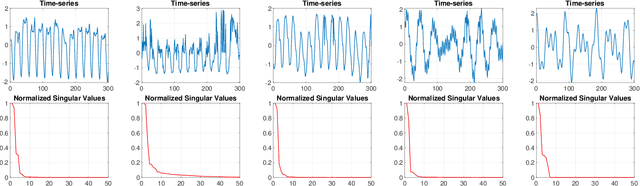
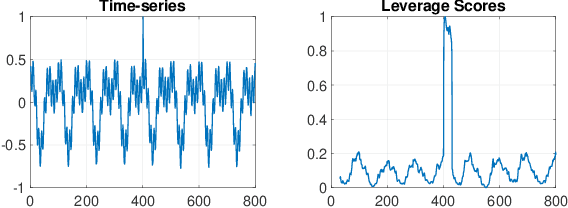
This paper presents a novel, closed-form, and data/computation efficient online anomaly detection algorithm for time-series data. The proposed method, dubbed RPE, is a window-based method and in sharp contrast to the existing window-based methods, it is robust to the presence of anomalies in its window and it can distinguish the anomalies in time-stamp level. RPE leverages the linear structure of the trajectory matrix of the time-series and employs a robust projection step which makes the algorithm able to handle the presence of multiple arbitrarily large anomalies in its window. A closed-form/non-iterative algorithm for the robust projection step is provided and it is proved that it can identify the corrupted time-stamps. RPE is a great candidate for the applications where a large training data is not available which is the common scenario in the area of time-series. An extensive set of numerical experiments show that RPE can outperform the existing approaches with a notable margin.
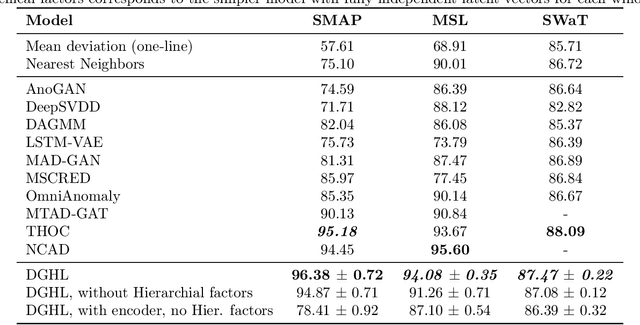
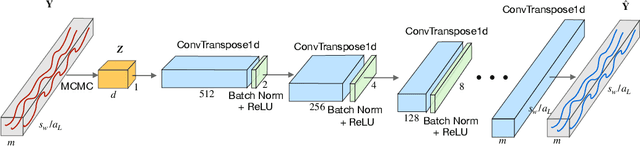
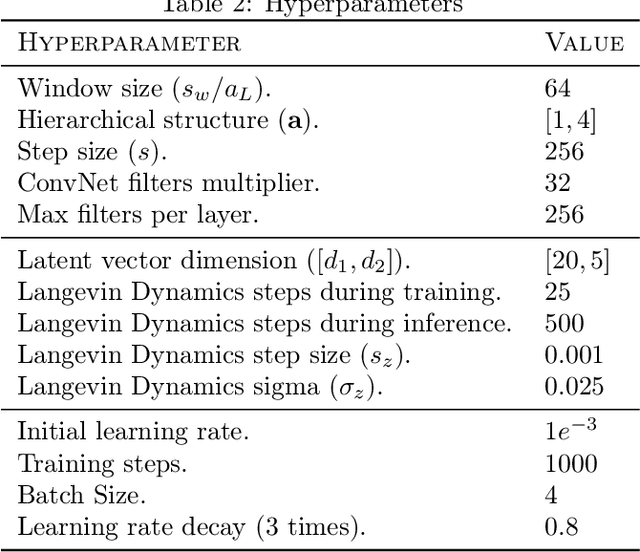
Deep Generative model with Hierarchical Latent Factors for Time Series Anomaly Detection
Feb 25, 2022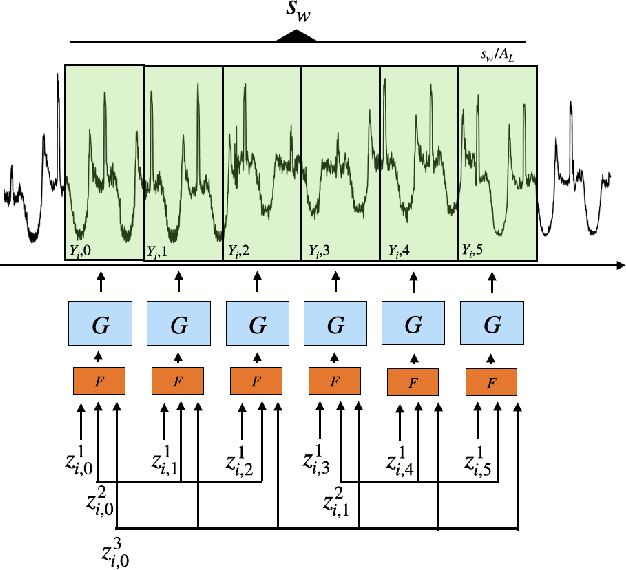
Multivariate time series anomaly detection has become an active area of research in recent years, with Deep Learning models outperforming previous approaches on benchmark datasets. Among reconstruction-based models, most previous work has focused on Variational Autoencoders and Generative Adversarial Networks. This work presents DGHL, a new family of generative models for time series anomaly detection, trained by maximizing the observed likelihood by posterior sampling and alternating back-propagation. A top-down Convolution Network maps a novel hierarchical latent space to time series windows, exploiting temporal dynamics to encode information efficiently. Despite relying on posterior sampling, it is computationally more efficient than current approaches, with up to 10x shorter training times than RNN based models. Our method outperformed current state-of-the-art models on four popular benchmark datasets. Finally, DGHL is robust to variable features between entities and accurate even with large proportions of missing values, settings with increasing relevance with the advent of IoT. We demonstrate the superior robustness of DGHL with novel occlusion experiments in this literature. Our code is available at https://github.com/cchallu/dghl.