 Add to Chrome
 Add to Firefox
 Add to Edge
High-Frequency Pricing at Scale for E-Commerce
Jun 11, 2026This paper presents the design, development, and implementation of a specialized forecast-then-optimize algorithmic pricing tool for sales campaigns in fashion e-commerce. Sales events present unique challenges for pricing including volatile demand patterns, rapid pricing decisions, and the need to balance short-term revenue with long-term profitability. We describe our approach combining daily-resolution demand forecasting using gradient-boosted trees with a multi-objective optimization framework that maximizes both long-term profit and net merchandise value for more than 5 million articles. Our solution addresses key limitations of existing weekly-granularity systems by implementing a forecast-then-optimize architecture that reduces pricing decision time from hours to minutes. We validate our approach through 23 A/B tests across 12 markets during 2023-2024 sales campaigns at Zalando, one of Europe's leading online fashion retailers. Experimental results demonstrate that the new pricing system achieves approximately 6% higher profit while maintaining equivalent performance on sales and revenue compared to the previous manual-algorithmic hybrid approach. Based on these results, the algorithm was successfully deployed to production and now handles the majority of algorithmic pricing decisions for sales campaigns at the company.
Causal Forecasting for Pricing
Dec 23, 2023This paper proposes a novel method for demand forecasting in a pricing context. Here, modeling the causal relationship between price as an input variable to demand is crucial because retailers aim to set prices in a (profit) optimal manner in a downstream decision making problem. Our methods bring together the Double Machine Learning methodology for causal inference and state-of-the-art transformer-based forecasting models. In extensive empirical experiments, we show on the one hand that our method estimates the causal effect better in a fully controlled setting via synthetic, yet realistic data. On the other hand, we demonstrate on real-world data that our method outperforms forecasting methods in off-policy settings (i.e., when there's a change in the pricing policy) while only slightly trailing in the on-policy setting.
Deep Non-Parametric Time Series Forecaster
Dec 22, 2023


This paper presents non-parametric baseline models for time series forecasting. Unlike classical forecasting models, the proposed approach does not assume any parametric form for the predictive distribution and instead generates predictions by sampling from the empirical distribution according to a tunable strategy. By virtue of this, the model is always able to produce reasonable forecasts (i.e., predictions within the observed data range) without fail unlike classical models that suffer from numerical stability on some data distributions. Moreover, we develop a global version of the proposed method that automatically learns the sampling strategy by exploiting the information across multiple related time series. The empirical evaluation shows that the proposed methods have reasonable and consistent performance across all datasets, proving them to be strong baselines to be considered in one's forecasting toolbox.
Deep Learning based Forecasting: a case study from the online fashion industry
May 23, 2023Demand forecasting in the online fashion industry is particularly amendable to global, data-driven forecasting models because of the industry's set of particular challenges. These include the volume of data, the irregularity, the high amount of turn-over in the catalog and the fixed inventory assumption. While standard deep learning forecasting approaches cater for many of these, the fixed inventory assumption requires a special treatment via controlling the relationship between price and demand closely. In this case study, we describe the data and our modelling approach for this forecasting problem in detail and present empirical results that highlight the effectiveness of our approach.
Criteria for Classifying Forecasting Methods
Dec 07, 2022


Classifying forecasting methods as being either of a "machine learning" or "statistical" nature has become commonplace in parts of the forecasting literature and community, as exemplified by the M4 competition and the conclusion drawn by the organizers. We argue that this distinction does not stem from fundamental differences in the methods assigned to either class. Instead, this distinction is probably of a tribal nature, which limits the insights into the appropriateness and effectiveness of different forecasting methods. We provide alternative characteristics of forecasting methods which, in our view, allow to draw meaningful conclusions. Further, we discuss areas of forecasting which could benefit most from cross-pollination between the ML and the statistics communities.
On the detrimental effect of invariances in the likelihood for variational inference
Sep 15, 2022


Variational Bayesian posterior inference often requires simplifying approximations such as mean-field parametrisation to ensure tractability. However, prior work has associated the variational mean-field approximation for Bayesian neural networks with underfitting in the case of small datasets or large model sizes. In this work, we show that invariances in the likelihood function of over-parametrised models contribute to this phenomenon because these invariances complicate the structure of the posterior by introducing discrete and/or continuous modes which cannot be well approximated by Gaussian mean-field distributions. In particular, we show that the mean-field approximation has an additional gap in the evidence lower bound compared to a purpose-built posterior that takes into account the known invariances. Importantly, this invariance gap is not constant; it vanishes as the approximation reverts to the prior. We proceed by first considering translation invariances in a linear model with a single data point in detail. We show that, while the true posterior can be constructed from a mean-field parametrisation, this is achieved only if the objective function takes into account the invariance gap. Then, we transfer our analysis of the linear model to neural networks. Our analysis provides a framework for future work to explore solutions to the invariance problem.
Intrinsic Anomaly Detection for Multi-Variate Time Series
Jun 29, 2022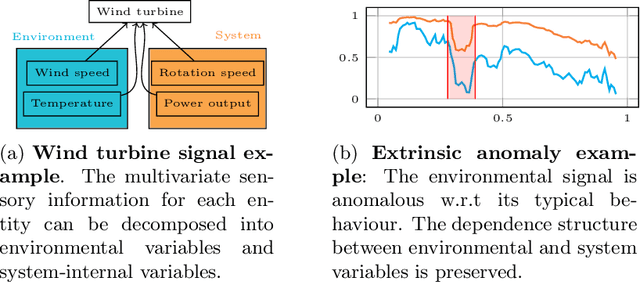
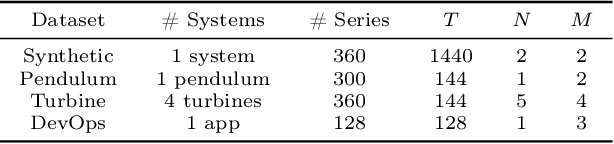
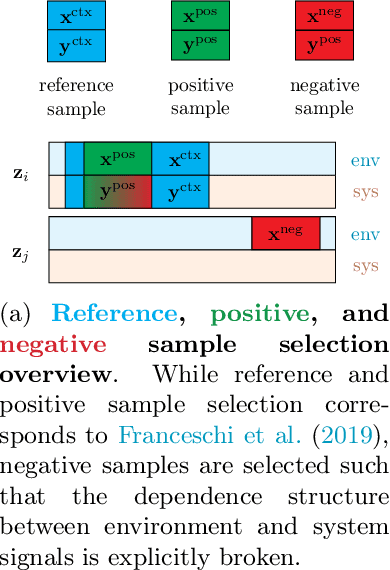
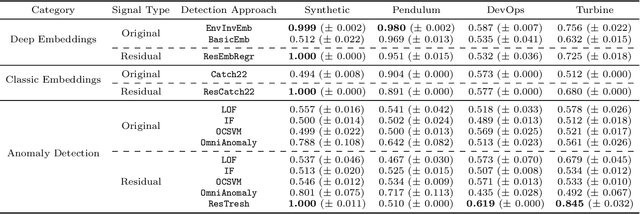
We introduce a novel, practically relevant variation of the anomaly detection problem in multi-variate time series: intrinsic anomaly detection. It appears in diverse practical scenarios ranging from DevOps to IoT, where we want to recognize failures of a system that operates under the influence of a surrounding environment. Intrinsic anomalies are changes in the functional dependency structure between time series that represent an environment and time series that represent the internal state of a system that is placed in said environment. We formalize this problem, provide under-studied public and new purpose-built data sets for it, and present methods that handle intrinsic anomaly detection. These address the short-coming of existing anomaly detection methods that cannot differentiate between expected changes in the system's state and unexpected ones, i.e., changes in the system that deviate from the environment's influence. Our most promising approach is fully unsupervised and combines adversarial learning and time series representation learning, thereby addressing problems such as label sparsity and subjectivity, while allowing to navigate and improve notoriously problematic anomaly detection data sets.
Diverse Counterfactual Explanations for Anomaly Detection in Time Series
Mar 21, 2022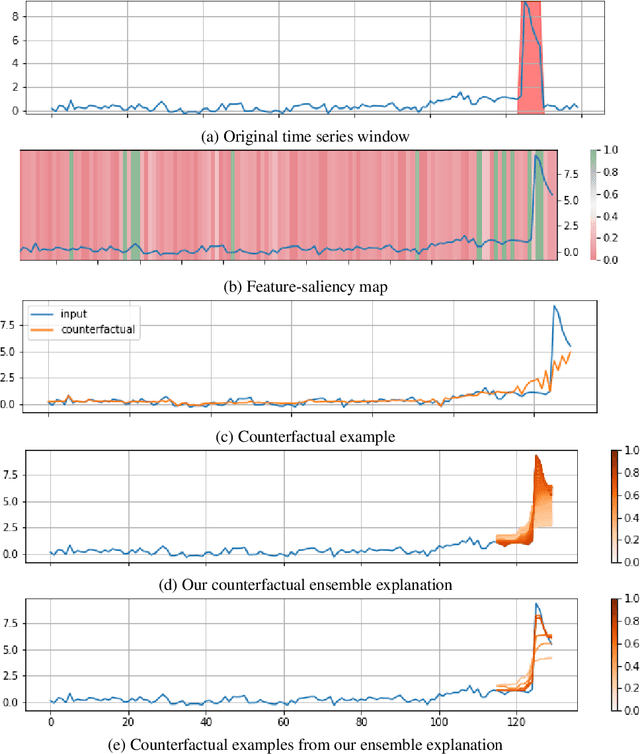
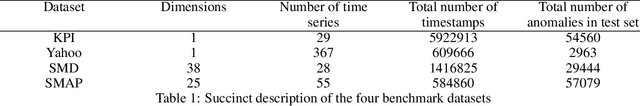
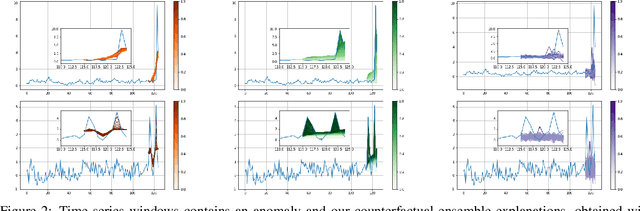
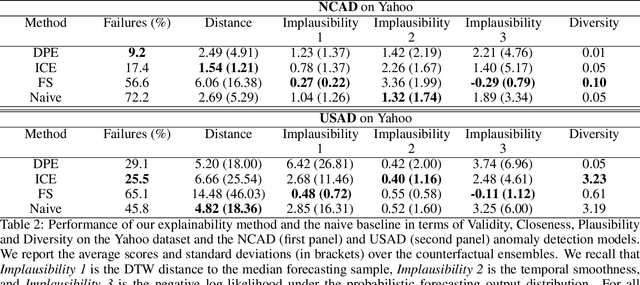
Data-driven methods that detect anomalies in times series data are ubiquitous in practice, but they are in general unable to provide helpful explanations for the predictions they make. In this work we propose a model-agnostic algorithm that generates counterfactual ensemble explanations for time series anomaly detection models. Our method generates a set of diverse counterfactual examples, i.e, multiple perturbed versions of the original time series that are not considered anomalous by the detection model. Since the magnitude of the perturbations is limited, these counterfactuals represent an ensemble of inputs similar to the original time series that the model would deem normal. Our algorithm is applicable to any differentiable anomaly detection model. We investigate the value of our method on univariate and multivariate real-world datasets and two deep-learning-based anomaly detection models, under several explainability criteria previously proposed in other data domains such as Validity, Plausibility, Closeness and Diversity. We show that our algorithm can produce ensembles of counterfactual examples that satisfy these criteria and thanks to a novel type of visualisation, can convey a richer interpretation of a model's internal mechanism than existing methods. Moreover, we design a sparse variant of our method to improve the interpretability of counterfactual explanations for high-dimensional time series anomalies. In this setting, our explanation is localised on only a few dimensions and can therefore be communicated more efficiently to the model's user.
Resilient Neural Forecasting Systems
Mar 16, 2022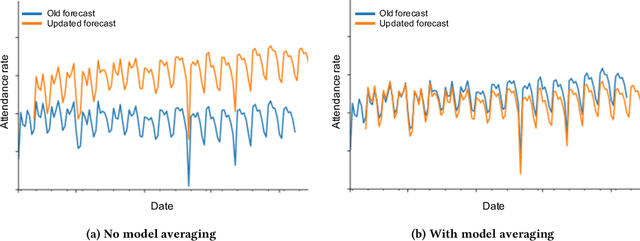
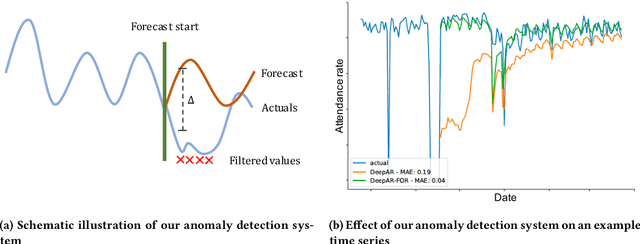
Industrial machine learning systems face data challenges that are often under-explored in the academic literature. Common data challenges are data distribution shifts, missing values and anomalies. In this paper, we discuss data challenges and solutions in the context of a Neural Forecasting application on labor planning.We discuss how to make this forecasting system resilient to these data challenges. We address changes in data distribution with a periodic retraining scheme and discuss the critical importance of model stability in this setting. Furthermore, we show how our deep learning model deals with missing values natively without requiring imputation. Finally, we describe how we detect anomalies in the input data and mitigate their effect before they impact the forecasts. This results in a fully autonomous forecasting system that compares favorably to a hybrid system consisting of the algorithm and human overrides.
Multivariate Time Series Forecasting with Latent Graph Inference
Mar 07, 2022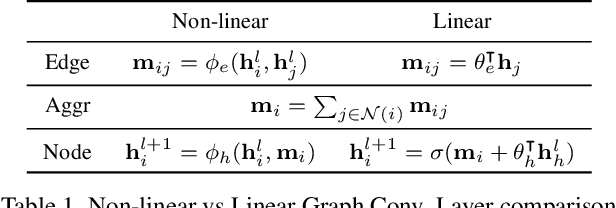
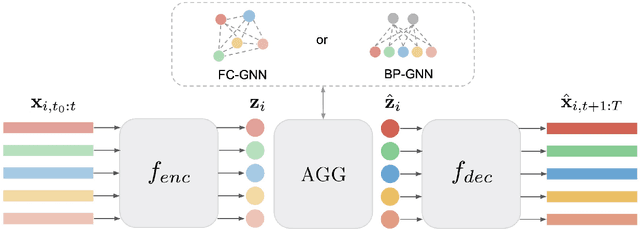
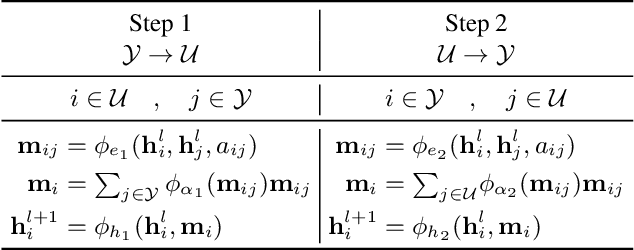
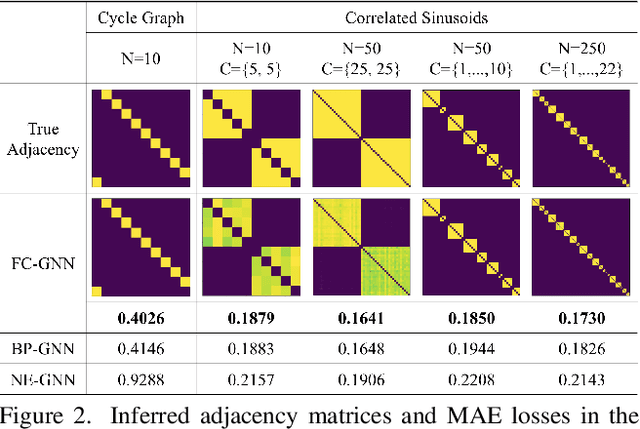
This paper introduces a new approach for Multivariate Time Series forecasting that jointly infers and leverages relations among time series. Its modularity allows it to be integrated with current univariate methods. Our approach allows to trade-off accuracy and computational efficiency gradually via offering on one extreme inference of a potentially fully-connected graph or on another extreme a bipartite graph. In the potentially fully-connected case we consider all pair-wise interactions among time-series which yields the best forecasting accuracy. Conversely, the bipartite case leverages the dependency structure by inter-communicating the N time series through a small set of K auxiliary nodes that we introduce. This reduces the time and memory complexity w.r.t. previous graph inference methods from O(N^2) to O(NK) with a small trade-off in accuracy. We demonstrate the effectiveness of our model in a variety of datasets where both of its variants perform better or very competitively to previous graph inference methods in terms of forecasting accuracy and time efficiency.