 Add to Chrome
 Add to Firefox
 Add to Edge
NEV-NCD: Negative Learning, Entropy, and Variance regularization based novel action categories discovery
Apr 14, 2023


Novel Categories Discovery (NCD) facilitates learning from a partially annotated label space and enables deep learning (DL) models to operate in an open-world setting by identifying and differentiating instances of novel classes based on the labeled data notions. One of the primary assumptions of NCD is that the novel label space is perfectly disjoint and can be equipartitioned, but it is rarely realized by most NCD approaches in practice. To better align with this assumption, we propose a novel single-stage joint optimization-based NCD method, Negative learning, Entropy, and Variance regularization NCD (NEV-NCD). We demonstrate the efficacy of NEV-NCD in previously unexplored NCD applications of video action recognition (VAR) with the public UCF101 dataset and a curated in-house partial action-space annotated multi-view video dataset. We perform a thorough ablation study by varying the composition of final joint loss and associated hyper-parameters. During our experiments with UCF101 and multi-view action dataset, NEV-NCD achieves ~ 83% classification accuracy in test instances of labeled data. NEV-NCD achieves ~ 70% clustering accuracy over unlabeled data outperforming both naive baselines (by ~ 40%) and state-of-the-art pseudo-labeling-based approaches (by ~ 3.5%) over both datasets. Further, we propose to incorporate optional view-invariant feature learning with the multiview dataset to identify novel categories from novel viewpoints. Our additional view-invariance constraint improves the discriminative accuracy for both known and unknown categories by ~ 10% for novel viewpoints.
When Visible-to-Thermal Facial GAN Beats Conditional Diffusion
Feb 18, 2023


Thermal facial imagery offers valuable insight into physiological states such as inflammation and stress by detecting emitted radiation in the infrared spectrum, which is unseen in the visible spectra. Telemedicine applications could benefit from thermal imagery, but conventional computers are reliant on RGB cameras and lack thermal sensors. As a result, we propose the Visible-to-Thermal Facial GAN (VTF-GAN) that is specifically designed to generate high-resolution thermal faces by learning both the spatial and frequency domains of facial regions, across spectra. We compare VTF-GAN against several popular GAN baselines and the first conditional Denoising Diffusion Probabilistic Model (DDPM) for VT face translation (VTF-Diff). Results show that VTF-GAN achieves high quality, crisp, and perceptually realistic thermal faces using a combined set of patch, temperature, perceptual, and Fourier Transform losses, compared to all baselines including diffusion.
Pseudo value-based Deep Neural Networks for Multi-state Survival Analysis
Jul 12, 2022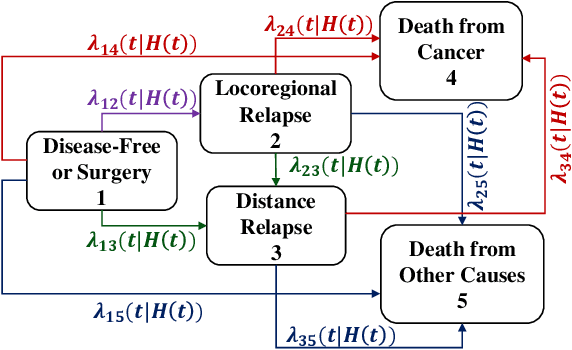
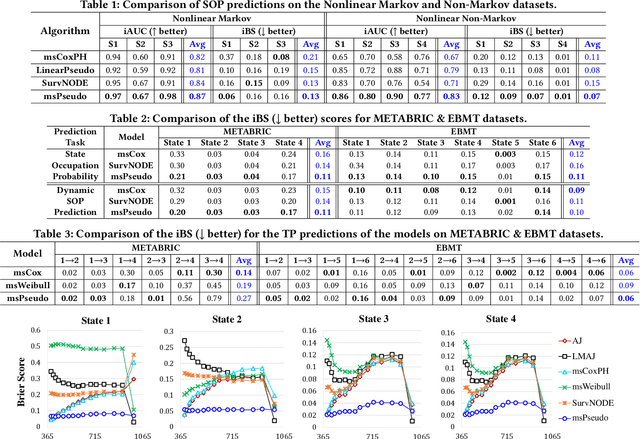
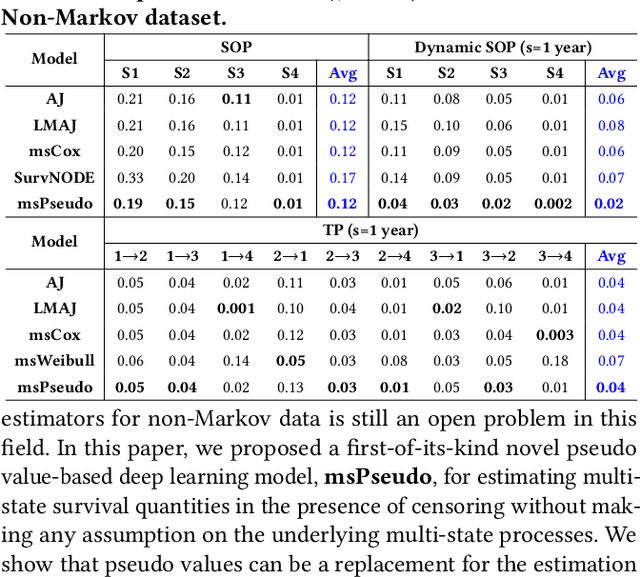
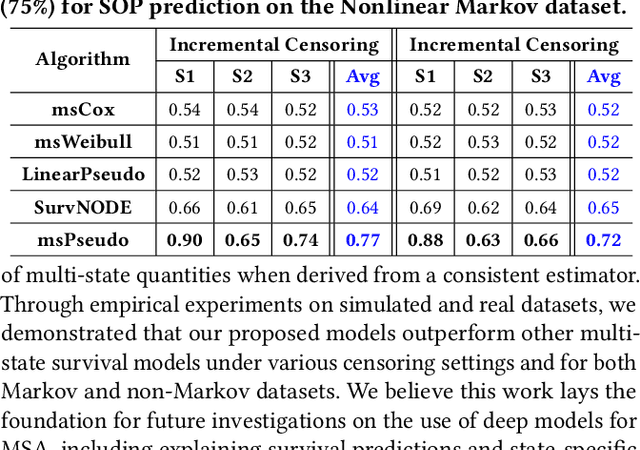
Multi-state survival analysis (MSA) uses multi-state models for the analysis of time-to-event data. In medical applications, MSA can provide insights about the complex disease progression in patients. A key challenge in MSA is the accurate subject-specific prediction of multi-state model quantities such as transition probability and state occupation probability in the presence of censoring. Traditional multi-state methods such as Aalen-Johansen (AJ) estimators and Cox-based methods are respectively limited by Markov and proportional hazards assumptions and are infeasible for making subject-specific predictions. Neural ordinary differential equations for MSA relax these assumptions but are computationally expensive and do not directly model the transition probabilities. To address these limitations, we propose a new class of pseudo-value-based deep learning models for multi-state survival analysis, where we show that pseudo values - designed to handle censoring - can be a natural replacement for estimating the multi-state model quantities when derived from a consistent estimator. In particular, we provide an algorithm to derive pseudo values from consistent estimators to directly predict the multi-state survival quantities from the subject's covariates. Empirical results on synthetic and real-world datasets show that our proposed models achieve state-of-the-art results under various censoring settings.
FedPseudo: Pseudo value-based Deep Learning Models for Federated Survival Analysis
Jul 12, 2022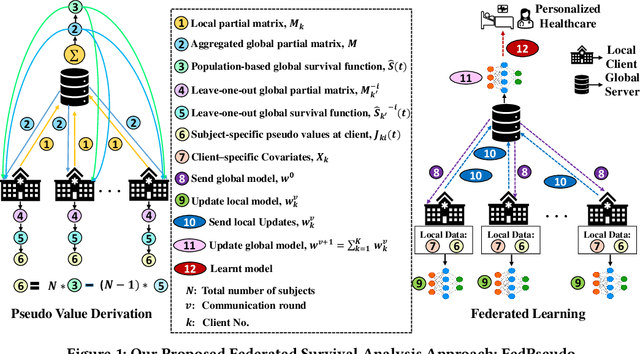
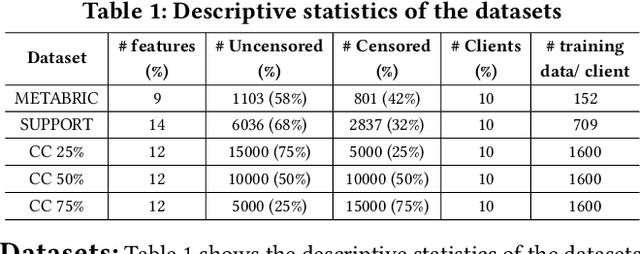
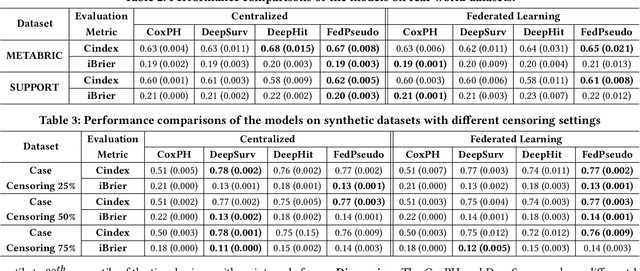
Survival analysis, time-to-event analysis, is an important problem in healthcare since it has a wide-ranging impact on patients and palliative care. Many survival analysis methods have assumed that the survival data is centrally available either from one medical center or by data sharing from multi-centers. However, the sensitivity of the patient attributes and the strict privacy laws have increasingly forbidden sharing of healthcare data. To address this challenge, the research community has looked at the solution of decentralized training and sharing of model parameters using the Federated Learning (FL) paradigm. In this paper, we study the utilization of FL for performing survival analysis on distributed healthcare datasets. Recently, the popular Cox proportional hazard (CPH) models have been adapted for FL settings; however, due to its linearity and proportional hazards assumptions, CPH models result in suboptimal performance, especially for non-linear, non-iid, and heavily censored survival datasets. To overcome the challenges of existing federated survival analysis methods, we leverage the predictive accuracy of the deep learning models and the power of pseudo values to propose a first-of-its-kind, pseudo value-based deep learning model for federated survival analysis (FSA) called FedPseudo. Furthermore, we introduce a novel approach of deriving pseudo values for survival probability in the FL settings that speeds up the computation of pseudo values. Extensive experiments on synthetic and real-world datasets show that our pseudo valued-based FL framework achieves similar performance as the best centrally trained deep survival analysis model. Moreover, our proposed FL approach obtains the best results for various censoring settings.
Intelligent Sight and Sound: A Chronic Cancer Pain Dataset
Apr 07, 2022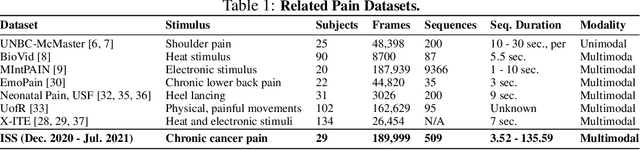

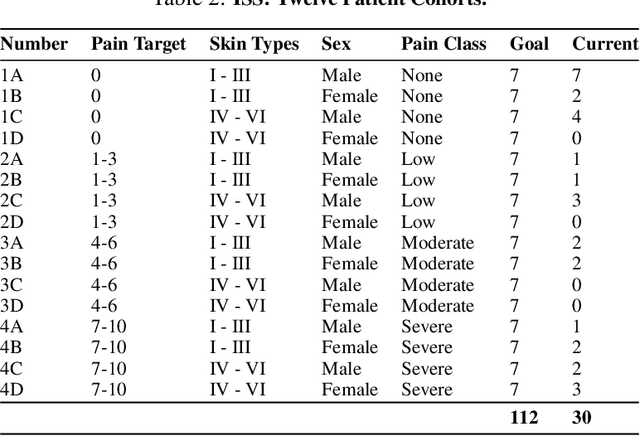
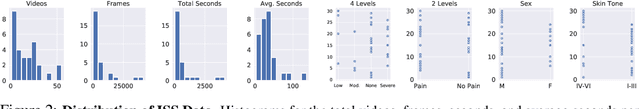
Cancer patients experience high rates of chronic pain throughout the treatment process. Assessing pain for this patient population is a vital component of psychological and functional well-being, as it can cause a rapid deterioration of quality of life. Existing work in facial pain detection often have deficiencies in labeling or methodology that prevent them from being clinically relevant. This paper introduces the first chronic cancer pain dataset, collected as part of the Intelligent Sight and Sound (ISS) clinical trial, guided by clinicians to help ensure that model findings yield clinically relevant results. The data collected to date consists of 29 patients, 509 smartphone videos, 189,999 frames, and self-reported affective and activity pain scores adopted from the Brief Pain Inventory (BPI). Using static images and multi-modal data to predict self-reported pain levels, early models show significant gaps between current methods available to predict pain today, with room for improvement. Due to the especially sensitive nature of the inherent Personally Identifiable Information (PII) of facial images, the dataset will be released under the guidance and control of the National Institutes of Health (NIH).
Generating Thermal Human Faces for Physiological Assessment Using Thermal Sensor Auxiliary Labels
Jun 15, 2021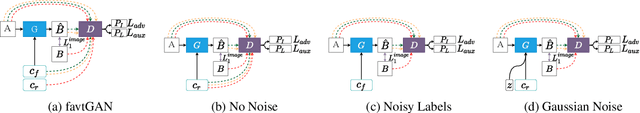
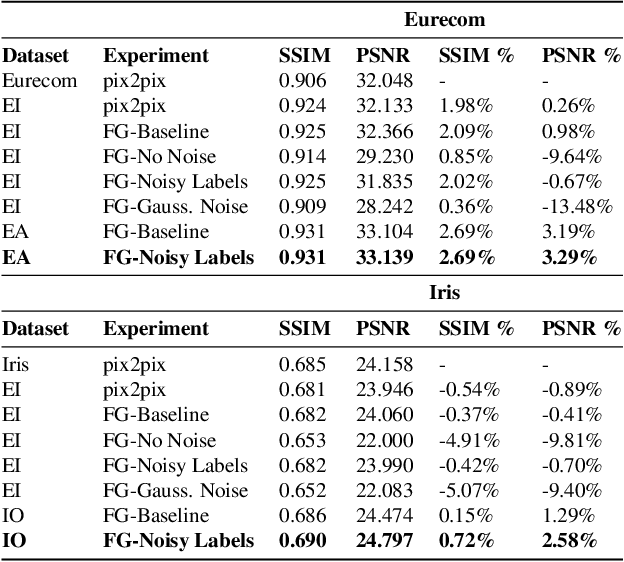
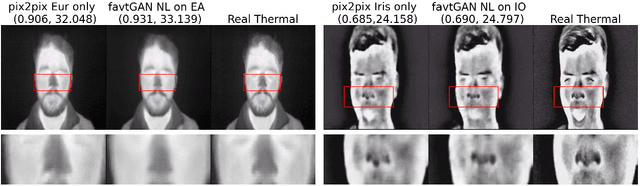
Thermal images reveal medically important physiological information about human stress, signs of inflammation, and emotional mood that cannot be seen on visible images. Providing a method to generate thermal faces from visible images would be highly valuable for the telemedicine community in order to show this medical information. To the best of our knowledge, there are limited works on visible-to-thermal (VT) face translation, and many current works go the opposite direction to generate visible faces from thermal surveillance images (TV) for law enforcement applications. As a result, we introduce favtGAN, a VT GAN which uses the pix2pix image translation model with an auxiliary sensor label prediction network for generating thermal faces from visible images. Since most TV methods are trained on only one data source drawn from one thermal sensor, we combine datasets from faces and cityscapes. These combined data are captured from similar sensors in order to bootstrap the training and transfer learning task, especially valuable because visible-thermal face datasets are limited. Experiments on these combined datasets show that favtGAN demonstrates an increase in SSIM and PSNR scores of generated thermal faces, compared to training on a single face dataset alone.
The Use of AI for Thermal Emotion Recognition: A Review of Problems and Limitations in Standard Design and Data
Sep 22, 2020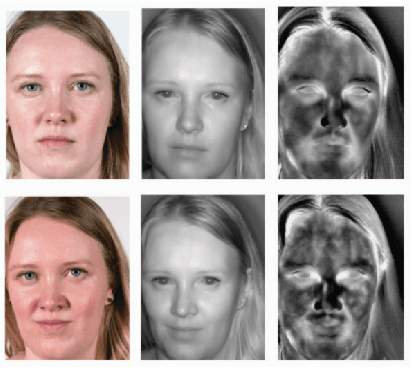
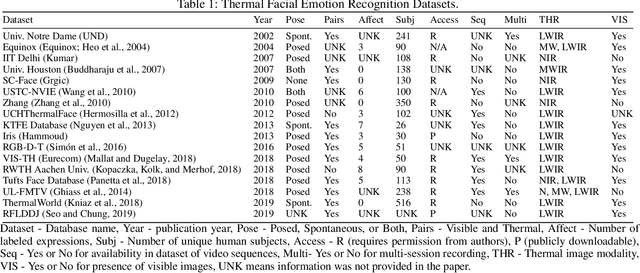
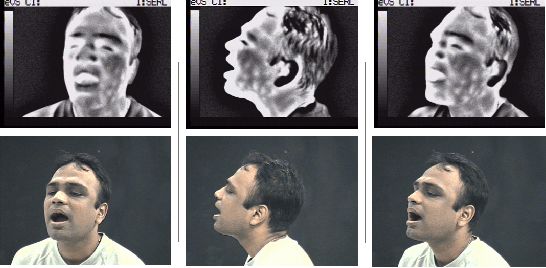
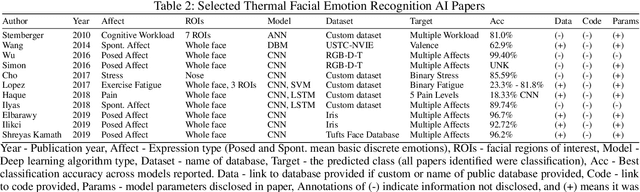
With the increased attention on thermal imagery for Covid-19 screening, the public sector may believe there are new opportunities to exploit thermal as a modality for computer vision and AI. Thermal physiology research has been ongoing since the late nineties. This research lies at the intersections of medicine, psychology, machine learning, optics, and affective computing. We will review the known factors of thermal vs. RGB imaging for facial emotion recognition. But we also propose that thermal imagery may provide a semi-anonymous modality for computer vision, over RGB, which has been plagued by misuse in facial recognition. However, the transition to adopting thermal imagery as a source for any human-centered AI task is not easy and relies on the availability of high fidelity data sources across multiple demographics and thorough validation. This paper takes the reader on a short review of machine learning in thermal FER and the limitations of collecting and developing thermal FER data for AI training. Our motivation is to provide an introductory overview into recent advances for thermal FER and stimulate conversation about the limitations in current datasets.
Exploratory Analysis of Covid-19 Tweets using Topic Modeling, UMAP, and DiGraphs
May 06, 2020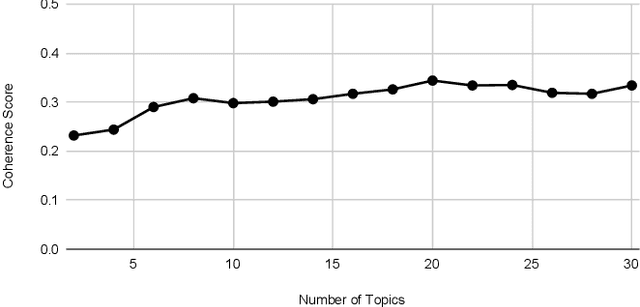
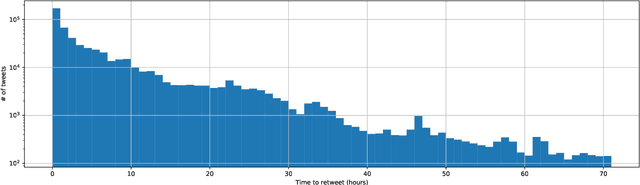
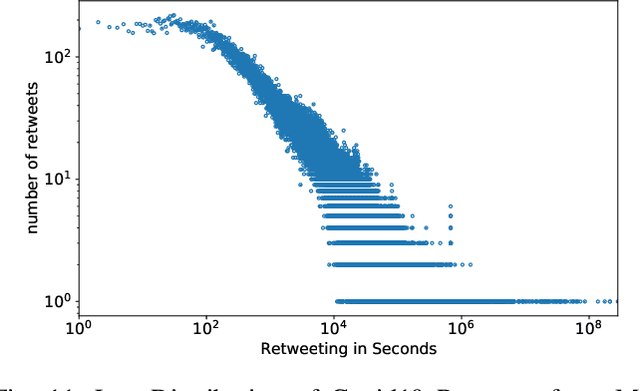
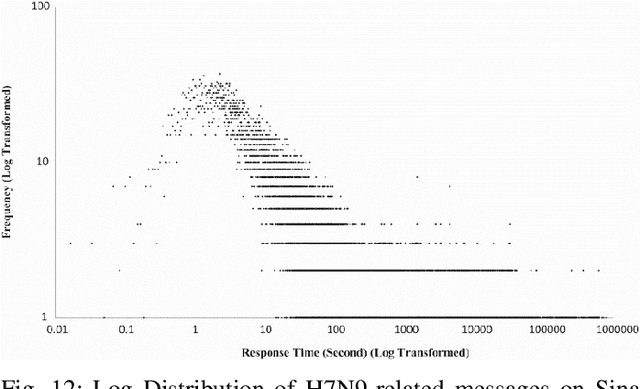
This paper illustrates five different techniques to assess the distinctiveness of topics, key terms and features, speed of information dissemination, and network behaviors for Covid19 tweets. First, we use pattern matching and second, topic modeling through Latent Dirichlet Allocation (LDA) to generate twenty different topics that discuss case spread, healthcare workers, and personal protective equipment (PPE). One topic specific to U.S. cases would start to uptick immediately after live White House Coronavirus Task Force briefings, implying that many Twitter users are paying attention to government announcements. We contribute machine learning methods not previously reported in the Covid19 Twitter literature. This includes our third method, Uniform Manifold Approximation and Projection (UMAP), that identifies unique clustering-behavior of distinct topics to improve our understanding of important themes in the corpus and help assess the quality of generated topics. Fourth, we calculated retweeting times to understand how fast information about Covid19 propagates on Twitter. Our analysis indicates that the median retweeting time of Covid19 for a sample corpus in March 2020 was 2.87 hours, approximately 50 minutes faster than repostings from Chinese social media about H7N9 in March 2013. Lastly, we sought to understand retweet cascades, by visualizing the connections of users over time from fast to slow retweeting. As the time to retweet increases, the density of connections also increase where in our sample, we found distinct users dominating the attention of Covid19 retweeters. One of the simplest highlights of this analysis is that early-stage descriptive methods like regular expressions can successfully identify high-level themes which were consistently verified as important through every subsequent analysis.
Benchmark of Deep Learning Models on Large Healthcare MIMIC Datasets
Oct 23, 2017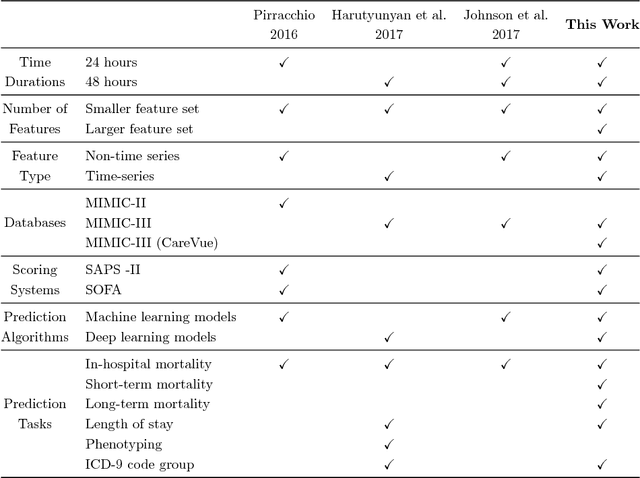
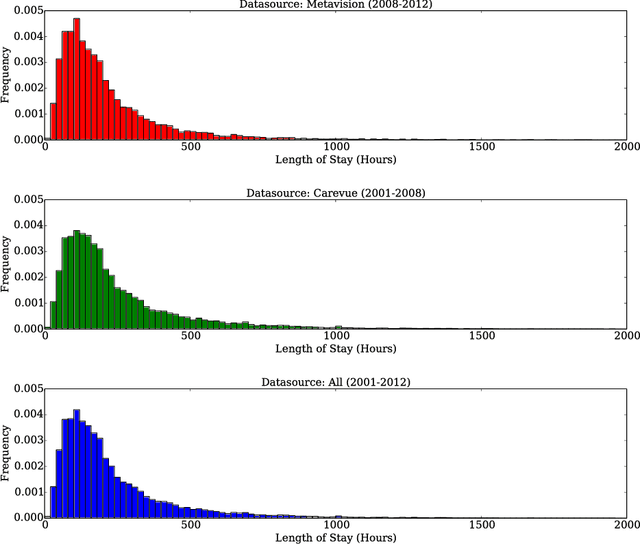
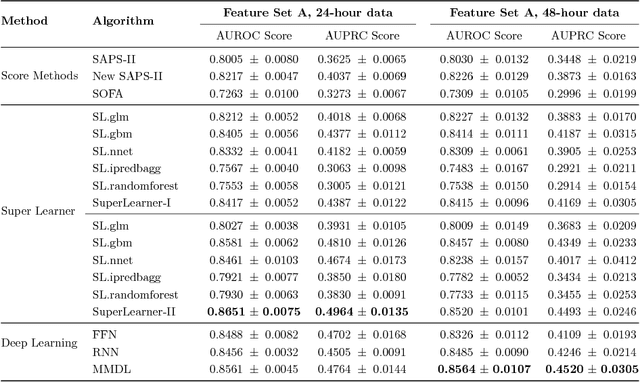
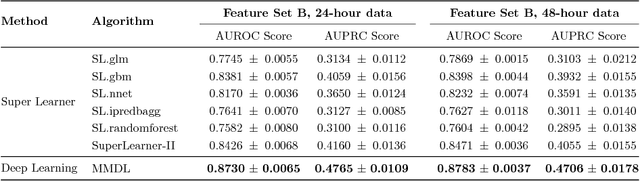
Deep learning models (aka Deep Neural Networks) have revolutionized many fields including computer vision, natural language processing, speech recognition, and is being increasingly used in clinical healthcare applications. However, few works exist which have benchmarked the performance of the deep learning models with respect to the state-of-the-art machine learning models and prognostic scoring systems on publicly available healthcare datasets. In this paper, we present the benchmarking results for several clinical prediction tasks such as mortality prediction, length of stay prediction, and ICD-9 code group prediction using Deep Learning models, ensemble of machine learning models (Super Learner algorithm), SAPS II and SOFA scores. We used the Medical Information Mart for Intensive Care III (MIMIC-III) (v1.4) publicly available dataset, which includes all patients admitted to an ICU at the Beth Israel Deaconess Medical Center from 2001 to 2012, for the benchmarking tasks. Our results show that deep learning models consistently outperform all the other approaches especially when the `raw' clinical time series data is used as input features to the models.
m-TSNE: A Framework for Visualizing High-Dimensional Multivariate Time Series
Aug 26, 2017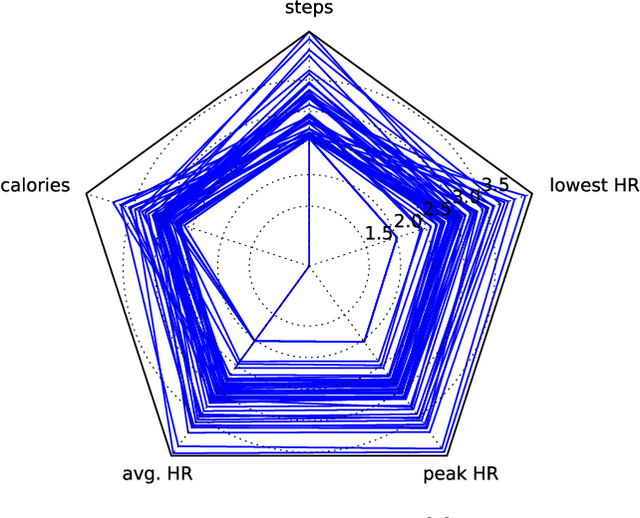
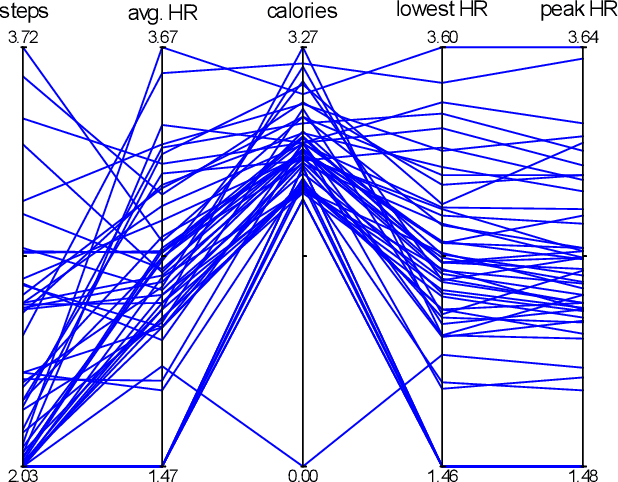
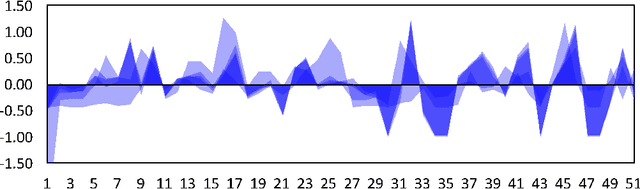
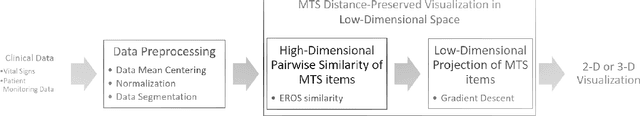
Multivariate time series (MTS) have become increasingly common in healthcare domains where human vital signs and laboratory results are collected for predictive diagnosis. Recently, there have been increasing efforts to visualize healthcare MTS data based on star charts or parallel coordinates. However, such techniques might not be ideal for visualizing a large MTS dataset, since it is difficult to obtain insights or interpretations due to the inherent high dimensionality of MTS. In this paper, we propose 'm-TSNE': a simple and novel framework to visualize high-dimensional MTS data by projecting them into a low-dimensional (2-D or 3-D) space while capturing the underlying data properties. Our framework is easy to use and provides interpretable insights for healthcare professionals to understand MTS data. We evaluate our visualization framework on two real-world datasets and demonstrate that the results of our m-TSNE show patterns that are easy to understand while the other methods' visualization may have limitations in interpretability.