 Add to Chrome
 Add to Firefox
 Add to Edge
m-TSNE: A Framework for Visualizing High-Dimensional Multivariate Time Series
Aug 26, 2017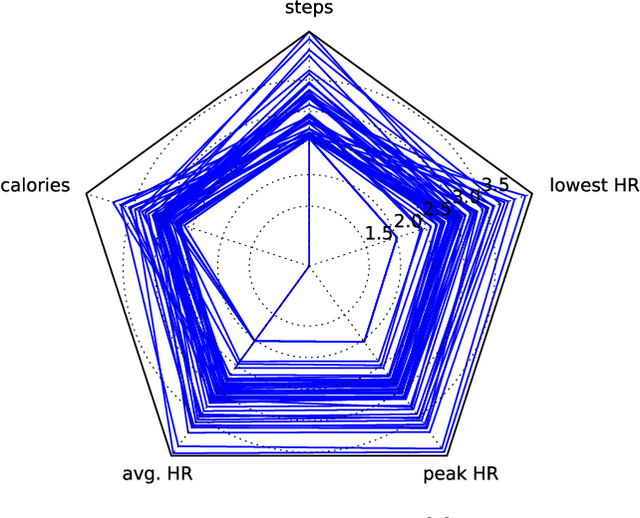
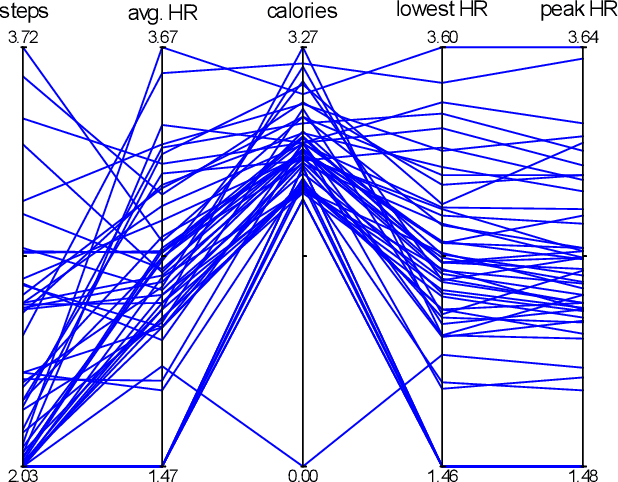
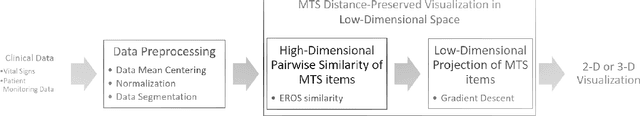
Multivariate time series (MTS) have become increasingly common in healthcare domains where human vital signs and laboratory results are collected for predictive diagnosis. Recently, there have been increasing efforts to visualize healthcare MTS data based on star charts or parallel coordinates. However, such techniques might not be ideal for visualizing a large MTS dataset, since it is difficult to obtain insights or interpretations due to the inherent high dimensionality of MTS. In this paper, we propose 'm-TSNE': a simple and novel framework to visualize high-dimensional MTS data by projecting them into a low-dimensional (2-D or 3-D) space while capturing the underlying data properties. Our framework is easy to use and provides interpretable insights for healthcare professionals to understand MTS data. We evaluate our visualization framework on two real-world datasets and demonstrate that the results of our m-TSNE show patterns that are easy to understand while the other methods' visualization may have limitations in interpretability.
On Identifying Disaster-Related Tweets: Matching-based or Learning-based?
May 04, 2017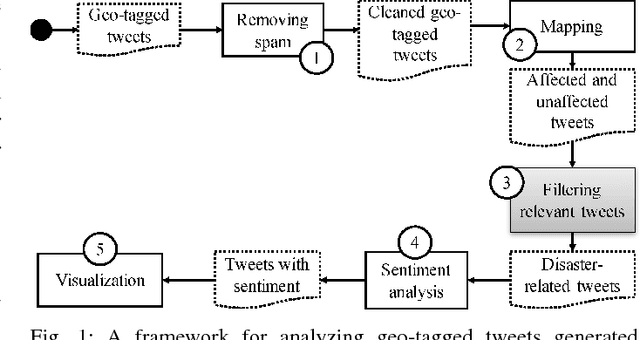
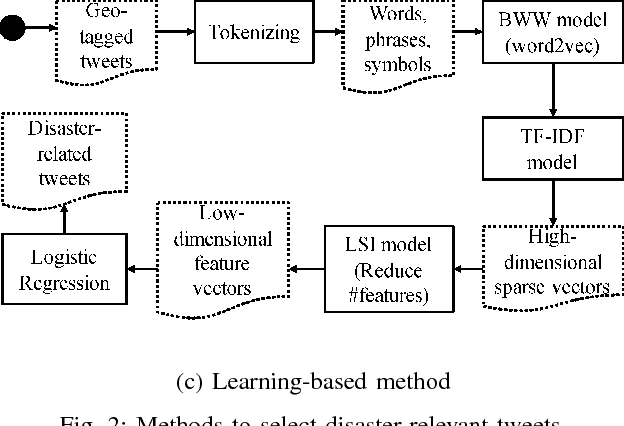
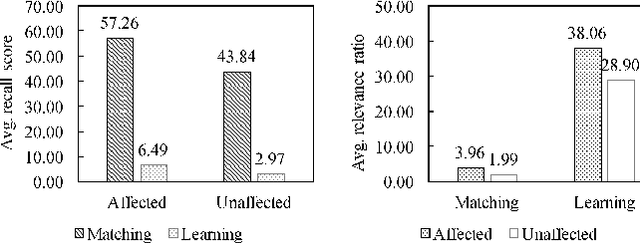
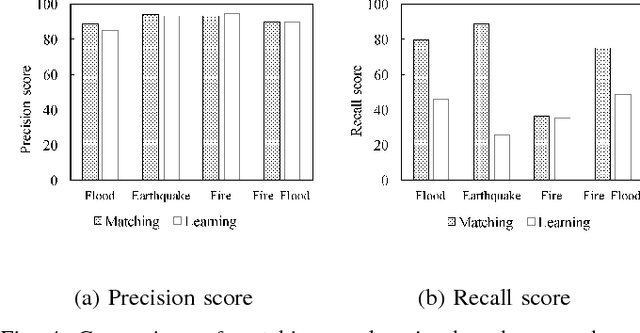
Social media such as tweets are emerging as platforms contributing to situational awareness during disasters. Information shared on Twitter by both affected population (e.g., requesting assistance, warning) and those outside the impact zone (e.g., providing assistance) would help first responders, decision makers, and the public to understand the situation first-hand. Effective use of such information requires timely selection and analysis of tweets that are relevant to a particular disaster. Even though abundant tweets are promising as a data source, it is challenging to automatically identify relevant messages since tweet are short and unstructured, resulting to unsatisfactory classification performance of conventional learning-based approaches. Thus, we propose a simple yet effective algorithm to identify relevant messages based on matching keywords and hashtags, and provide a comparison between matching-based and learning-based approaches. To evaluate the two approaches, we put them into a framework specifically proposed for analyzing disaster-related tweets. Analysis results on eleven datasets with various disaster types show that our technique provides relevant tweets of higher quality and more interpretable results of sentiment analysis tasks when compared to learning approach.