 Add to Chrome
 Add to Firefox
 Add to Edge
ECHOSAT: Estimating Canopy Height Over Space And Time
Feb 24, 2026Forest monitoring is critical for climate change mitigation. However, existing global tree height maps provide only static snapshots and do not capture temporal forest dynamics, which are essential for accurate carbon accounting. We introduce ECHOSAT, a global and temporally consistent tree height map at 10 m resolution spanning multiple years. To this end, we resort to multi-sensor satellite data to train a specialized vision transformer model, which performs pixel-level temporal regression. A self-supervised growth loss regularizes the predictions to follow growth curves that are in line with natural tree development, including gradual height increases over time, but also abrupt declines due to forest loss events such as fires. Our experimental evaluation shows that our model improves state-of-the-art accuracies in the context of single-year predictions. We also provide the first global-scale height map that accurately quantifies tree growth and disturbances over time. We expect ECHOSAT to advance global efforts in carbon monitoring and disturbance assessment. The maps can be accessed at https://github.com/ai4forest/echosat.
SERA-H: Beyond Native Sentinel Spatial Limits for High-Resolution Canopy Height Mapping
Dec 19, 2025


High-resolution mapping of canopy height is essential for forest management and biodiversity monitoring. Although recent studies have led to the advent of deep learning methods using satellite imagery to predict height maps, these approaches often face a trade-off between data accessibility and spatial resolution. To overcome these limitations, we present SERA-H, an end-to-end model combining a super-resolution module (EDSR) and temporal attention encoding (UTAE). Trained under the supervision of high-density LiDAR data (ALS), our model generates 2.5 m resolution height maps from freely available Sentinel-1 and Sentinel-2 (10 m) time series data. Evaluated on an open-source benchmark dataset in France, SERA-H, with a MAE of 2.6 m and a coefficient of determination of 0.82, not only outperforms standard Sentinel-1/2 baselines but also achieves performance comparable to or better than methods relying on commercial very high-resolution imagery (SPOT-6/7, PlanetScope, Maxar). These results demonstrate that combining high-resolution supervision with the spatiotemporal information embedded in time series enables the reconstruction of details beyond the input sensors' native resolution. SERA-H opens the possibility of freely mapping forests with high revisit frequency, achieving accuracy comparable to that of costly commercial imagery. The source code is available at https://github.com/ThomasBoudras/SERA-H#
FORMSpoT: A Decade of Tree-Level, Country-Scale Forest Monitoring
Dec 18, 2025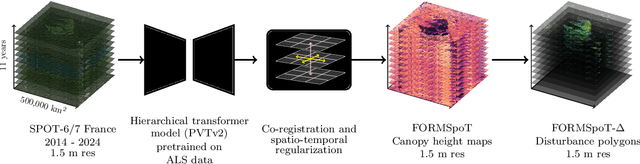
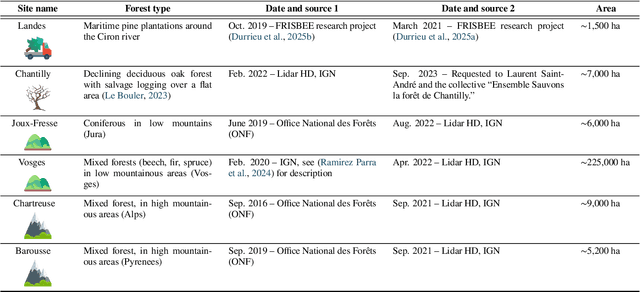
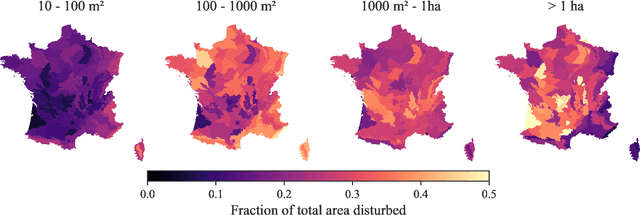
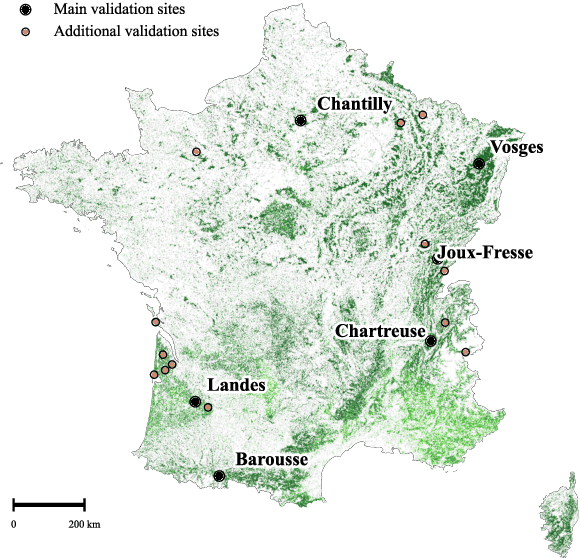
The recent decline of the European forest carbon sink highlights the need for spatially explicit and frequently updated forest monitoring tools. Yet, existing satellite-based disturbance products remain too coarse to detect changes at the scale of individual trees, typically below 100 m$^{2}$. Here, we introduce FORMSpoT (Forest Mapping with SPOT Time series), a decade-long (2014-2024) nationwide mapping of forest canopy height at 1.5 m resolution, together with annual disturbance polygons (FORMSpoT-$Δ$) covering mainland France. Canopy heights were derived from annual SPOT-6/7 composites using a hierarchical transformer model (PVTv2) trained on high-resolution airborne laser scanning (ALS) data. To enable robust change detection across heterogeneous acquisitions, we developed a dedicated post-processing pipeline combining co-registration and spatio-temporal total variation denoising. Validation against ALS revisits across 19 sites and 5,087 National Forest Inventory plots shows that FORMSpoT-$Δ$ substantially outperforms existing disturbance products. In mountainous forests, where disturbances are small and spatially fragmented, FORMSpoT-$Δ$ achieves an F1-score of 0.44, representing an order of magnitude higher than existing benchmarks. By enabling tree-level monitoring of forest dynamics at national scale, FORMSpoT-$Δ$ provides a unique tool to analyze management practices, detect early signals of forest decline, and better quantify carbon losses from subtle disturbances such as thinning or selective logging. These results underscore the critical importance of sustaining very high-resolution satellite missions like SPOT and open-data initiatives such as DINAMIS for monitoring forests under climate change.
Towards Accurate Forecasting of Renewable Energy : Building Datasets and Benchmarking Machine Learning Models for Solar and Wind Power in France
Apr 14, 2025Accurate prediction of non-dispatchable renewable energy sources is essential for grid stability and price prediction. Regional power supply forecasts are usually indirect through a bottom-up approach of plant-level forecasts, incorporate lagged power values, and do not use the potential of spatially resolved data. This study presents a comprehensive methodology for predicting solar and wind power production at country scale in France using machine learning models trained with spatially explicit weather data combined with spatial information about production sites capacity. A dataset is built spanning from 2012 to 2023, using daily power production data from RTE (the national grid operator) as the target variable, with daily weather data from ERA5, production sites capacity and location, and electricity prices as input features. Three modeling approaches are explored to handle spatially resolved weather data: spatial averaging over the country, dimension reduction through principal component analysis, and a computer vision architecture to exploit complex spatial relationships. The study benchmarks state-of-the-art machine learning models as well as hyperparameter tuning approaches based on cross-validation methods on daily power production data. Results indicate that cross-validation tailored to time series is best suited to reach low error. We found that neural networks tend to outperform traditional tree-based models, which face challenges in extrapolation due to the increasing renewable capacity over time. Model performance ranges from 4% to 10% in nRMSE for midterm horizon, achieving similar error metrics to local models established at a single-plant level, highlighting the potential of these methods for regional power supply forecasting.
DUNIA: Pixel-Sized Embeddings via Cross-Modal Alignment for Earth Observation Applications
Feb 24, 2025


Significant efforts have been directed towards adapting self-supervised multimodal learning for Earth observation applications. However, existing methods produce coarse patch-sized embeddings, limiting their effectiveness and integration with other modalities like LiDAR. To close this gap, we present DUNIA, an approach to learn pixel-sized embeddings through cross-modal alignment between images and full-waveform LiDAR data. As the model is trained in a contrastive manner, the embeddings can be directly leveraged in the context of a variety of environmental monitoring tasks in a zero-shot setting. In our experiments, we demonstrate the effectiveness of the embeddings for seven such tasks (canopy height mapping, fractional canopy cover, land cover mapping, tree species identification, plant area index, crop type classification, and per-pixel waveform-based vertical structure mapping). The results show that the embeddings, along with zero-shot classifiers, often outperform specialized supervised models, even in low data regimes. In the fine-tuning setting, we show strong low-shot capabilities with performances near or better than state-of-the-art on five out of six tasks.
Capturing Temporal Dynamics in Large-Scale Canopy Tree Height Estimation
Jan 31, 2025


With the rise in global greenhouse gas emissions, accurate large-scale tree canopy height maps are essential for understanding forest structure, estimating above-ground biomass, and monitoring ecological disruptions. To this end, we present a novel approach to generate large-scale, high-resolution canopy height maps over time. Our model accurately predicts canopy height over multiple years given Sentinel-2 time series satellite data. Using GEDI LiDAR data as the ground truth for training the model, we present the first 10m resolution temporal canopy height map of the European continent for the period 2019-2022. As part of this product, we also offer a detailed canopy height map for 2020, providing more precise estimates than previous studies. Our pipeline and the resulting temporal height map are publicly available, enabling comprehensive large-scale monitoring of forests and, hence, facilitating future research and ecological analyses. For an interactive viewer, see https://europetreemap.projects.earthengine.app/view/temporalcanopyheight.
High Resolution Tree Height Mapping of the Amazon Forest using Planet NICFI Images and LiDAR-Informed U-Net Model
Jan 17, 2025


Tree canopy height is one of the most important indicators of forest biomass, productivity, and ecosystem structure, but it is challenging to measure accurately from the ground and from space. Here, we used a U-Net model adapted for regression to map the mean tree canopy height in the Amazon forest from Planet NICFI images at ~4.78 m spatial resolution for the period 2020-2024. The U-Net model was trained using canopy height models computed from aerial LiDAR data as a reference, along with their corresponding Planet NICFI images. Predictions of tree heights on the validation sample exhibited a mean error of 3.68 m and showed relatively low systematic bias across the entire range of tree heights present in the Amazon forest. Our model successfully estimated canopy heights up to 40-50 m without much saturation, outperforming existing canopy height products from global models in this region. We determined that the Amazon forest has an average canopy height of ~22 m. Events such as logging or deforestation could be detected from changes in tree height, and encouraging results were obtained to monitor the height of regenerating forests. These findings demonstrate the potential for large-scale mapping and monitoring of tree height for old and regenerating Amazon forests using Planet NICFI imagery.
Reconstructing Global Daily CO2 Emissions via Machine Learning
Jul 29, 2024


High temporal resolution CO2 emission data are crucial for understanding the drivers of emission changes, however, current emission dataset is only available on a yearly basis. Here, we extended a global daily CO2 emissions dataset backwards in time to 1970 using machine learning algorithm, which was trained to predict historical daily emissions on national scales based on relationships between daily emission variations and predictors established for the period since 2019. Variation in daily CO2 emissions far exceeded the smoothed seasonal variations. For example, the range of daily CO2 emissions equivalent to 31% of the year average daily emissions in China and 46% of that in India in 2022, respectively. We identified the critical emission-climate temperature (Tc) is 16.5 degree celsius for global average (18.7 degree celsius for China, 14.9 degree celsius for U.S., and 18.4 degree celsius for Japan), in which negative correlation observed between daily CO2 emission and ambient temperature below Tc and a positive correlation above it, demonstrating increased emissions associated with higher ambient temperature. The long-term time series spanning over fifty years of global daily CO2 emissions reveals an increasing trend in emissions due to extreme temperature events, driven by the rising frequency of these occurrences. This work suggests that, due to climate change, greater efforts may be needed to reduce CO2 emissions.
Estimating Canopy Height at Scale
Jun 03, 2024


We propose a framework for global-scale canopy height estimation based on satellite data. Our model leverages advanced data preprocessing techniques, resorts to a novel loss function designed to counter geolocation inaccuracies inherent in the ground-truth height measurements, and employs data from the Shuttle Radar Topography Mission to effectively filter out erroneous labels in mountainous regions, enhancing the reliability of our predictions in those areas. A comparison between predictions and ground-truth labels yields an MAE / RMSE of 2.43 / 4.73 (meters) overall and 4.45 / 6.72 (meters) for trees taller than five meters, which depicts a substantial improvement compared to existing global-scale maps. The resulting height map as well as the underlying framework will facilitate and enhance ecological analyses at a global scale, including, but not limited to, large-scale forest and biomass monitoring.
Get Your Embedding Space in Order: Domain-Adaptive Regression for Forest Monitoring
May 01, 2024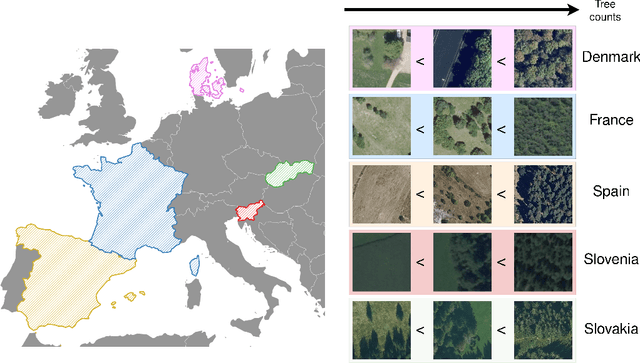
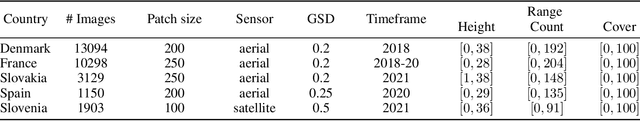
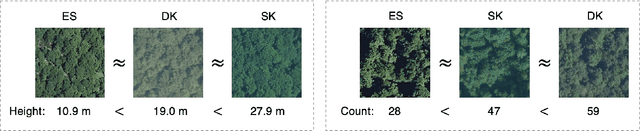
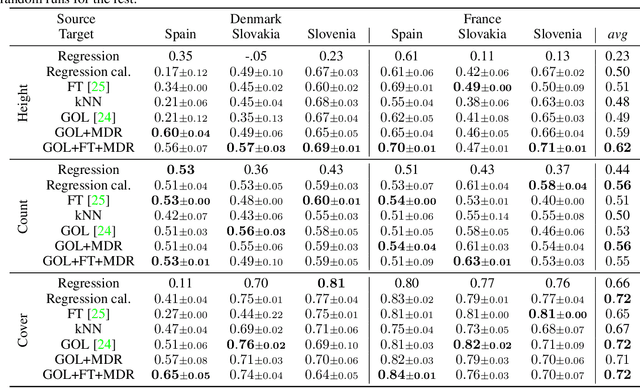
Image-level regression is an important task in Earth observation, where visual domain and label shifts are a core challenge hampering generalization. However, cross-domain regression with remote sensing data remains understudied due to the absence of suited datasets. We introduce a new dataset with aerial and satellite imagery in five countries with three forest-related regression tasks. To match real-world applicative interests, we compare methods through a restrictive setup where no prior on the target domain is available during training, and models are adapted with limited information during testing. Building on the assumption that ordered relationships generalize better, we propose manifold diffusion for regression as a strong baseline for transduction in low-data regimes. Our comparison highlights the comparative advantages of inductive and transductive methods in cross-domain regression.