 Add to Chrome
 Add to Firefox
 Add to Edge
SERA-H: Beyond Native Sentinel Spatial Limits for High-Resolution Canopy Height Mapping
Dec 19, 2025


High-resolution mapping of canopy height is essential for forest management and biodiversity monitoring. Although recent studies have led to the advent of deep learning methods using satellite imagery to predict height maps, these approaches often face a trade-off between data accessibility and spatial resolution. To overcome these limitations, we present SERA-H, an end-to-end model combining a super-resolution module (EDSR) and temporal attention encoding (UTAE). Trained under the supervision of high-density LiDAR data (ALS), our model generates 2.5 m resolution height maps from freely available Sentinel-1 and Sentinel-2 (10 m) time series data. Evaluated on an open-source benchmark dataset in France, SERA-H, with a MAE of 2.6 m and a coefficient of determination of 0.82, not only outperforms standard Sentinel-1/2 baselines but also achieves performance comparable to or better than methods relying on commercial very high-resolution imagery (SPOT-6/7, PlanetScope, Maxar). These results demonstrate that combining high-resolution supervision with the spatiotemporal information embedded in time series enables the reconstruction of details beyond the input sensors' native resolution. SERA-H opens the possibility of freely mapping forests with high revisit frequency, achieving accuracy comparable to that of costly commercial imagery. The source code is available at https://github.com/ThomasBoudras/SERA-H#
High Resolution Tree Height Mapping of the Amazon Forest using Planet NICFI Images and LiDAR-Informed U-Net Model
Jan 17, 2025


Tree canopy height is one of the most important indicators of forest biomass, productivity, and ecosystem structure, but it is challenging to measure accurately from the ground and from space. Here, we used a U-Net model adapted for regression to map the mean tree canopy height in the Amazon forest from Planet NICFI images at ~4.78 m spatial resolution for the period 2020-2024. The U-Net model was trained using canopy height models computed from aerial LiDAR data as a reference, along with their corresponding Planet NICFI images. Predictions of tree heights on the validation sample exhibited a mean error of 3.68 m and showed relatively low systematic bias across the entire range of tree heights present in the Amazon forest. Our model successfully estimated canopy heights up to 40-50 m without much saturation, outperforming existing canopy height products from global models in this region. We determined that the Amazon forest has an average canopy height of ~22 m. Events such as logging or deforestation could be detected from changes in tree height, and encouraging results were obtained to monitor the height of regenerating forests. These findings demonstrate the potential for large-scale mapping and monitoring of tree height for old and regenerating Amazon forests using Planet NICFI imagery.
Mining Field Data for Tree Species Recognition at Scale
Aug 28, 2024
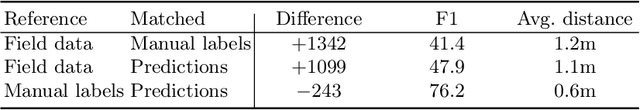
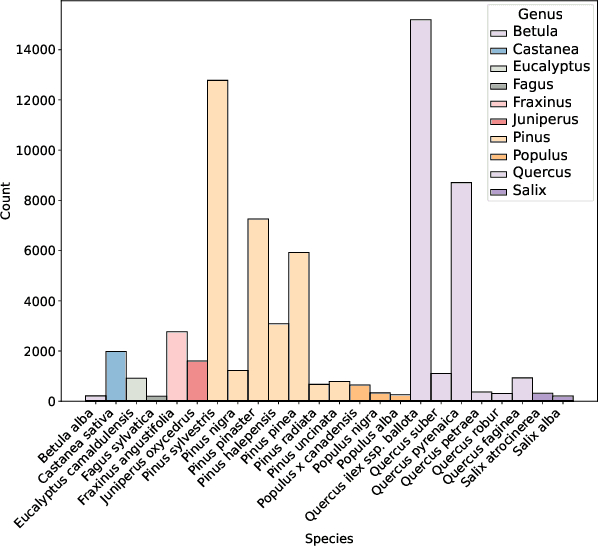

Individual tree species labels are particularly hard to acquire due to the expert knowledge needed and the limitations of photointerpretation. Here, we present a methodology to automatically mine species labels from public forest inventory data, using available pretrained tree detection models. We identify tree instances in aerial imagery and match them with field data with close to zero human involvement. We conduct a series of experiments on the resulting dataset, and show a beneficial effect when adding noisy or even unlabeled data points, highlighting a strong potential for large-scale individual species mapping.
Estimating Canopy Height at Scale
Jun 03, 2024


We propose a framework for global-scale canopy height estimation based on satellite data. Our model leverages advanced data preprocessing techniques, resorts to a novel loss function designed to counter geolocation inaccuracies inherent in the ground-truth height measurements, and employs data from the Shuttle Radar Topography Mission to effectively filter out erroneous labels in mountainous regions, enhancing the reliability of our predictions in those areas. A comparison between predictions and ground-truth labels yields an MAE / RMSE of 2.43 / 4.73 (meters) overall and 4.45 / 6.72 (meters) for trees taller than five meters, which depicts a substantial improvement compared to existing global-scale maps. The resulting height map as well as the underlying framework will facilitate and enhance ecological analyses at a global scale, including, but not limited to, large-scale forest and biomass monitoring.
Get Your Embedding Space in Order: Domain-Adaptive Regression for Forest Monitoring
May 01, 2024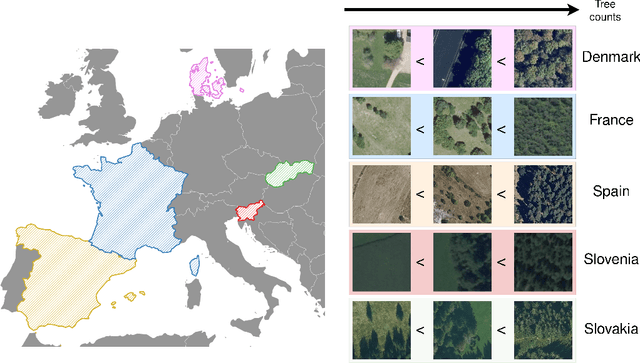
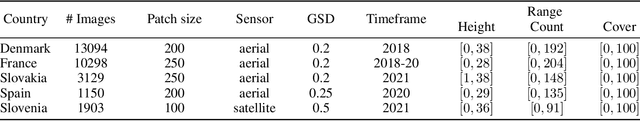
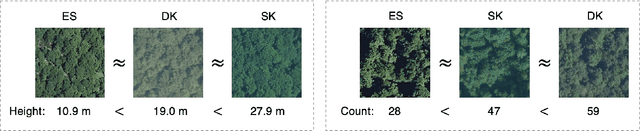
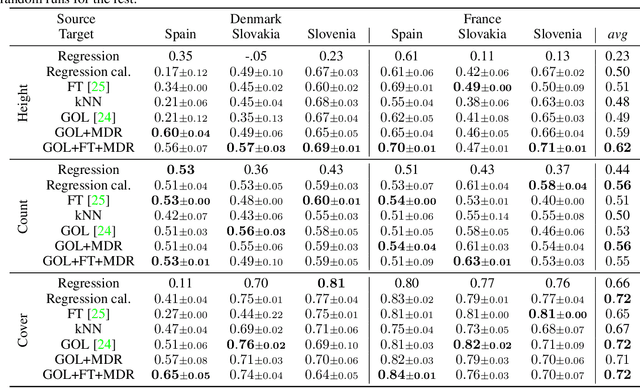
Image-level regression is an important task in Earth observation, where visual domain and label shifts are a core challenge hampering generalization. However, cross-domain regression with remote sensing data remains understudied due to the absence of suited datasets. We introduce a new dataset with aerial and satellite imagery in five countries with three forest-related regression tasks. To match real-world applicative interests, we compare methods through a restrictive setup where no prior on the target domain is available during training, and models are adapted with limited information during testing. Building on the assumption that ordered relationships generalize better, we propose manifold diffusion for regression as a strong baseline for transduction in low-data regimes. Our comparison highlights the comparative advantages of inductive and transductive methods in cross-domain regression.
Benchmarking Individual Tree Mapping with Sub-meter Imagery
Nov 14, 2023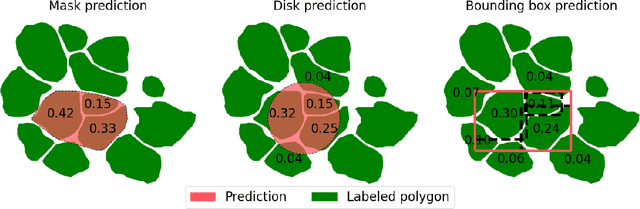


There is a rising interest in mapping trees using satellite or aerial imagery, but there is no standardized evaluation protocol for comparing and enhancing methods. In dense canopy areas, the high variability of tree sizes and their spatial proximity makes it arduous to define the quality of the predictions. Concurrently, object-centric approaches such as bounding box detection usuallyperform poorly on small and dense objects. It thus remains unclear what is the ideal framework for individual tree mapping, in regards to detection and segmentation approaches, convolutional neural networks and transformers. In this paper, we introduce an evaluation framework suited for individual tree mapping in any physical environment, with annotation costs and applicative goals in mind. We review and compare different approaches and deep architectures, and introduce a new method that we experimentally prove to be a good compromise between segmentation and detection.
Mega-cities dominate China's urban greening
Jul 03, 2023


Trees play a crucial role in urban environments, offering various ecosystem services that contribute to public health and human well-being. China has initiated a range of urban greening policies over the past decades, however, monitoring their impact on urban tree dynamics at a national scale has proven challenging. In this study, we deployed nano-satellites to quantify urban tree coverage in all major Chinese cities larger than 50 km2 in 2010 and 2019. Our findings indicate that approximately 6000 km2 (11%) of urban areas were covered by trees in 2019, and 76% of these cities experienced an increase in tree cover compared to 2010. Notably, the increase in tree cover in mega-cities such as Beijing, and Shanghai was approximately twice as large as in most other cities (7.69% vs 3.94%). The study employs a data-driven approach towards assessing urban tree cover changes in relation to greening policies, showing clear signs of tree cover increases but also suggesting an uneven implementation primarily benefiting a few mega-cities.
Sub-Meter Tree Height Mapping of California using Aerial Images and LiDAR-Informed U-Net Model
Jun 02, 2023


Tree canopy height is one of the most important indicators of forest biomass, productivity, and species diversity, but it is challenging to measure accurately from the ground and from space. Here, we used a U-Net model adapted for regression to map the canopy height of all trees in the state of California with very high-resolution aerial imagery (60 cm) from the USDA-NAIP program. The U-Net model was trained using canopy height models computed from aerial LiDAR data as a reference, along with corresponding RGB-NIR NAIP images collected in 2020. We evaluated the performance of the deep-learning model using 42 independent 1 km$^2$ sites across various forest types and landscape variations in California. Our predictions of tree heights exhibited a mean error of 2.9 m and showed relatively low systematic bias across the entire range of tree heights present in California. In 2020, trees taller than 5 m covered ~ 19.3% of California. Our model successfully estimated canopy heights up to 50 m without saturation, outperforming existing canopy height products from global models. The approach we used allowed for the reconstruction of the three-dimensional structure of individual trees as observed from nadir-looking optical airborne imagery, suggesting a relatively robust estimation and mapping capability, even in the presence of image distortion. These findings demonstrate the potential of large-scale mapping and monitoring of tree height, as well as potential biomass estimation, using NAIP imagery.
High-resolution canopy height map in the Landes forest based on GEDI, Sentinel-1, and Sentinel-2 data with a deep learning approach
Dec 20, 2022In intensively managed forests in Europe, where forests are divided into stands of small size and may show heterogeneity within stands, a high spatial resolution (10 - 20 meters) is arguably needed to capture the differences in canopy height. In this work, we developed a deep learning model based on multi-stream remote sensing measurements to create a high-resolution canopy height map over the "Landes de Gascogne" forest in France, a large maritime pine plantation of 13,000 km$^2$ with flat terrain and intensive management. This area is characterized by even-aged and mono-specific stands, of a typical length of a few hundred meters, harvested every 35 to 50 years. Our deep learning U-Net model uses multi-band images from Sentinel-1 and Sentinel-2 with composite time averages as input to predict tree height derived from GEDI waveforms. The evaluation is performed with external validation data from forest inventory plots and a stereo 3D reconstruction model based on Skysat imagery available at specific locations. We trained seven different U-net models based on a combination of Sentinel-1 and Sentinel-2 bands to evaluate the importance of each instrument in the dominant height retrieval. The model outputs allow us to generate a 10 m resolution canopy height map of the whole "Landes de Gascogne" forest area for 2020 with a mean absolute error of 2.02 m on the Test dataset. The best predictions were obtained using all available satellite layers from Sentinel-1 and Sentinel-2 but using only one satellite source also provided good predictions. For all validation datasets in coniferous forests, our model showed better metrics than previous canopy height models available in the same region.
Detecting Hardly Visible Roads in Low-Resolution Satellite Time Series Data
Dec 04, 2019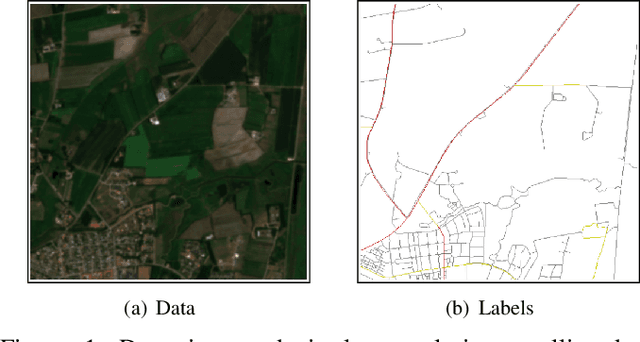
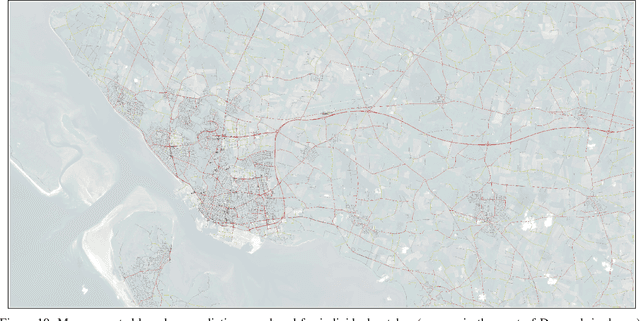
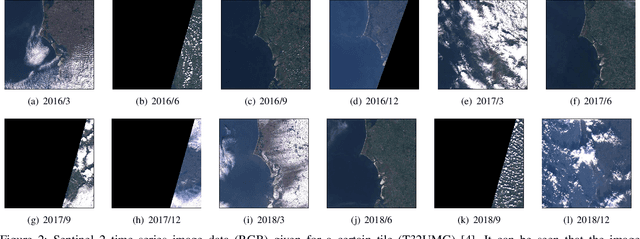
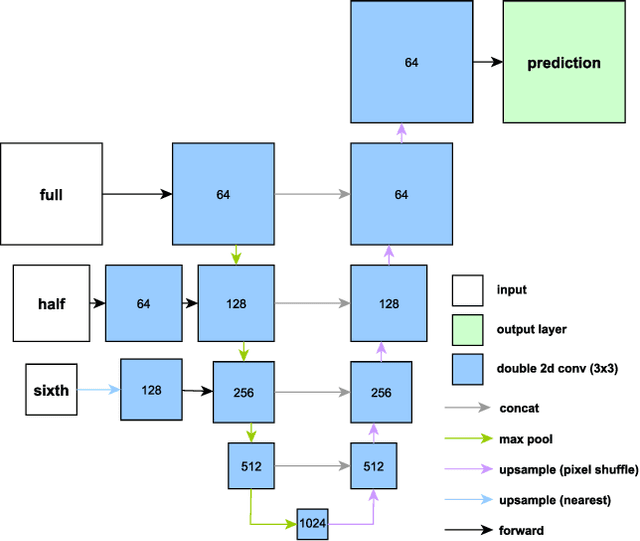
Massive amounts of satellite data have been gathered over time, holding the potential to unveil a spatiotemporal chronicle of the surface of Earth. These data allow scientists to investigate various important issues, such as land use changes, on a global scale. However, not all land-use phenomena are equally visible on satellite imagery. In particular, the creation of an inventory of the planet's road infrastructure remains a challenge, despite being crucial to analyze urbanization patterns and their impact. Towards this end, this work advances data-driven approaches for the automatic identification of roads based on open satellite data. Given the typical resolutions of these historical satellite data, we observe that there is inherent variation in the visibility of different road types. Based on this observation, we propose two deep learning frameworks that extend state-of-the-art deep learning methods by formalizing road detection as an ordinal classification task. In contrast to related schemes, one of the two models also resorts to satellite time series data that are potentially affected by missing data and cloud occlusion. Taking these time series data into account eliminates the need to manually curate datasets of high-quality image tiles, substantially simplifying the application of such models on a global scale. We evaluate our approaches on a dataset that is based on Sentinel~2 satellite imagery and OpenStreetMap vector data. Our results indicate that the proposed models can successfully identify large and medium-sized roads. We also discuss opportunities and challenges related to the detection of roads and other infrastructure on a global scale.