 Add to Chrome
 Add to Firefox
 Add to Edge
SPACE: Sample-cloud Predictive Adaptive Conformal Ellipsoids for Multivariate Time-Series Forecasting
Aug 18, 2026
Modern probabilistic time-series forecasters often express uncertainty through forecast samples. While typically converted into nominal prediction regions using empirical quantiles, these model-implied sets lack formal coverage guarantees and frequently deviate from nominal targets under distribution shift. Existing multivariate conformal methods can calibrate these regions online, but they typically estimate geometry from historical residuals using fixed or accumulating look-back windows. This reliance on the past limits their ability to exploit the instantaneous dependence structure of current predictions and leaves them vulnerable to stale-regime contamination. To address this, we propose SPACE, a conformal wrapper for sample-generating multivariate forecasters. SPACE constructs ellipsoidal joint prediction regions by estimating time-local covariance geometry directly from the current forecast sample cloud, calibrating the region's radius via a dynamic backward window-selection scheme. Across diverse multivariate datasets, probabilistic forecasters, and conformal baselines, SPACE consistently brings realized joint and rolling coverage closer to the nominal target, achieving superior coverage-efficiency tradeoffs relative to competing wrappers.

FinDeepIndicator: Benchmarking Deep Research Agents in End-to-End Financial Indicator Construction
Aug 01, 2026Financial indicators are essential tools for transforming raw financial data into interpretable measures for various downstream tasks, such as valuation, risk assessment, and economic analysis. However, existing financial benchmarks largely focus on answer-level accuracy and often assume that relevant data are already provided, leaving the assessment of the intermediate process of indicator construction underexplored. In this work, we propose FinDeepIndicator, the first benchmark dedicated to evaluating Deep Research (DR) agents in end-to-end financial indicator construction. Specifically, FinDeepIndicator evaluates DR agents across four stages in indicator construction: formula specification, data collection, indicator calculation, and answer generation, and covers fundamental, technical, and macroeconomic indicators organized into 21 fine-grained sub-categories. It contains 3,350 curated question-answer (QA) pairs derived from both U.S. and Chinese markets, 10 years of historical financial data, and 800 listed companies. Extensive experiments on search-equipped Large Language Models (LLMs) and DR agents show that, while LLMs generally perform well in formula specification, their accuracy drops substantially during data retrieval and numerical execution. DR agents consistently outperform search-equipped LLMs, yet remain unreliable in realistic financial analysis settings. These findings provide insights for developing more capable and trustworthy DR agents in finance.
Who Wins Where? Conformal Model Comparison for Local Superiority
Jul 31, 2026Standard model comparison is global, aggregating losses across the covariate space to declare a single winner. This can obscure heterogeneous performance, where different models are preferable in different regions. We introduce conformalized local model comparison, a split-sample framework for constructing calibrated local best-model maps. Given a model comparison score, such as the difference between two squared losses, the method uses three disjoint splits to fit competing models, estimate local centers and scales from out-of-sample scores, and conformally calibrate residual uncertainty. At a target point, the procedure declares a local winner only when a one-sided conformal bound excludes a tie, with the score's sign determining the favored model. We prove finite-sample marginal control for one-sided erroneous declarations on the realized future comparison score, establish pointwise consistency of the localized mean-score estimator away from tie boundaries, show that aggregate comparison can disagree sharply with the prevalence of local superiority, and derive a squared-loss bias--variance decomposition that clarifies how model structure affects local wins. Synthetic and real-data experiments show that the method recovers heterogeneous winner regions, abstains under uncertainty, and yields higher conditional gain than global selection.
FinStressTS: A Parametric Synthetic Benchmark for Time-Series Forecasting in Finance
Jun 02, 2026Financial forecasting is difficult due to low signal-to-noise ratios, latent factors, heavy tails, regime shifts, and jumps. Real-world benchmarks offer limited failure attribution: researchers can observe underperformance, but often cannot isolate why because mechanisms are unobservable and entangled. Real financial data reveal only one realized path, making it difficult to assess tail-risk calibration or data efficiency. We introduce FinStressTS, a mechanism-aware synthetic benchmark that links model behavior to controlled structural causes. FinStressTS comprises 30 diagnostic environments around six mechanism families: volatility clustering, multi-scale persistence, heavy-tailed shocks, regime switching, self-exciting jumps, and zero-inflated processes. We evaluate two tasks: point forecasting, using NMAE across five settings, and probabilistic forecasting, using CRPS under known data-generating mechanisms. We benchmark 15 models, from classical methods (HAR, VAR) to Transformer forecasters (PatchTST, iTransformer) and deep probabilistic architectures (DeepAR, TSFlow), and use learning curves to measure sample efficiency. Our evaluation reveals three insights. First, performance is mechanism-dependent: autoregressive and linear models are highly competitive, and often outperform Transformer-based models, in several volatility-, tail-, and jump-driven environments. Second, distributional alignment matters: parametric probabilistic models such as DeepAR calibrate well in stationary settings, while flexible models can help when distributions become multimodal or sparse. Third, neural models often require more data to match simple baselines, with larger gains mainly when learning latent regimes or complex distributions. FinStressTS provides an open framework for diagnosing failure modes and advancing risk-aware forecasting.
Computer Vision and Metrics Learning for Hypothesis Testing: An Application of Q-Q Plot for Normality Test
Jan 23, 2019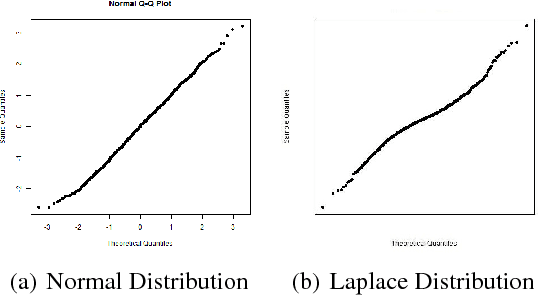
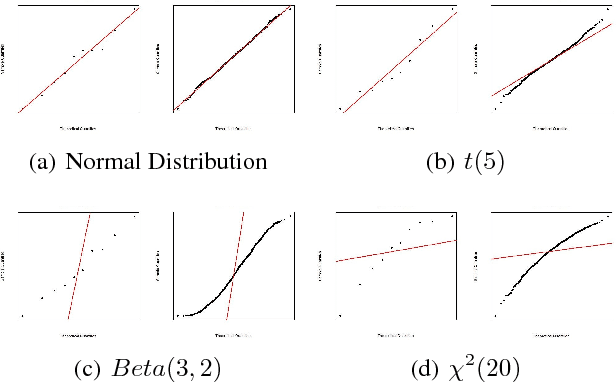
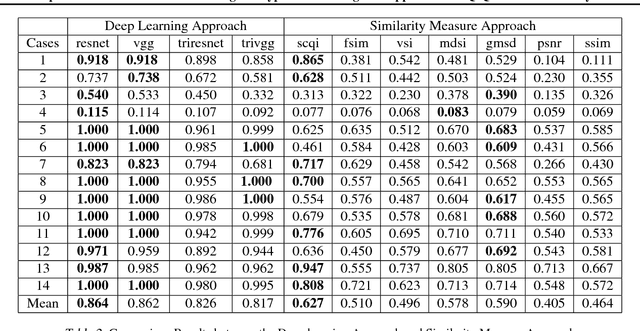
This paper proposes a new procedure to construct test statistics for hypothesis testing by computer vision and metrics learning. The application highlighted in this paper is applying computer vision on Q-Q plot to construct a new test statistic for normality test. Traditionally, there are two families of approaches for verifying the probability distribution of a random variable. Researchers either subjectively assess the Q-Q plot or objectively use a mathematical formula, such as Kolmogorov-Smirnov test, to formally conduct a normality test. Graphical assessment by human beings is not rigorous whereas normality test statistics may not be accurate enough when the uniformly most powerful test does not exist. It may take tens of years for statistician to develop a new and more powerful test statistic. The first step of the proposed method is to apply computer vision techniques, such as pre-trained ResNet, to convert a Q-Q plot into a numerical vector. Next step is to apply metric learning to find an appropriate distance function between a Q-Q plot and the centroid of all Q-Q plots under the null hypothesis, which assumes the target variable is normally distributed. This distance metric is the new test statistic for normality test. Our experimentation results show that the machine-learning-based test statistics can outperform traditional normality tests in all cases, particularly when the sample size is small. This study provides convincing evidence that the proposed method could objectively create a powerful test statistic based on Q-Q plots and this method could be modified to construct many more powerful test statistics for other applications in the future.