 Add to Chrome
 Add to Firefox
 Add to Edge
Gaussian Process Tilted Nonparametric Density Estimation using Fisher Divergence Score Matching
Apr 04, 2025We present three Fisher divergence (FD) minimization algorithms for learning Gaussian process (GP) based score models for lower dimensional density estimation problems. The density is formed by multiplying a base multivariate normal distribution with an exponentiated GP refinement, and so we refer to it as a GP-tilted nonparametric density. By representing the GP part of the score as a linear function using the random Fourier feature (RFF) approximation, we show that all learning problems can be solved in closed form. This includes the basic and noise conditional versions of the Fisher divergence, as well as a novel alternative to noise conditional FD models based on variational inference (VI). Here, we propose using an ELBO-like optimization of the approximate posterior with which we derive a Fisher variational predictive distribution. The RFF representation of the GP, which is functionally equivalent to a single layer neural network score model with cosine activation, provides a unique linear form for which all expectations are in closed form. The Gaussian base also helps with tractability of the VI approximation. We demonstrate our three learning algorithms, as well as a MAP baseline algorithm, on several low dimensional density estimation problems. The closed-form nature of the learning problem removes the reliance on iterative algorithms, making this technique particularly well-suited to large data sets.
MOUNTAINEER: Topology-Driven Visual Analytics for Comparing Local Explanations
Jun 21, 2024With the increasing use of black-box Machine Learning (ML) techniques in critical applications, there is a growing demand for methods that can provide transparency and accountability for model predictions. As a result, a large number of local explainability methods for black-box models have been developed and popularized. However, machine learning explanations are still hard to evaluate and compare due to the high dimensionality, heterogeneous representations, varying scales, and stochastic nature of some of these methods. Topological Data Analysis (TDA) can be an effective method in this domain since it can be used to transform attributions into uniform graph representations, providing a common ground for comparison across different explanation methods. We present a novel topology-driven visual analytics tool, Mountaineer, that allows ML practitioners to interactively analyze and compare these representations by linking the topological graphs back to the original data distribution, model predictions, and feature attributions. Mountaineer facilitates rapid and iterative exploration of ML explanations, enabling experts to gain deeper insights into the explanation techniques, understand the underlying data distributions, and thus reach well-founded conclusions about model behavior. Furthermore, we demonstrate the utility of Mountaineer through two case studies using real-world data. In the first, we show how Mountaineer enabled us to compare black-box ML explanations and discern regions of and causes of disagreements between different explanations. In the second, we demonstrate how the tool can be used to compare and understand ML models themselves. Finally, we conducted interviews with three industry experts to help us evaluate our work.
T-Explainer: A Model-Agnostic Explainability Framework Based on Gradients
Apr 25, 2024The development of machine learning applications has increased significantly in recent years, motivated by the remarkable ability of learning-powered systems to discover and generalize intricate patterns hidden in massive datasets. Modern learning models, while powerful, often exhibit a level of complexity that renders them opaque black boxes, resulting in a notable lack of transparency that hinders our ability to decipher their decision-making processes. Opacity challenges the interpretability and practical application of machine learning, especially in critical domains where understanding the underlying reasons is essential for informed decision-making. Explainable Artificial Intelligence (XAI) rises to meet that challenge, unraveling the complexity of black boxes by providing elucidating explanations. Among the various XAI approaches, feature attribution/importance XAI stands out for its capacity to delineate the significance of input features in the prediction process. However, most existing attribution methods have limitations, such as instability, when divergent explanations may result from similar or even the same instance. In this work, we introduce T-Explainer, a novel local additive attribution explainer based on Taylor expansion endowed with desirable properties, such as local accuracy and consistency, while stable over multiple runs. We demonstrate T-Explainer's effectiveness through benchmark experiments with well-known attribution methods. In addition, T-Explainer is developed as a comprehensive XAI framework comprising quantitative metrics to assess and visualize attribution explanations.
Gaussian Process Neural Additive Models
Feb 19, 2024Deep neural networks have revolutionized many fields, but their black-box nature also occasionally prevents their wider adoption in fields such as healthcare and finance, where interpretable and explainable models are required. The recent development of Neural Additive Models (NAMs) is a significant step in the direction of interpretable deep learning for tabular datasets. In this paper, we propose a new subclass of NAMs that use a single-layer neural network construction of the Gaussian process via random Fourier features, which we call Gaussian Process Neural Additive Models (GP-NAM). GP-NAMs have the advantage of a convex objective function and number of trainable parameters that grows linearly with feature dimensionality. It suffers no loss in performance compared to deeper NAM approaches because GPs are well-suited for learning complex non-parametric univariate functions. We demonstrate the performance of GP-NAM on several tabular datasets, showing that it achieves comparable or better performance in both classification and regression tasks with a large reduction in the number of parameters.
The Disagreement Problem in Faithfulness Metrics
Nov 13, 2023The field of explainable artificial intelligence (XAI) aims to explain how black-box machine learning models work. Much of the work centers around the holy grail of providing post-hoc feature attributions to any model architecture. While the pace of innovation around novel methods has slowed down, the question remains of how to choose a method, and how to make it fit for purpose. Recently, efforts around benchmarking XAI methods have suggested metrics for that purpose -- but there are many choices. That bounty of choice still leaves an end user unclear on how to proceed. This paper focuses on comparing metrics with the aim of measuring faithfulness of local explanations on tabular classification problems -- and shows that the current metrics don't agree; leaving users unsure how to choose the most faithful explanations.
Calibrate: Interactive Analysis of Probabilistic Model Output
Jul 27, 2022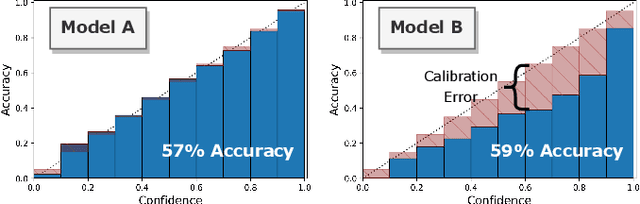
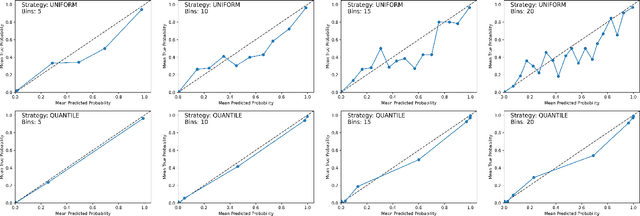
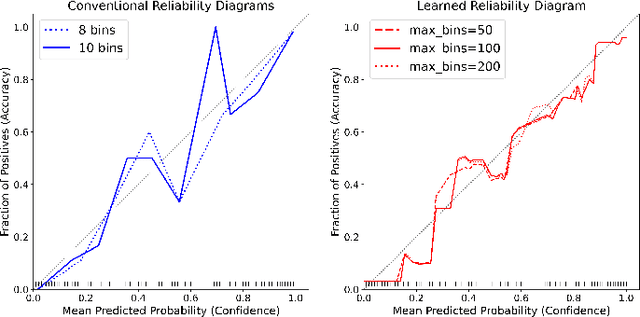
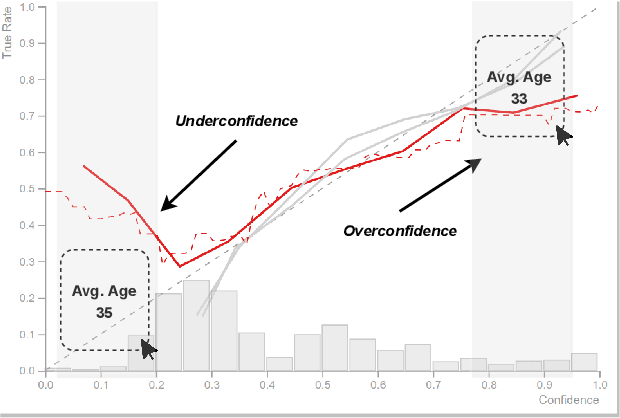
Analyzing classification model performance is a crucial task for machine learning practitioners. While practitioners often use count-based metrics derived from confusion matrices, like accuracy, many applications, such as weather prediction, sports betting, or patient risk prediction, rely on a classifier's predicted probabilities rather than predicted labels. In these instances, practitioners are concerned with producing a calibrated model, that is, one which outputs probabilities that reflect those of the true distribution. Model calibration is often analyzed visually, through static reliability diagrams, however, the traditional calibration visualization may suffer from a variety of drawbacks due to the strong aggregations it necessitates. Furthermore, count-based approaches are unable to sufficiently analyze model calibration. We present Calibrate, an interactive reliability diagram that addresses the aforementioned issues. Calibrate constructs a reliability diagram that is resistant to drawbacks in traditional approaches, and allows for interactive subgroup analysis and instance-level inspection. We demonstrate the utility of Calibrate through use cases on both real-world and synthetic data. We further validate Calibrate by presenting the results of a think-aloud experiment with data scientists who routinely analyze model calibration.
BASED-XAI: Breaking Ablation Studies Down for Explainable Artificial Intelligence
Jul 12, 2022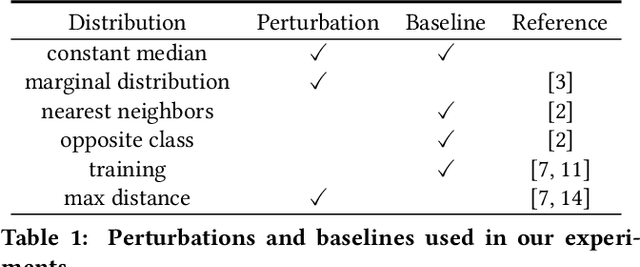
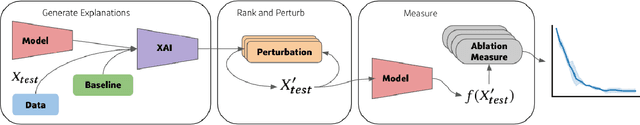
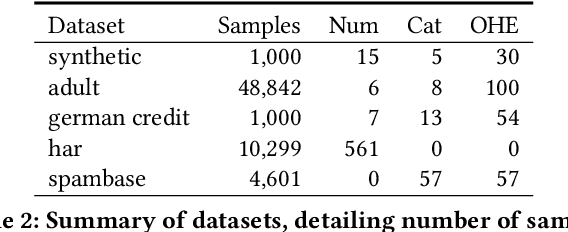
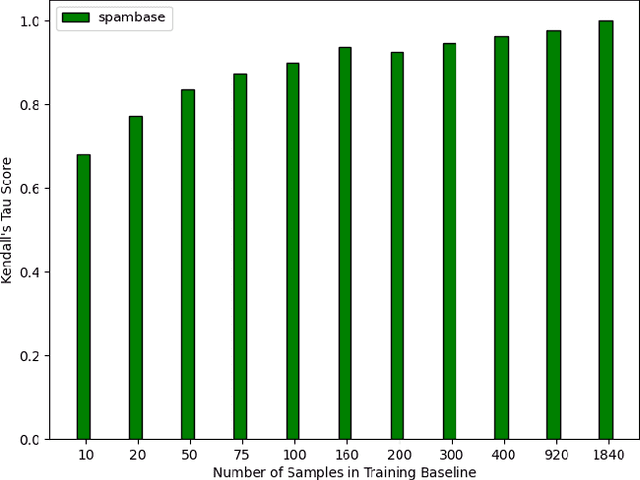
Explainable artificial intelligence (XAI) methods lack ground truth. In its place, method developers have relied on axioms to determine desirable properties for their explanations' behavior. For high stakes uses of machine learning that require explainability, it is not sufficient to rely on axioms as the implementation, or its usage, can fail to live up to the ideal. As a result, there exists active research on validating the performance of XAI methods. The need for validation is especially magnified in domains with a reliance on XAI. A procedure frequently used to assess their utility, and to some extent their fidelity, is an ablation study. By perturbing the input variables in rank order of importance, the goal is to assess the sensitivity of the model's performance. Perturbing important variables should correlate with larger decreases in measures of model capability than perturbing less important features. While the intent is clear, the actual implementation details have not been studied rigorously for tabular data. Using five datasets, three XAI methods, four baselines, and three perturbations, we aim to show 1) how varying perturbations and adding simple guardrails can help to avoid potentially flawed conclusions, 2) how treatment of categorical variables is an important consideration in both post-hoc explainability and ablation studies, and 3) how to identify useful baselines for XAI methods and viable perturbations for ablation studies.
Visual Exploration of Machine Learning Model Behavior with Hierarchical Surrogate Rule Sets
Jan 19, 2022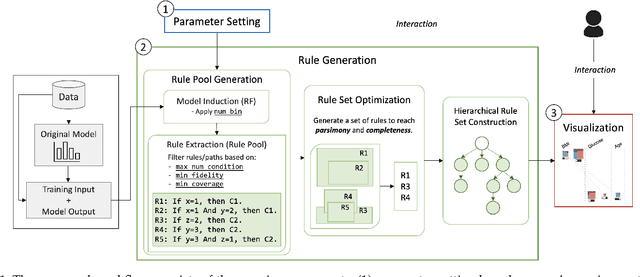
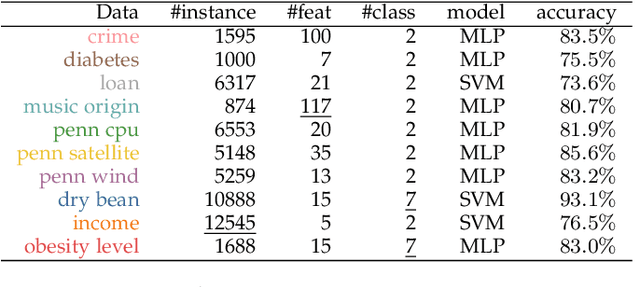
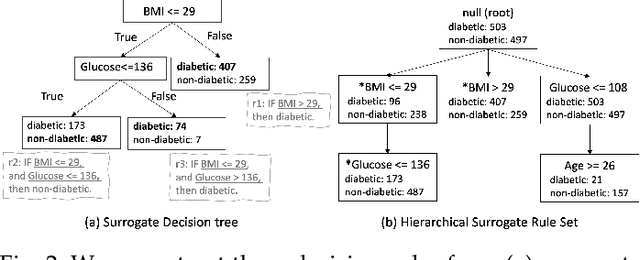
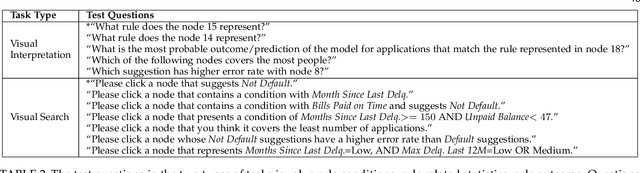
One of the potential solutions for model interpretation is to train a surrogate model: a more transparent model that approximates the behavior of the model to be explained. Typically, classification rules or decision trees are used due to the intelligibility of their logic-based expressions. However, decision trees can grow too deep and rule sets can become too large to approximate a complex model. Unlike paths on a decision tree that must share ancestor nodes (conditions), rules are more flexible. However, the unstructured visual representation of rules makes it hard to make inferences across rules. To address these issues, we present a workflow that includes novel algorithmic and interactive solutions. First, we present Hierarchical Surrogate Rules (HSR), an algorithm that generates hierarchical rules based on user-defined parameters. We also contribute SuRE, a visual analytics (VA) system that integrates HSR and interactive surrogate rule visualizations. Particularly, we present a novel feature-aligned tree to overcome the shortcomings of existing rule visualizations. We evaluate the algorithm in terms of parameter sensitivity, time performance, and comparison with surrogate decision trees and find that it scales reasonably well and outperforms decision trees in many respects. We also evaluate the visualization and the VA system by a usability study with 24 volunteers and an observational study with 7 domain experts. Our investigation shows that the participants can use feature-aligned trees to perform non-trivial tasks with very high accuracy. We also discuss many interesting observations that can be useful for future research on designing effective rule-based VA systems.
Topological Representations of Local Explanations
Jan 06, 2022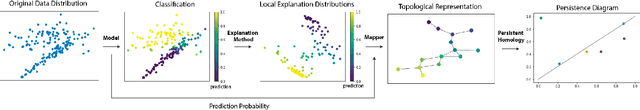
Local explainability methods -- those which seek to generate an explanation for each prediction -- are becoming increasingly prevalent due to the need for practitioners to rationalize their model outputs. However, comparing local explainability methods is difficult since they each generate outputs in various scales and dimensions. Furthermore, due to the stochastic nature of some explainability methods, it is possible for different runs of a method to produce contradictory explanations for a given observation. In this paper, we propose a topology-based framework to extract a simplified representation from a set of local explanations. We do so by first modeling the relationship between the explanation space and the model predictions as a scalar function. Then, we compute the topological skeleton of this function. This topological skeleton acts as a signature for such functions, which we use to compare different explanation methods. We demonstrate that our framework can not only reliably identify differences between explainability techniques but also provides stable representations. Then, we show how our framework can be used to identify appropriate parameters for local explainability methods. Our framework is simple, does not require complex optimizations, and can be broadly applied to most local explanation methods. We believe the practicality and versatility of our approach will help promote topology-based approaches as a tool for understanding and comparing explanation methods.
Counterfactual Explanations via Latent Space Projection and Interpolation
Dec 02, 2021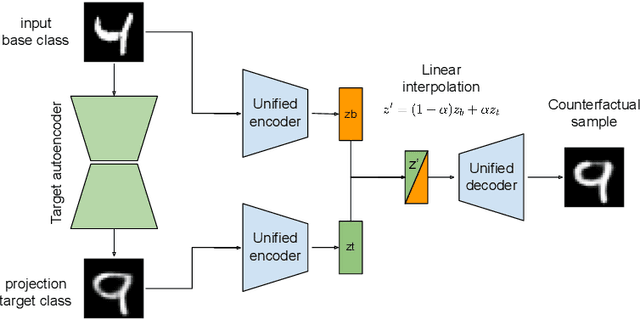
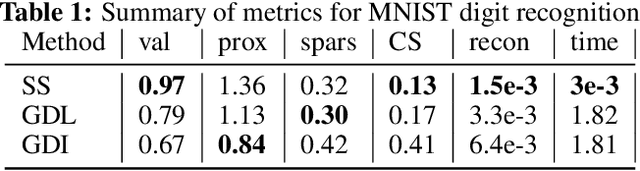
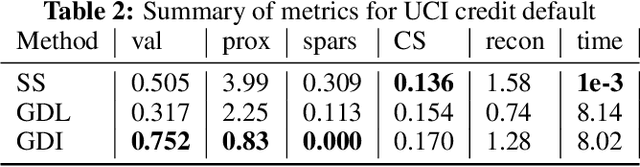
Counterfactual explanations represent the minimal change to a data sample that alters its predicted classification, typically from an unfavorable initial class to a desired target class. Counterfactuals help answer questions such as "what needs to change for this application to get accepted for a loan?". A number of recently proposed approaches to counterfactual generation give varying definitions of "plausible" counterfactuals and methods to generate them. However, many of these methods are computationally intensive and provide unconvincing explanations. Here we introduce SharpShooter, a method for binary classification that starts by creating a projected version of the input that classifies as the target class. Counterfactual candidates are then generated in latent space on the interpolation line between the input and its projection. We then demonstrate that our framework translates core characteristics of a sample to its counterfactual through the use of learned representations. Furthermore, we show that SharpShooter is competitive across common quality metrics on tabular and image datasets while being orders of magnitude faster than two comparable methods and excels at measures of realism, making it well-suited for high velocity machine learning applications which require timely explanations.