 Add to Chrome
 Add to Firefox
 Add to Edge
MOUNTAINEER: Topology-Driven Visual Analytics for Comparing Local Explanations
Jun 21, 2024With the increasing use of black-box Machine Learning (ML) techniques in critical applications, there is a growing demand for methods that can provide transparency and accountability for model predictions. As a result, a large number of local explainability methods for black-box models have been developed and popularized. However, machine learning explanations are still hard to evaluate and compare due to the high dimensionality, heterogeneous representations, varying scales, and stochastic nature of some of these methods. Topological Data Analysis (TDA) can be an effective method in this domain since it can be used to transform attributions into uniform graph representations, providing a common ground for comparison across different explanation methods. We present a novel topology-driven visual analytics tool, Mountaineer, that allows ML practitioners to interactively analyze and compare these representations by linking the topological graphs back to the original data distribution, model predictions, and feature attributions. Mountaineer facilitates rapid and iterative exploration of ML explanations, enabling experts to gain deeper insights into the explanation techniques, understand the underlying data distributions, and thus reach well-founded conclusions about model behavior. Furthermore, we demonstrate the utility of Mountaineer through two case studies using real-world data. In the first, we show how Mountaineer enabled us to compare black-box ML explanations and discern regions of and causes of disagreements between different explanations. In the second, we demonstrate how the tool can be used to compare and understand ML models themselves. Finally, we conducted interviews with three industry experts to help us evaluate our work.
ESTA: An Esports Trajectory and Action Dataset
Sep 20, 2022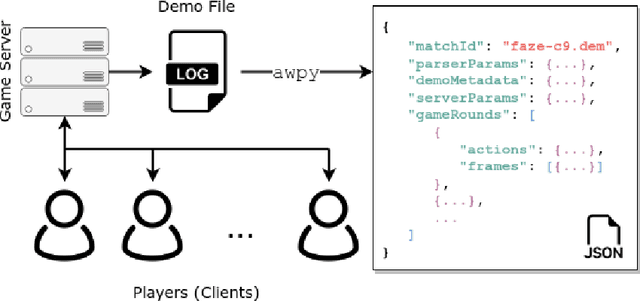
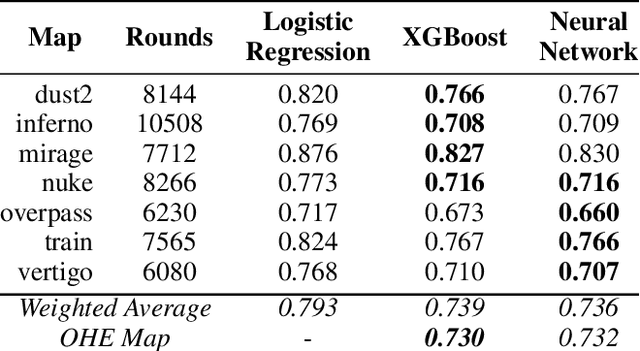
Sports, due to their global reach and impact-rich prediction tasks, are an exciting domain to deploy machine learning models. However, data from conventional sports is often unsuitable for research use due to its size, veracity, and accessibility. To address these issues, we turn to esports, a growing domain that encompasses video games played in a capacity similar to conventional sports. Since esports data is acquired through server logs rather than peripheral sensors, esports provides a unique opportunity to obtain a massive collection of clean and detailed spatiotemporal data, similar to those collected in conventional sports. To parse esports data, we develop awpy, an open-source esports game log parsing library that can extract player trajectories and actions from game logs. Using awpy, we parse 8.6m actions, 7.9m game frames, and 417k trajectories from 1,558 game logs from professional Counter-Strike tournaments to create the Esports Trajectory and Actions (ESTA) dataset. ESTA is one of the largest and most granular publicly available sports data sets to date. We use ESTA to develop benchmarks for win prediction using player-specific information. The ESTA data is available at https://github.com/pnxenopoulos/esta and awpy is made public through PyPI.
Graph Neural Networks to Predict Sports Outcomes
Jul 28, 2022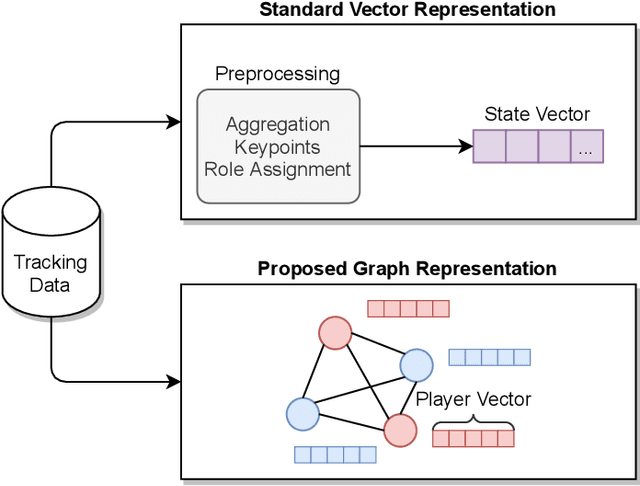
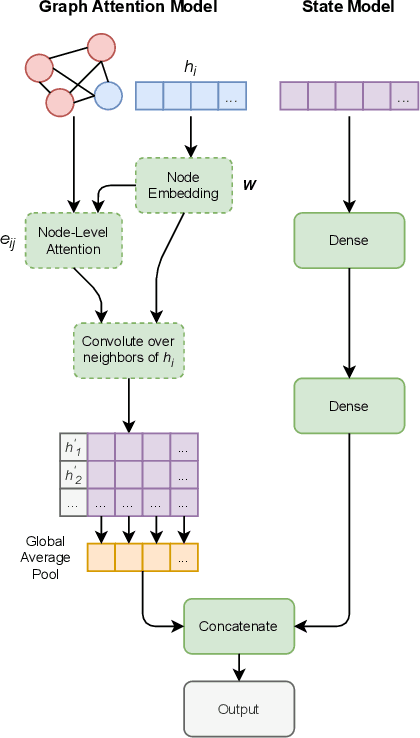
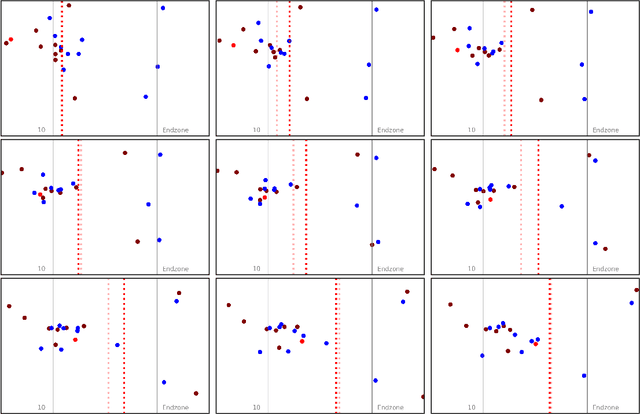
Predicting outcomes in sports is important for teams, leagues, bettors, media, and fans. Given the growing amount of player tracking data, sports analytics models are increasingly utilizing spatially-derived features built upon player tracking data. However, player-specific information, such as location, cannot readily be included as features themselves, since common modeling techniques rely on vector input. Accordingly, spatially-derived features are commonly constructed in relation to anchor objects, such as the distance to a ball or goal, through global feature aggregations, or via role-assignment schemes, where players are designated a distinct role in the game. In doing so, we sacrifice inter-player and local relationships in favor of global ones. To address this issue, we introduce a sport-agnostic graph-based representation of game states. We then use our proposed graph representation as input to graph neural networks to predict sports outcomes. Our approach preserves permutation invariance and allows for flexible player interaction weights. We demonstrate how our method provides statistically significant improvements over the state of the art for prediction tasks in both American football and esports, reducing test set loss by 9% and 20%, respectively. Additionally, we show how our model can be used to answer "what if" questions in sports and to visualize relationships between players.
Calibrate: Interactive Analysis of Probabilistic Model Output
Jul 27, 2022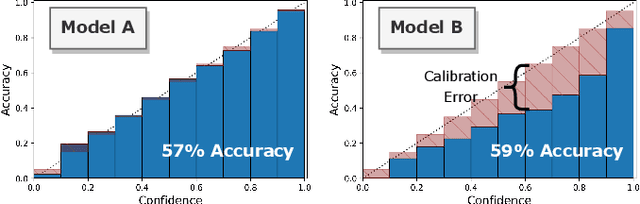
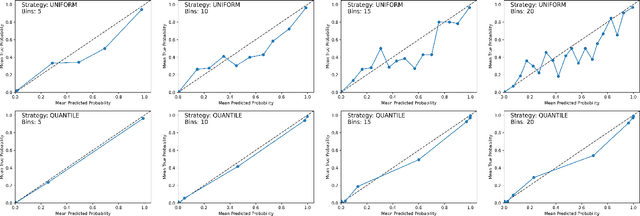
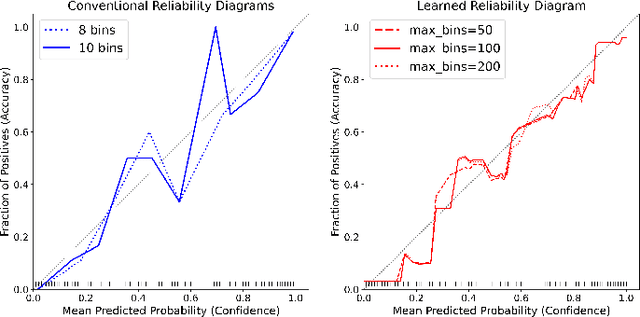
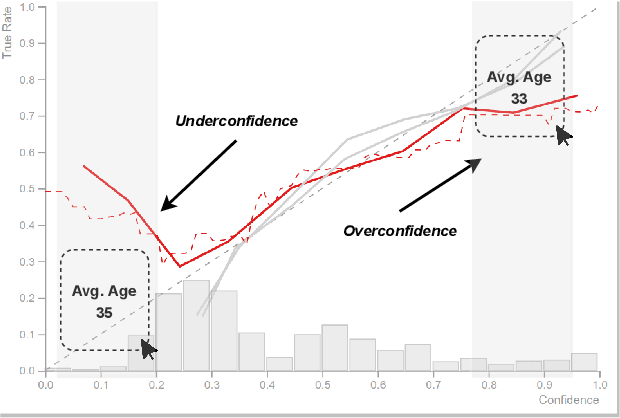
Analyzing classification model performance is a crucial task for machine learning practitioners. While practitioners often use count-based metrics derived from confusion matrices, like accuracy, many applications, such as weather prediction, sports betting, or patient risk prediction, rely on a classifier's predicted probabilities rather than predicted labels. In these instances, practitioners are concerned with producing a calibrated model, that is, one which outputs probabilities that reflect those of the true distribution. Model calibration is often analyzed visually, through static reliability diagrams, however, the traditional calibration visualization may suffer from a variety of drawbacks due to the strong aggregations it necessitates. Furthermore, count-based approaches are unable to sufficiently analyze model calibration. We present Calibrate, an interactive reliability diagram that addresses the aforementioned issues. Calibrate constructs a reliability diagram that is resistant to drawbacks in traditional approaches, and allows for interactive subgroup analysis and instance-level inspection. We demonstrate the utility of Calibrate through use cases on both real-world and synthetic data. We further validate Calibrate by presenting the results of a think-aloud experiment with data scientists who routinely analyze model calibration.
Topological Representations of Local Explanations
Jan 06, 2022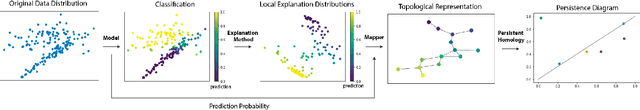
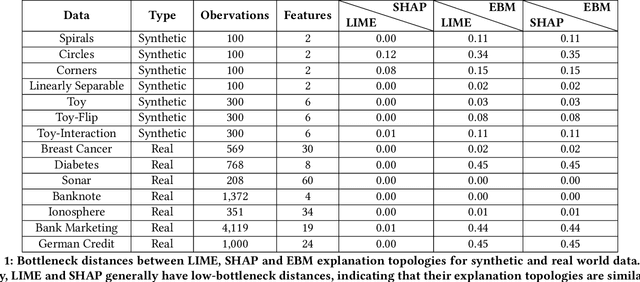
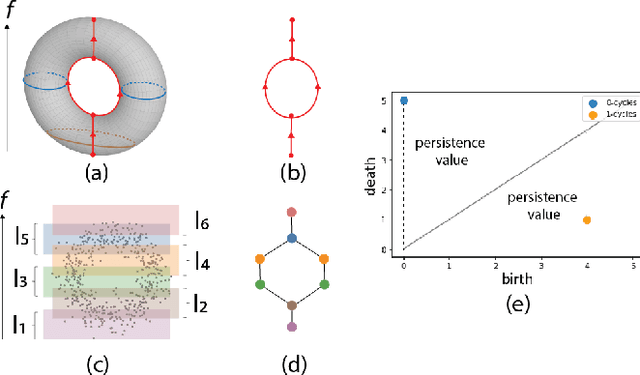
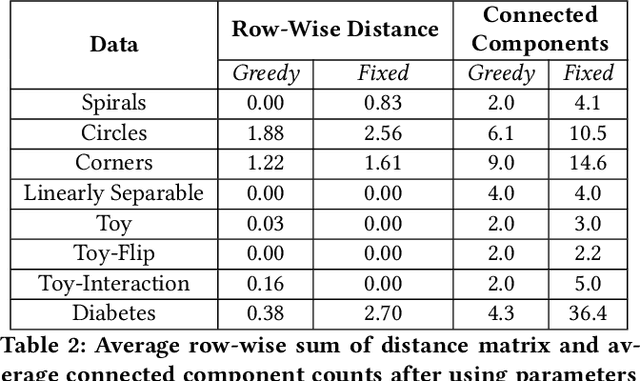
Local explainability methods -- those which seek to generate an explanation for each prediction -- are becoming increasingly prevalent due to the need for practitioners to rationalize their model outputs. However, comparing local explainability methods is difficult since they each generate outputs in various scales and dimensions. Furthermore, due to the stochastic nature of some explainability methods, it is possible for different runs of a method to produce contradictory explanations for a given observation. In this paper, we propose a topology-based framework to extract a simplified representation from a set of local explanations. We do so by first modeling the relationship between the explanation space and the model predictions as a scalar function. Then, we compute the topological skeleton of this function. This topological skeleton acts as a signature for such functions, which we use to compare different explanation methods. We demonstrate that our framework can not only reliably identify differences between explainability techniques but also provides stable representations. Then, we show how our framework can be used to identify appropriate parameters for local explainability methods. Our framework is simple, does not require complex optimizations, and can be broadly applied to most local explanation methods. We believe the practicality and versatility of our approach will help promote topology-based approaches as a tool for understanding and comparing explanation methods.
Optimal Team Economic Decisions in Counter-Strike
Sep 20, 2021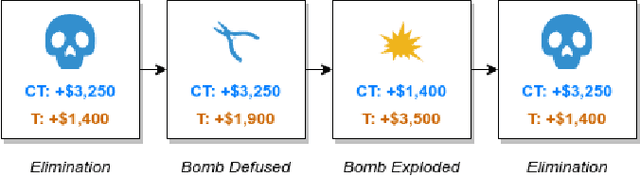
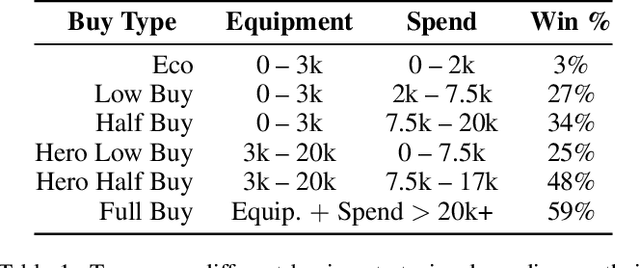
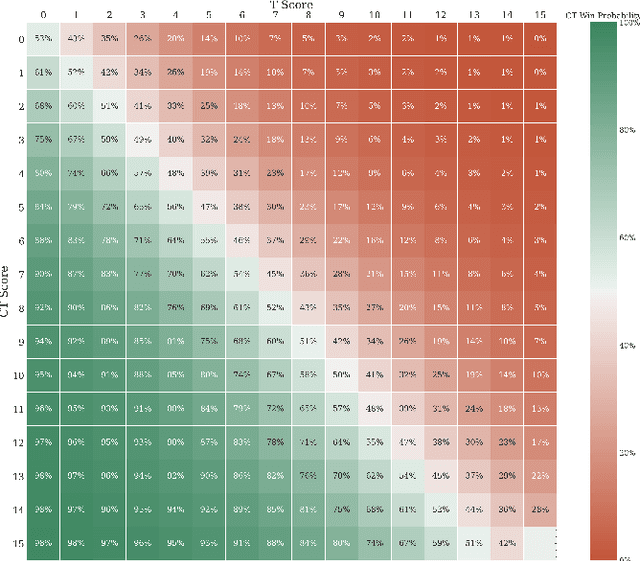
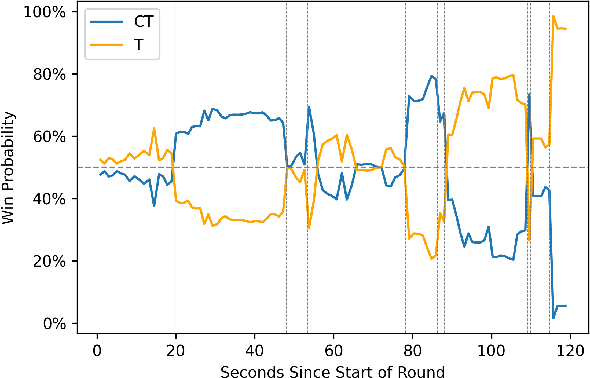
The outputs of win probability models are often used to evaluate player actions. However, in some sports, such as the popular esport Counter-Strike, there exist important team-level decisions. For example, at the beginning of each round in a Counter-Strike game, teams decide how much of their in-game dollars to spend on equipment. Because the dollars are a scarce resource, different strategies have emerged concerning how teams should spend in particular situations. To assess team purchasing decisions in-game, we introduce a game-level win probability model to predict a team's chance of winning a game at the beginning of a given round. We consider features such as team scores, equipment, money, and spending decisions. Using our win probability model, we investigate optimal team spending decisions for important game scenarios. We identify a pattern of sub-optimal decision-making for CSGO teams. Finally, we introduce a metric, Optimal Spending Error (OSE), to rank teams by how closely their spending decisions follow our predicted optimal spending decisions.
Bandit Modeling of Map Selection in Counter-Strike: Global Offensive
Jun 14, 2021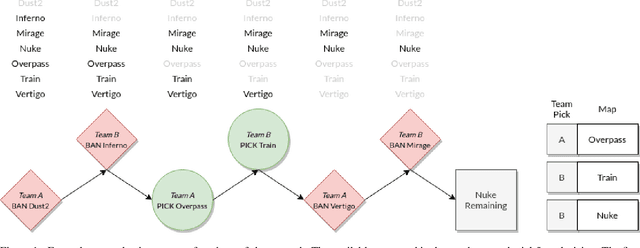
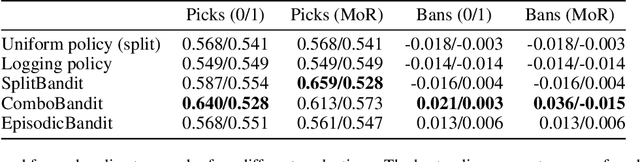
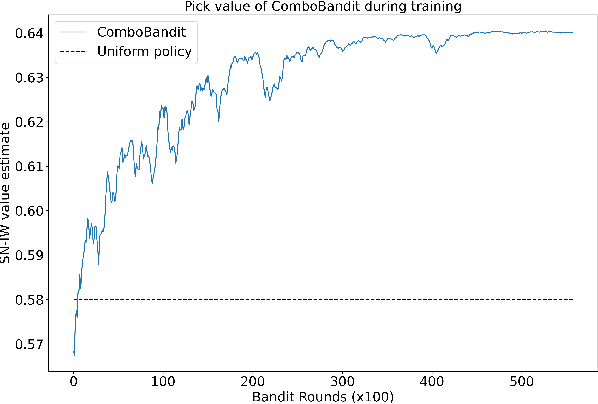
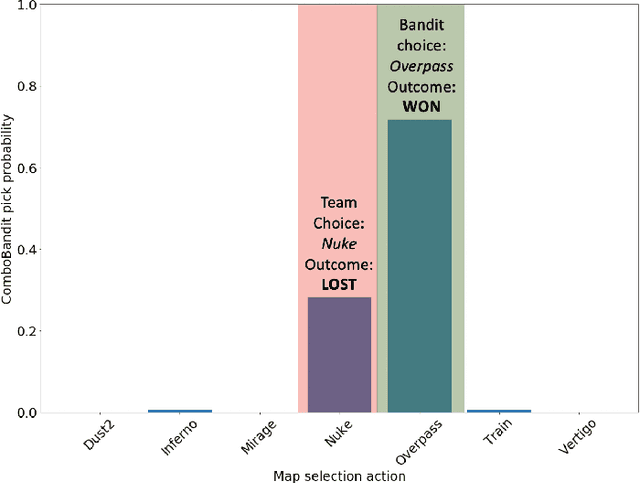
Many esports use a pick and ban process to define the parameters of a match before it starts. In Counter-Strike: Global Offensive (CSGO) matches, two teams first pick and ban maps, or virtual worlds, to play. Teams typically ban and pick maps based on a variety of factors, such as banning maps which they do not practice, or choosing maps based on the team's recent performance. We introduce a contextual bandit framework to tackle the problem of map selection in CSGO and to investigate teams' pick and ban decision-making. Using a data set of over 3,500 CSGO matches and over 25,000 map selection decisions, we consider different framings for the problem, different contexts, and different reward metrics. We find that teams have suboptimal map choice policies with respect to both picking and banning. We also define an approach for rewarding bans, which has not been explored in the bandit setting, and find that incorporating ban rewards improves model performance. Finally, we determine that usage of our model could improve teams' predicted map win probability by up to 11% and raise overall match win probabilities by 19.8% for evenly-matched teams.
Valuing Player Actions in Counter-Strike: Global Offensive
Nov 04, 2020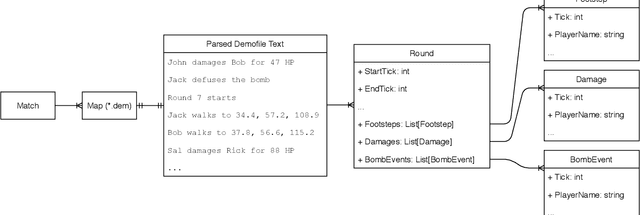
Esports, despite its expanding interest, lacks fundamental sports analytics resources such as accessible data or proven and reproducible analytical frameworks. Even Counter-Strike: Global Offensive (CSGO), the second most popular esport, suffers from these problems. Thus, quantitative evaluation of CSGO players, a task important to teams, media, bettors and fans, is difficult. To address this, we introduce (1) a data model for CSGO with an open-source implementation; (2) a graph distance measure for defining distances in CSGO; and (3) a context-aware framework to value players' actions based on changes in their team's chances of winning. Using over 70 million in-game CSGO events, we demonstrate our framework's consistency and independence compared to existing valuation frameworks. We also provide use cases demonstrating high-impact play identification and uncertainty estimation.
Introducing DeepBalance: Random Deep Belief Network Ensembles to Address Class Imbalance
Nov 15, 2017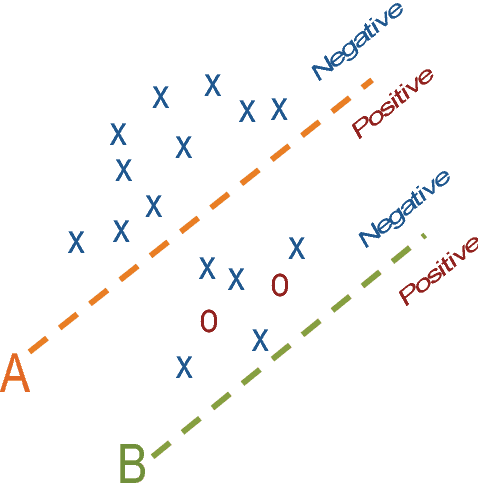
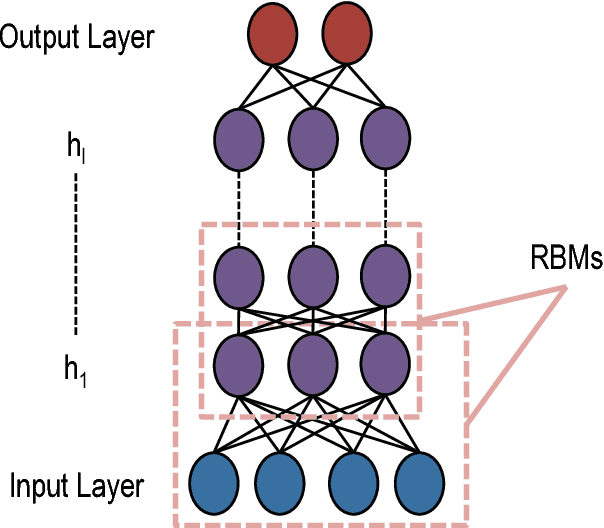
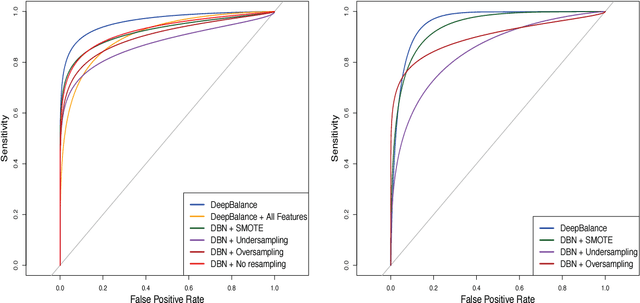
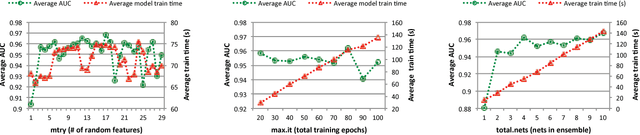
Class imbalance problems manifest in domains such as financial fraud detection or network intrusion analysis, where the prevalence of one class is much higher than another. Typically, practitioners are more interested in predicting the minority class than the majority class as the minority class may carry a higher misclassification cost. However, classifier performance deteriorates in the face of class imbalance as oftentimes classifiers may predict every point as the majority class. Methods for dealing with class imbalance include cost-sensitive learning or resampling techniques. In this paper, we introduce DeepBalance, an ensemble of deep belief networks trained with balanced bootstraps and random feature selection. We demonstrate that our proposed method outperforms baseline resampling methods such as SMOTE and under- and over-sampling in metrics such as AUC and sensitivity when applied to a highly imbalanced financial transaction data. Additionally, we explore performance and training time implications of various model parameters. Furthermore, we show that our model is easily parallelizable, which can reduce training times. Finally, we present an implementation of DeepBalance in R.