 Add to Chrome
 Add to Firefox
 Add to Edge
Satori: Towards Proactive AR Assistant with Belief-Desire-Intention User Modeling
Oct 22, 2024


Augmented Reality assistance are increasingly popular for supporting users with tasks like assembly and cooking. However, current practice typically provide reactive responses initialized from user requests, lacking consideration of rich contextual and user-specific information. To address this limitation, we propose a novel AR assistance system, Satori, that models both user states and environmental contexts to deliver proactive guidance. Our system combines the Belief-Desire-Intention (BDI) model with a state-of-the-art multi-modal large language model (LLM) to infer contextually appropriate guidance. The design is informed by two formative studies involving twelve experts. A sixteen within-subject study find that Satori achieves performance comparable to an designer-created Wizard-of-Oz (WoZ) system without relying on manual configurations or heuristics, thereby enhancing generalizability, reusability and opening up new possibilities for AR assistance.
ARPOV: Expanding Visualization of Object Detection in AR with Panoramic Mosaic Stitching
Oct 01, 2024


As the uses of augmented reality (AR) become more complex and widely available, AR applications will increasingly incorporate intelligent features that require developers to understand the user's behavior and surrounding environment (e.g. an intelligent assistant). Such applications rely on video captured by an AR headset, which often contains disjointed camera movement with a limited field of view that cannot capture the full scope of what the user sees at any given time. Moreover, standard methods of visualizing object detection model outputs are limited to capturing objects within a single frame and timestep, and therefore fail to capture the temporal and spatial context that is often necessary for various domain applications. We propose ARPOV, an interactive visual analytics tool for analyzing object detection model outputs tailored to video captured by an AR headset that maximizes user understanding of model performance. The proposed tool leverages panorama stitching to expand the view of the environment while automatically filtering undesirable frames, and includes interactive features that facilitate object detection model debugging. ARPOV was designed as part of a collaboration between visualization researchers and machine learning and AR experts; we validate our design choices through interviews with 5 domain experts.
TopoMap++: A faster and more space efficient technique to compute projections with topological guarantees
Sep 11, 2024


High-dimensional data, characterized by many features, can be difficult to visualize effectively. Dimensionality reduction techniques, such as PCA, UMAP, and t-SNE, address this challenge by projecting the data into a lower-dimensional space while preserving important relationships. TopoMap is another technique that excels at preserving the underlying structure of the data, leading to interpretable visualizations. In particular, TopoMap maps the high-dimensional data into a visual space, guaranteeing that the 0-dimensional persistence diagram of the Rips filtration of the visual space matches the one from the high-dimensional data. However, the original TopoMap algorithm can be slow and its layout can be too sparse for large and complex datasets. In this paper, we propose three improvements to TopoMap: 1) a more space-efficient layout, 2) a significantly faster implementation, and 3) a novel TreeMap-based representation that makes use of the topological hierarchy to aid the exploration of the projections. These advancements make TopoMap, now referred to as TopoMap++, a more powerful tool for visualizing high-dimensional data which we demonstrate through different use case scenarios.
MOUNTAINEER: Topology-Driven Visual Analytics for Comparing Local Explanations
Jun 21, 2024With the increasing use of black-box Machine Learning (ML) techniques in critical applications, there is a growing demand for methods that can provide transparency and accountability for model predictions. As a result, a large number of local explainability methods for black-box models have been developed and popularized. However, machine learning explanations are still hard to evaluate and compare due to the high dimensionality, heterogeneous representations, varying scales, and stochastic nature of some of these methods. Topological Data Analysis (TDA) can be an effective method in this domain since it can be used to transform attributions into uniform graph representations, providing a common ground for comparison across different explanation methods. We present a novel topology-driven visual analytics tool, Mountaineer, that allows ML practitioners to interactively analyze and compare these representations by linking the topological graphs back to the original data distribution, model predictions, and feature attributions. Mountaineer facilitates rapid and iterative exploration of ML explanations, enabling experts to gain deeper insights into the explanation techniques, understand the underlying data distributions, and thus reach well-founded conclusions about model behavior. Furthermore, we demonstrate the utility of Mountaineer through two case studies using real-world data. In the first, we show how Mountaineer enabled us to compare black-box ML explanations and discern regions of and causes of disagreements between different explanations. In the second, we demonstrate how the tool can be used to compare and understand ML models themselves. Finally, we conducted interviews with three industry experts to help us evaluate our work.
POEM: Interactive Prompt Optimization for Enhancing Multimodal Reasoning of Large Language Models
Jun 06, 2024


Large language models (LLMs) have exhibited impressive abilities for multimodal content comprehension and reasoning with proper prompting in zero- or few-shot settings. Despite the proliferation of interactive systems developed to support prompt engineering for LLMs across various tasks, most have primarily focused on textual or visual inputs, thus neglecting the complex interplay between modalities within multimodal inputs. This oversight hinders the development of effective prompts that guide model multimodal reasoning processes by fully exploiting the rich context provided by multiple modalities. In this paper, we present POEM, a visual analytics system to facilitate efficient prompt engineering for enhancing the multimodal reasoning performance of LLMs. The system enables users to explore the interaction patterns across modalities at varying levels of detail for a comprehensive understanding of the multimodal knowledge elicited by various prompts. Through diverse recommendations of demonstration examples and instructional principles, POEM supports users in iteratively crafting and refining prompts to better align and enhance model knowledge with human insights. The effectiveness and efficiency of our system are validated through two case studies and interviews with experts.
Your Co-Workers Matter: Evaluating Collaborative Capabilities of Language Models in Blocks World
Mar 30, 2024


Language agents that interact with the world on their own have great potential for automating digital tasks. While large language model (LLM) agents have made progress in understanding and executing tasks such as textual games and webpage control, many real-world tasks also require collaboration with humans or other LLMs in equal roles, which involves intent understanding, task coordination, and communication. To test LLM's ability to collaborate, we design a blocks-world environment, where two agents, each having unique goals and skills, build a target structure together. To complete the goals, they can act in the world and communicate in natural language. Under this environment, we design increasingly challenging settings to evaluate different collaboration perspectives, from independent to more complex, dependent tasks. We further adopt chain-of-thought prompts that include intermediate reasoning steps to model the partner's state and identify and correct execution errors. Both human-machine and machine-machine experiments show that LLM agents have strong grounding capacities, and our approach significantly improves the evaluation metric.
ARTiST: Automated Text Simplification for Task Guidance in Augmented Reality
Feb 29, 2024


Text presented in augmented reality provides in-situ, real-time information for users. However, this content can be challenging to apprehend quickly when engaging in cognitively demanding AR tasks, especially when it is presented on a head-mounted display. We propose ARTiST, an automatic text simplification system that uses a few-shot prompt and GPT-3 models to specifically optimize the text length and semantic content for augmented reality. Developed out of a formative study that included seven users and three experts, our system combines a customized error calibration model with a few-shot prompt to integrate the syntactic, lexical, elaborative, and content simplification techniques, and generate simplified AR text for head-worn displays. Results from a 16-user empirical study showed that ARTiST lightens the cognitive load and improves performance significantly over both unmodified text and text modified via traditional methods. Our work constitutes a step towards automating the optimization of batch text data for readability and performance in augmented reality.
Granularity at Scale: Estimating Neighborhood Well-Being from High-Resolution Orthographic Imagery and Hybrid Learning
Sep 28, 2023


Many areas of the world are without basic information on the well-being of the residing population due to limitations in existing data collection methods. Overhead images obtained remotely, such as from satellite or aircraft, can help serve as windows into the state of life on the ground and help "fill in the gaps" where community information is sparse, with estimates at smaller geographic scales requiring higher resolution sensors. Concurrent with improved sensor resolutions, recent advancements in machine learning and computer vision have made it possible to quickly extract features from and detect patterns in image data, in the process correlating these features with other information. In this work, we explore how well two approaches, a supervised convolutional neural network and semi-supervised clustering based on bag-of-visual-words, estimate population density, median household income, and educational attainment of individual neighborhoods from publicly available high-resolution imagery of cities throughout the United States. Results and analyses indicate that features extracted from the imagery can accurately estimate the density (R$^2$ up to 0.81) of neighborhoods, with the supervised approach able to explain about half the variation in a population's income and education. In addition to the presented approaches serving as a basis for further geographic generalization, the novel semi-supervised approach provides a foundation for future work seeking to estimate fine-scale information from overhead imagery without the need for label data.
ESTA: An Esports Trajectory and Action Dataset
Sep 20, 2022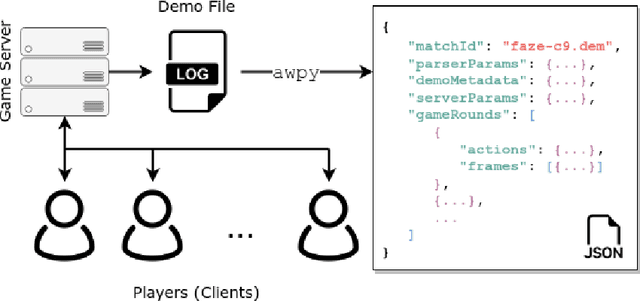
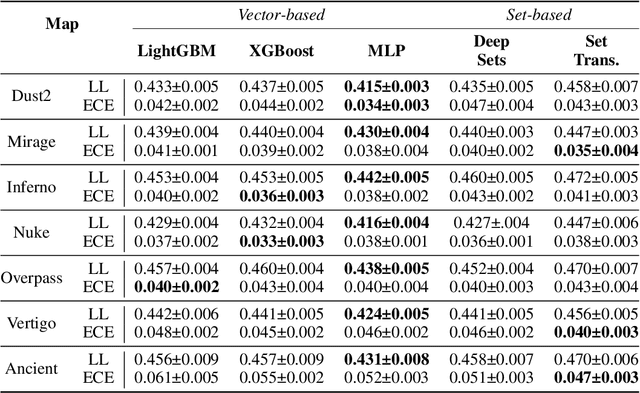
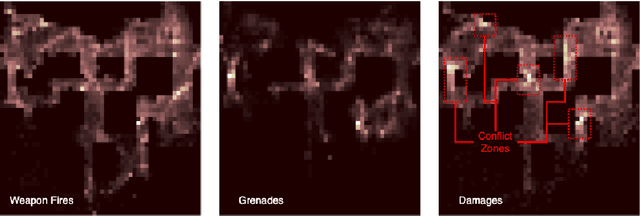
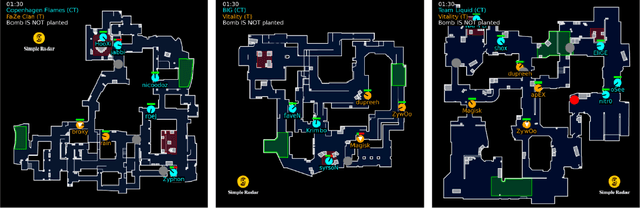
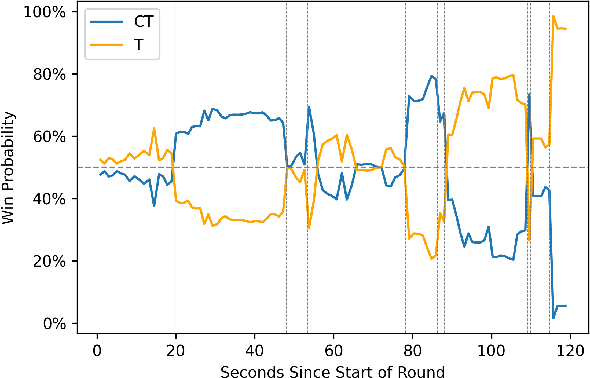
Sports, due to their global reach and impact-rich prediction tasks, are an exciting domain to deploy machine learning models. However, data from conventional sports is often unsuitable for research use due to its size, veracity, and accessibility. To address these issues, we turn to esports, a growing domain that encompasses video games played in a capacity similar to conventional sports. Since esports data is acquired through server logs rather than peripheral sensors, esports provides a unique opportunity to obtain a massive collection of clean and detailed spatiotemporal data, similar to those collected in conventional sports. To parse esports data, we develop awpy, an open-source esports game log parsing library that can extract player trajectories and actions from game logs. Using awpy, we parse 8.6m actions, 7.9m game frames, and 417k trajectories from 1,558 game logs from professional Counter-Strike tournaments to create the Esports Trajectory and Actions (ESTA) dataset. ESTA is one of the largest and most granular publicly available sports data sets to date. We use ESTA to develop benchmarks for win prediction using player-specific information. The ESTA data is available at https://github.com/pnxenopoulos/esta and awpy is made public through PyPI.
Graph Neural Networks to Predict Sports Outcomes
Jul 28, 2022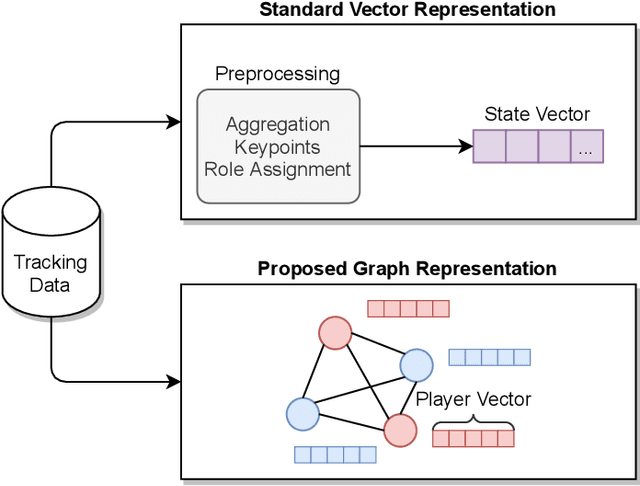
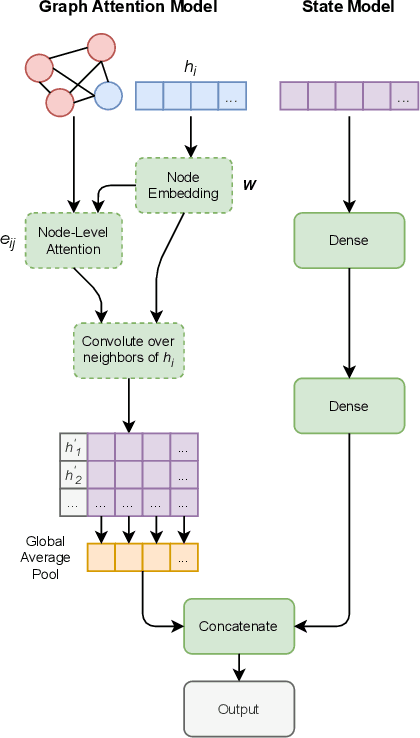
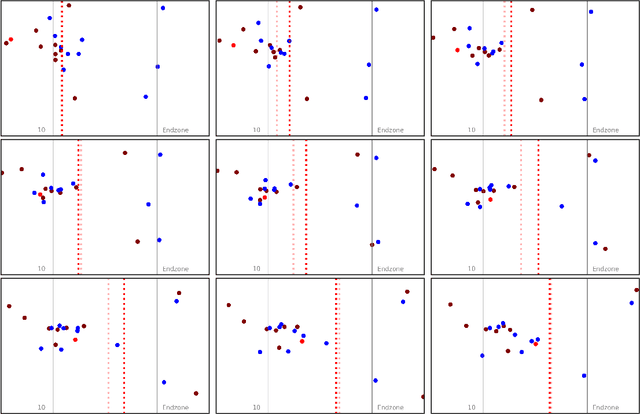
Predicting outcomes in sports is important for teams, leagues, bettors, media, and fans. Given the growing amount of player tracking data, sports analytics models are increasingly utilizing spatially-derived features built upon player tracking data. However, player-specific information, such as location, cannot readily be included as features themselves, since common modeling techniques rely on vector input. Accordingly, spatially-derived features are commonly constructed in relation to anchor objects, such as the distance to a ball or goal, through global feature aggregations, or via role-assignment schemes, where players are designated a distinct role in the game. In doing so, we sacrifice inter-player and local relationships in favor of global ones. To address this issue, we introduce a sport-agnostic graph-based representation of game states. We then use our proposed graph representation as input to graph neural networks to predict sports outcomes. Our approach preserves permutation invariance and allows for flexible player interaction weights. We demonstrate how our method provides statistically significant improvements over the state of the art for prediction tasks in both American football and esports, reducing test set loss by 9% and 20%, respectively. Additionally, we show how our model can be used to answer "what if" questions in sports and to visualize relationships between players.