 Add to Chrome
 Add to Firefox
 Add to Edge
TopoMap++: A faster and more space efficient technique to compute projections with topological guarantees
Sep 11, 2024


High-dimensional data, characterized by many features, can be difficult to visualize effectively. Dimensionality reduction techniques, such as PCA, UMAP, and t-SNE, address this challenge by projecting the data into a lower-dimensional space while preserving important relationships. TopoMap is another technique that excels at preserving the underlying structure of the data, leading to interpretable visualizations. In particular, TopoMap maps the high-dimensional data into a visual space, guaranteeing that the 0-dimensional persistence diagram of the Rips filtration of the visual space matches the one from the high-dimensional data. However, the original TopoMap algorithm can be slow and its layout can be too sparse for large and complex datasets. In this paper, we propose three improvements to TopoMap: 1) a more space-efficient layout, 2) a significantly faster implementation, and 3) a novel TreeMap-based representation that makes use of the topological hierarchy to aid the exploration of the projections. These advancements make TopoMap, now referred to as TopoMap++, a more powerful tool for visualizing high-dimensional data which we demonstrate through different use case scenarios.
MOUNTAINEER: Topology-Driven Visual Analytics for Comparing Local Explanations
Jun 21, 2024With the increasing use of black-box Machine Learning (ML) techniques in critical applications, there is a growing demand for methods that can provide transparency and accountability for model predictions. As a result, a large number of local explainability methods for black-box models have been developed and popularized. However, machine learning explanations are still hard to evaluate and compare due to the high dimensionality, heterogeneous representations, varying scales, and stochastic nature of some of these methods. Topological Data Analysis (TDA) can be an effective method in this domain since it can be used to transform attributions into uniform graph representations, providing a common ground for comparison across different explanation methods. We present a novel topology-driven visual analytics tool, Mountaineer, that allows ML practitioners to interactively analyze and compare these representations by linking the topological graphs back to the original data distribution, model predictions, and feature attributions. Mountaineer facilitates rapid and iterative exploration of ML explanations, enabling experts to gain deeper insights into the explanation techniques, understand the underlying data distributions, and thus reach well-founded conclusions about model behavior. Furthermore, we demonstrate the utility of Mountaineer through two case studies using real-world data. In the first, we show how Mountaineer enabled us to compare black-box ML explanations and discern regions of and causes of disagreements between different explanations. In the second, we demonstrate how the tool can be used to compare and understand ML models themselves. Finally, we conducted interviews with three industry experts to help us evaluate our work.
Exploring the Relationship Between Feature Attribution Methods and Model Performance
May 22, 2024

Machine learning and deep learning models are pivotal in educational contexts, particularly in predicting student success. Despite their widespread application, a significant gap persists in comprehending the factors influencing these models' predictions, especially in explainability within education. This work addresses this gap by employing nine distinct explanation methods and conducting a comprehensive analysis to explore the correlation between the agreement among these methods in generating explanations and the predictive model's performance. Applying Spearman's correlation, our findings reveal a very strong correlation between the model's performance and the agreement level observed among the explanation methods.
T-Explainer: A Model-Agnostic Explainability Framework Based on Gradients
Apr 25, 2024The development of machine learning applications has increased significantly in recent years, motivated by the remarkable ability of learning-powered systems to discover and generalize intricate patterns hidden in massive datasets. Modern learning models, while powerful, often exhibit a level of complexity that renders them opaque black boxes, resulting in a notable lack of transparency that hinders our ability to decipher their decision-making processes. Opacity challenges the interpretability and practical application of machine learning, especially in critical domains where understanding the underlying reasons is essential for informed decision-making. Explainable Artificial Intelligence (XAI) rises to meet that challenge, unraveling the complexity of black boxes by providing elucidating explanations. Among the various XAI approaches, feature attribution/importance XAI stands out for its capacity to delineate the significance of input features in the prediction process. However, most existing attribution methods have limitations, such as instability, when divergent explanations may result from similar or even the same instance. In this work, we introduce T-Explainer, a novel local additive attribution explainer based on Taylor expansion endowed with desirable properties, such as local accuracy and consistency, while stable over multiple runs. We demonstrate T-Explainer's effectiveness through benchmark experiments with well-known attribution methods. In addition, T-Explainer is developed as a comprehensive XAI framework comprising quantitative metrics to assess and visualize attribution explanations.
TensorAnalyzer: Identification of Urban Patterns in Big Cities using Non-Negative Tensor Factorization
Oct 06, 2022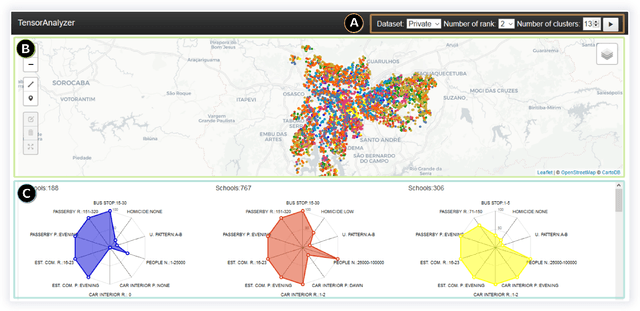
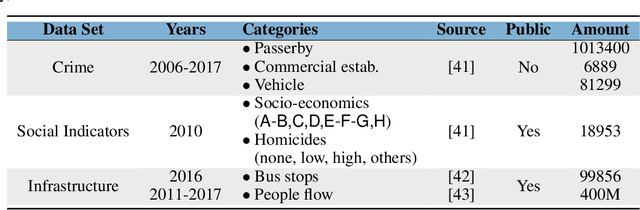
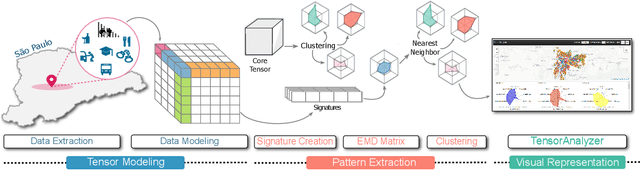
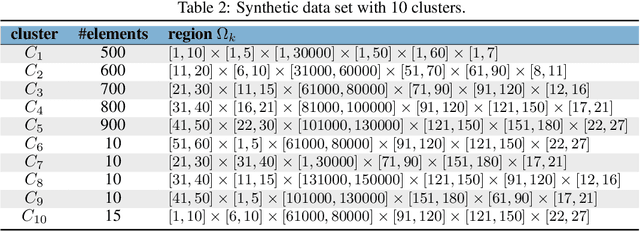
Extracting relevant urban patterns from multiple data sources can be difficult using classical clustering algorithms since we have to make a suitable setup of the hyperparameters of the algorithms and deal with outliers. It should be addressed correctly to help urban planners in the decision-making process for the further development of a big city. For instance, experts' main interest in criminology is comprehending the relationship between crimes and the socio-economic characteristics at specific georeferenced locations. In addition, the classical clustering algorithms take little notice of the intricate spatial correlations in georeferenced data sources. This paper presents a new approach to detecting the most relevant urban patterns from multiple data sources based on tensor decomposition. Compared to classical methods, the proposed approach's performance is attested to validate the identified patterns' quality. The result indicates that the approach can effectively identify functional patterns to characterize the data set for further analysis in achieving good clustering quality. Furthermore, we developed a generic framework named TensorAnalyzer, where the effectiveness and usefulness of the proposed methodology are tested by a set of experiments and a real-world case study showing the relationship between the crime events around schools and students performance and other variables involved in the analysis.
Calibrate: Interactive Analysis of Probabilistic Model Output
Jul 27, 2022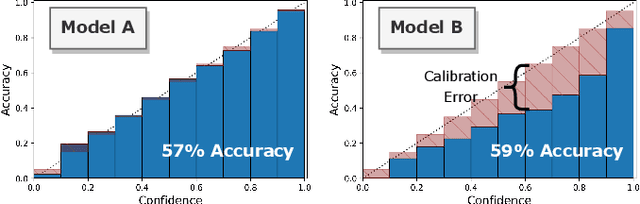
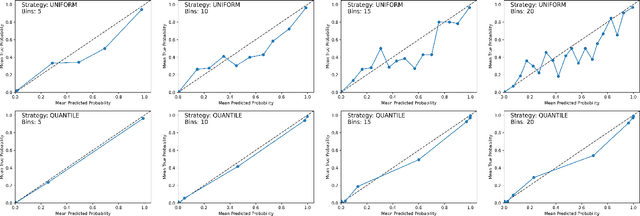
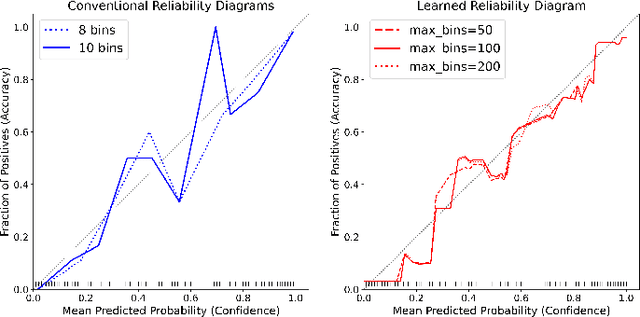
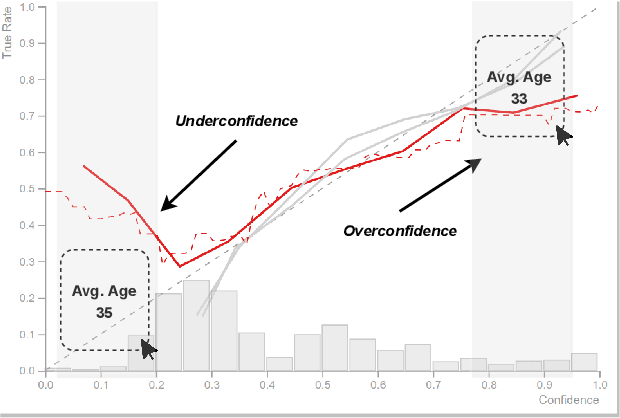
Analyzing classification model performance is a crucial task for machine learning practitioners. While practitioners often use count-based metrics derived from confusion matrices, like accuracy, many applications, such as weather prediction, sports betting, or patient risk prediction, rely on a classifier's predicted probabilities rather than predicted labels. In these instances, practitioners are concerned with producing a calibrated model, that is, one which outputs probabilities that reflect those of the true distribution. Model calibration is often analyzed visually, through static reliability diagrams, however, the traditional calibration visualization may suffer from a variety of drawbacks due to the strong aggregations it necessitates. Furthermore, count-based approaches are unable to sufficiently analyze model calibration. We present Calibrate, an interactive reliability diagram that addresses the aforementioned issues. Calibrate constructs a reliability diagram that is resistant to drawbacks in traditional approaches, and allows for interactive subgroup analysis and instance-level inspection. We demonstrate the utility of Calibrate through use cases on both real-world and synthetic data. We further validate Calibrate by presenting the results of a think-aloud experiment with data scientists who routinely analyze model calibration.
Topological Representations of Local Explanations
Jan 06, 2022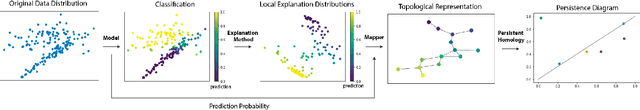
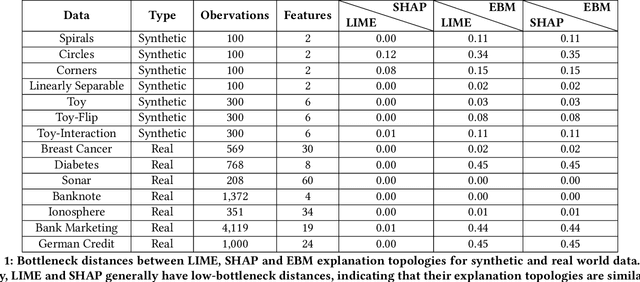
Local explainability methods -- those which seek to generate an explanation for each prediction -- are becoming increasingly prevalent due to the need for practitioners to rationalize their model outputs. However, comparing local explainability methods is difficult since they each generate outputs in various scales and dimensions. Furthermore, due to the stochastic nature of some explainability methods, it is possible for different runs of a method to produce contradictory explanations for a given observation. In this paper, we propose a topology-based framework to extract a simplified representation from a set of local explanations. We do so by first modeling the relationship between the explanation space and the model predictions as a scalar function. Then, we compute the topological skeleton of this function. This topological skeleton acts as a signature for such functions, which we use to compare different explanation methods. We demonstrate that our framework can not only reliably identify differences between explainability techniques but also provides stable representations. Then, we show how our framework can be used to identify appropriate parameters for local explainability methods. Our framework is simple, does not require complex optimizations, and can be broadly applied to most local explanation methods. We believe the practicality and versatility of our approach will help promote topology-based approaches as a tool for understanding and comparing explanation methods.
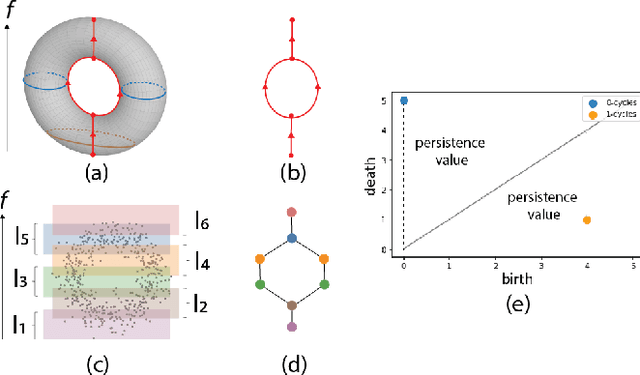
TopoMap: A 0-dimensional Homology Preserving Projection of High-Dimensional Data
Sep 03, 2020
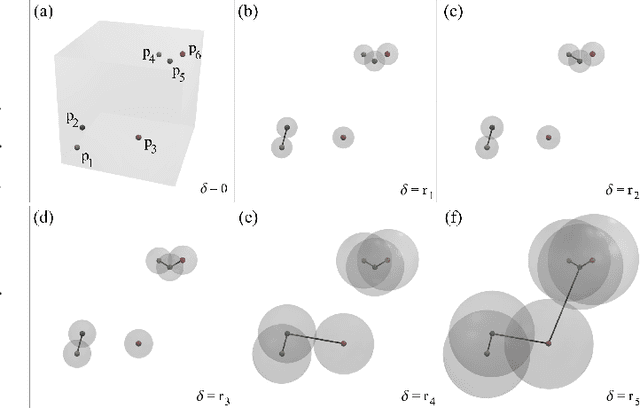
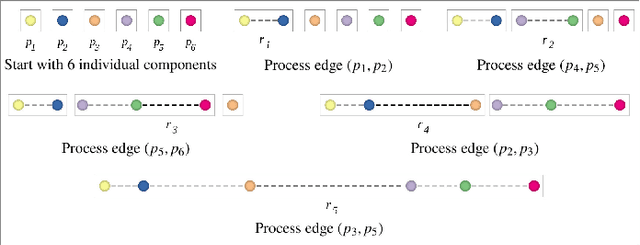
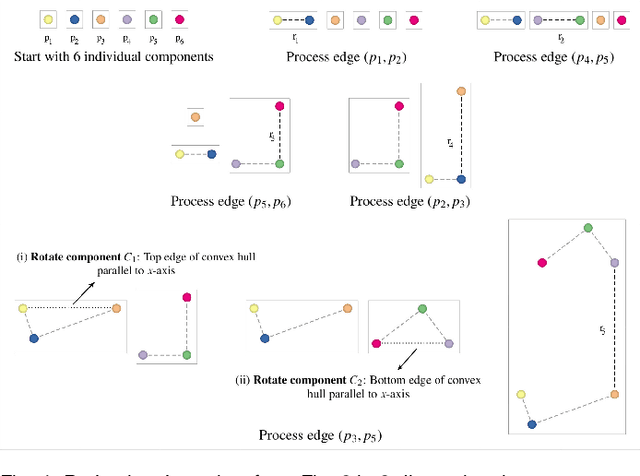
Multidimensional Projection is a fundamental tool for high-dimensional data analytics and visualization. With very few exceptions, projection techniques are designed to map data from a high-dimensional space to a visual space so as to preserve some dissimilarity (similarity) measure, such as the Euclidean distance for example. In fact, although adopting distinct mathematical formulations designed to favor different aspects of the data, most multidimensional projection methods strive to preserve dissimilarity measures that encapsulate geometric properties such as distances or the proximity relation between data objects. However, geometric relations are not the only interesting property to be preserved in a projection. For instance, the analysis of particular structures such as clusters and outliers could be more reliably performed if the mapping process gives some guarantee as to topological invariants such as connected components and loops. This paper introduces TopoMap, a novel projection technique which provides topological guarantees during the mapping process. In particular, the proposed method performs the mapping from a high-dimensional space to a visual space, while preserving the 0-dimensional persistence diagram of the Rips filtration of the high-dimensional data, ensuring that the filtrations generate the same connected components when applied to the original as well as projected data. The presented case studies show that the topological guarantee provided by TopoMap not only brings confidence to the visual analytic process but also can be used to assist in the assessment of other projection methods.