 Add to Chrome
 Add to Firefox
 Add to Edge
Challenges and recommendations for Electronic Health Records data extraction and preparation for dynamic prediction modelling in hospitalized patients -- a practical guide
Jan 17, 2025Dynamic predictive modeling using electronic health record (EHR) data has gained significant attention in recent years. The reliability and trustworthiness of such models depend heavily on the quality of the underlying data, which is largely determined by the stages preceding the model development: data extraction from EHR systems and data preparation. We list over forty challenges encountered during these stages and provide actionable recommendations for addressing them. These challenges are organized into four categories: cohort definition, outcome definition, feature engineering, and data cleaning. This list is designed to serve as a practical guide for data extraction engineers and researchers, supporting better practices and improving the quality and real-world applicability of dynamic prediction models in clinical settings.
Performance evaluation of predictive AI models to support medical decisions: Overview and guidance
Dec 13, 2024


A myriad of measures to illustrate performance of predictive artificial intelligence (AI) models have been proposed in the literature. Selecting appropriate performance measures is essential for predictive AI models that are developed to be used in medical practice, because poorly performing models may harm patients and lead to increased costs. We aim to assess the merits of classic and contemporary performance measures when validating predictive AI models for use in medical practice. We focus on models with a binary outcome. We discuss 32 performance measures covering five performance domains (discrimination, calibration, overall, classification, and clinical utility) along with accompanying graphical assessments. The first four domains cover statistical performance, the fifth domain covers decision-analytic performance. We explain why two key characteristics are important when selecting which performance measures to assess: (1) whether the measure's expected value is optimized when it is calculated using the correct probabilities (i.e., a "proper" measure), and (2) whether they reflect either purely statistical performance or decision-analytic performance by properly considering misclassification costs. Seventeen measures exhibit both characteristics, fourteen measures exhibited one characteristic, and one measure possessed neither characteristic (the F1 measure). All classification measures (such as classification accuracy and F1) are improper for clinically relevant decision thresholds other than 0.5 or the prevalence. We recommend the following measures and plots as essential to report: AUROC, calibration plot, a clinical utility measure such as net benefit with decision curve analysis, and a plot with probability distributions per outcome category.
missForestPredict -- Missing data imputation for prediction settings
Jul 02, 2024Prediction models are used to predict an outcome based on input variables. Missing data in input variables often occurs at model development and at prediction time. The missForestPredict R package proposes an adaptation of the missForest imputation algorithm that is fast, user-friendly and tailored for prediction settings. The algorithm iteratively imputes variables using random forests until a convergence criterion (unified for continuous and categorical variables and based on the out-of-bag error) is met. The imputation models are saved for each variable and iteration and can be applied later to new observations at prediction time. The missForestPredict package offers extended error monitoring, control over variables used in the imputation and custom initialization. This allows users to tailor the imputation to their specific needs. The missForestPredict algorithm is compared to mean/mode imputation, linear regression imputation, mice, k-nearest neighbours, bagging, miceRanger and IterativeImputer on eight simulated datasets with simulated missingness (48 scenarios) and eight large public datasets using different prediction models. missForestPredict provides competitive results in prediction settings within short computation times.
Comparison of static and dynamic random forests models for EHR data in the presence of competing risks: predicting central line-associated bloodstream infection
Apr 24, 2024


Prognostic outcomes related to hospital admissions typically do not suffer from censoring, and can be modeled either categorically or as time-to-event. Competing events are common but often ignored. We compared the performance of random forest (RF) models to predict the risk of central line-associated bloodstream infections (CLABSI) using different outcome operationalizations. We included data from 27478 admissions to the University Hospitals Leuven, covering 30862 catheter episodes (970 CLABSI, 1466 deaths and 28426 discharges) to build static and dynamic RF models for binary (CLABSI vs no CLABSI), multinomial (CLABSI, discharge, death or no event), survival (time to CLABSI) and competing risks (time to CLABSI, discharge or death) outcomes to predict the 7-day CLABSI risk. We evaluated model performance across 100 train/test splits. Performance of binary, multinomial and competing risks models was similar: AUROC was 0.74 for baseline predictions, rose to 0.78 for predictions at day 5 in the catheter episode, and decreased thereafter. Survival models overestimated the risk of CLABSI (E:O ratios between 1.2 and 1.6), and had AUROCs about 0.01 lower than other models. Binary and multinomial models had lowest computation times. Models including multiple outcome events (multinomial and competing risks) display a different internal structure compared to binary and survival models. In the absence of censoring, complex modelling choices do not considerably improve the predictive performance compared to a binary model for CLABSI prediction in our studied settings. Survival models censoring the competing events at their time of occurrence should be avoided.
Understanding random forests and overfitting: a visualization and simulation study
Feb 28, 2024Random forests have become popular for clinical risk prediction modelling. In a case study on predicting ovarian malignancy, we observed training c-statistics close to 1. Although this suggests overfitting, performance was competitive on test data. We aimed to understand the behaviour of random forests by (1) visualizing data space in three real world case studies and (2) a simulation study. For the case studies, risk estimates were visualised using heatmaps in a 2-dimensional subspace. The simulation study included 48 logistic data generating mechanisms (DGM), varying the predictor distribution, the number of predictors, the correlation between predictors, the true c-statistic and the strength of true predictors. For each DGM, 1000 training datasets of size 200 or 4000 were simulated and RF models trained with minimum node size 2 or 20 using ranger package, resulting in 192 scenarios in total. The visualizations suggested that the model learned spikes of probability around events in the training set. A cluster of events created a bigger peak, isolated events local peaks. In the simulation study, median training c-statistics were between 0.97 and 1 unless there were 4 or 16 binary predictors with minimum node size 20. Median test c-statistics were higher with higher events per variable, higher minimum node size, and binary predictors. Median training slopes were always above 1, and were not correlated with median test slopes across scenarios (correlation -0.11). Median test slopes were higher with higher true c-statistic, higher minimum node size, and higher sample size. Random forests learn local probability peaks that often yield near perfect training c-statistics without strongly affecting c-statistics on test data. When the aim is probability estimation, the simulation results go against the common recommendation to use fully grown trees in random forest models.
Understanding metric-related pitfalls in image analysis validation
Feb 09, 2023Validation metrics are key for the reliable tracking of scientific progress and for bridging the current chasm between artificial intelligence (AI) research and its translation into practice. However, increasing evidence shows that particularly in image analysis, metrics are often chosen inadequately in relation to the underlying research problem. This could be attributed to a lack of accessibility of metric-related knowledge: While taking into account the individual strengths, weaknesses, and limitations of validation metrics is a critical prerequisite to making educated choices, the relevant knowledge is currently scattered and poorly accessible to individual researchers. Based on a multi-stage Delphi process conducted by a multidisciplinary expert consortium as well as extensive community feedback, the present work provides the first reliable and comprehensive common point of access to information on pitfalls related to validation metrics in image analysis. Focusing on biomedical image analysis but with the potential of transfer to other fields, the addressed pitfalls generalize across application domains and are categorized according to a newly created, domain-agnostic taxonomy. To facilitate comprehension, illustrations and specific examples accompany each pitfall. As a structured body of information accessible to researchers of all levels of expertise, this work enhances global comprehension of a key topic in image analysis validation.
Metrics reloaded: Pitfalls and recommendations for image analysis validation
Jun 03, 2022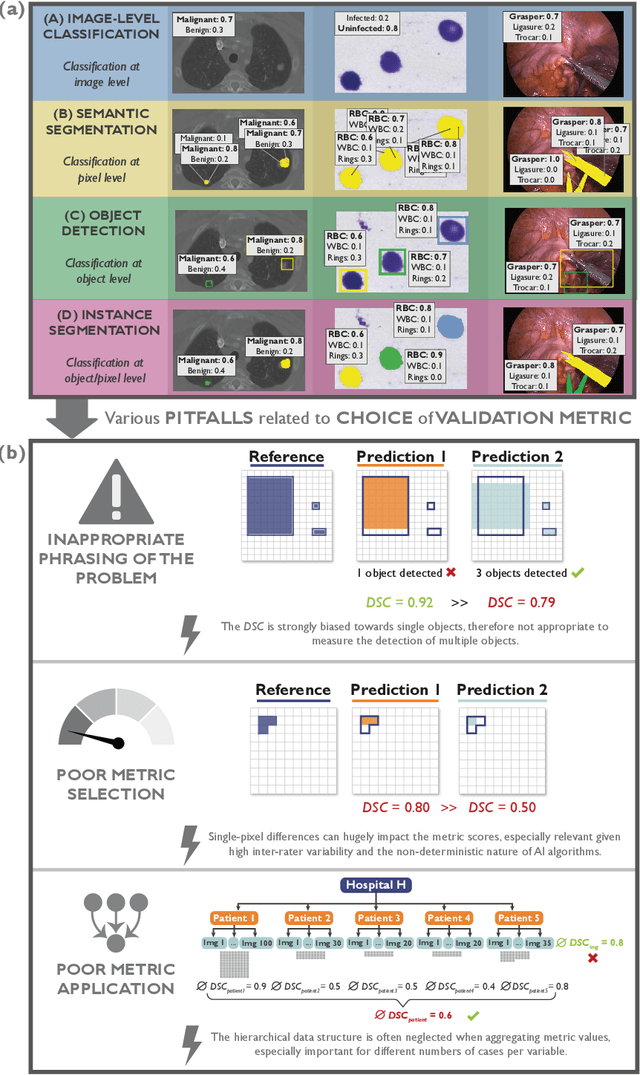
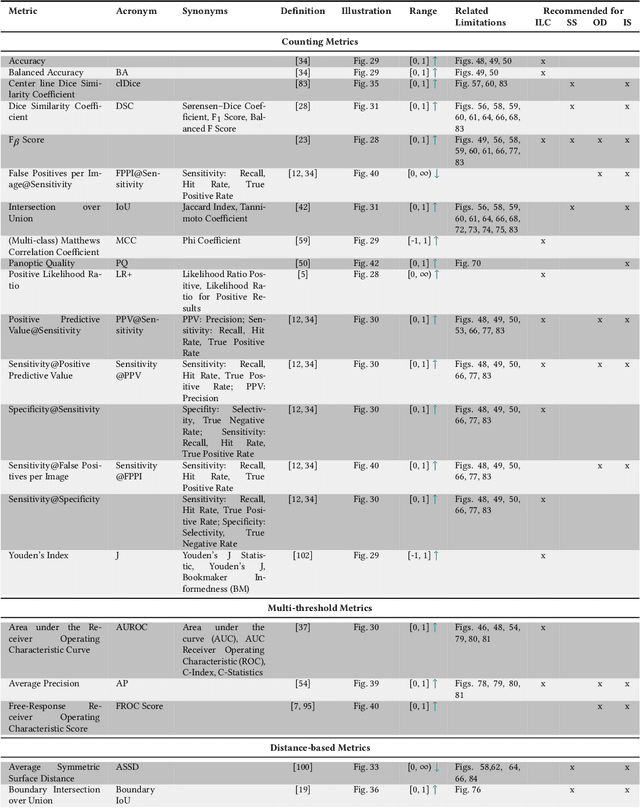
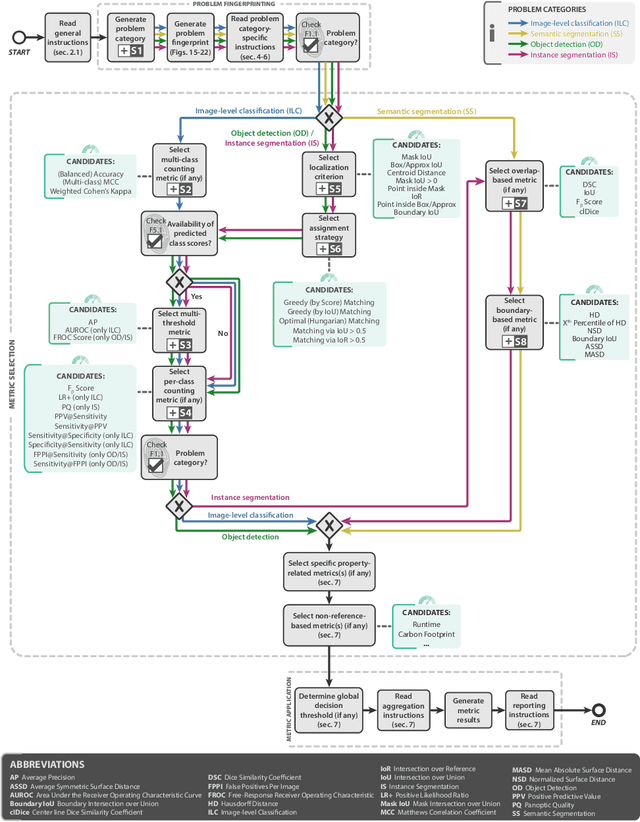
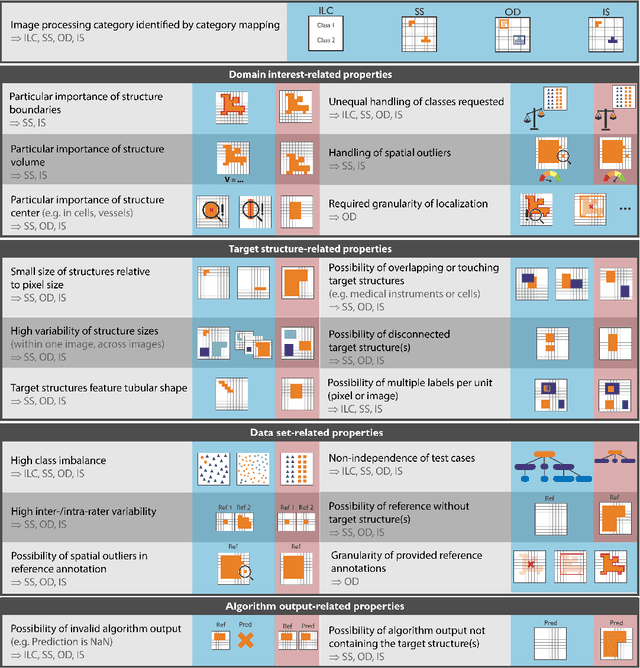
The field of automatic biomedical image analysis crucially depends on robust and meaningful performance metrics for algorithm validation. Current metric usage, however, is often ill-informed and does not reflect the underlying domain interest. Here, we present a comprehensive framework that guides researchers towards choosing performance metrics in a problem-aware manner. Specifically, we focus on biomedical image analysis problems that can be interpreted as a classification task at image, object or pixel level. The framework first compiles domain interest-, target structure-, data set- and algorithm output-related properties of a given problem into a problem fingerprint, while also mapping it to the appropriate problem category, namely image-level classification, semantic segmentation, instance segmentation, or object detection. It then guides users through the process of selecting and applying a set of appropriate validation metrics while making them aware of potential pitfalls related to individual choices. In this paper, we describe the current status of the Metrics Reloaded recommendation framework, with the goal of obtaining constructive feedback from the image analysis community. The current version has been developed within an international consortium of more than 60 image analysis experts and will be made openly available as a user-friendly toolkit after community-driven optimization.