 Add to Chrome
 Add to Firefox
 Add to Edge
"Time Series Analysis": models, code, and papers
AutoML Meets Time Series Regression Design and Analysis of the AutoSeries Challenge
Jul 28, 2021
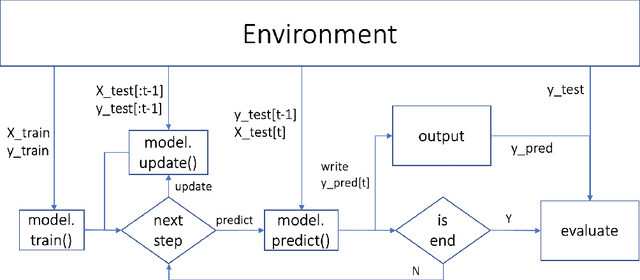
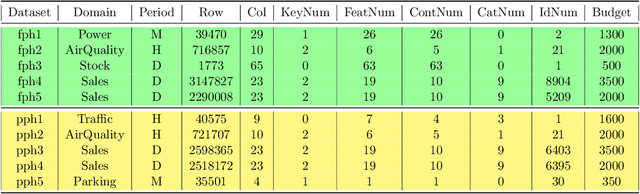
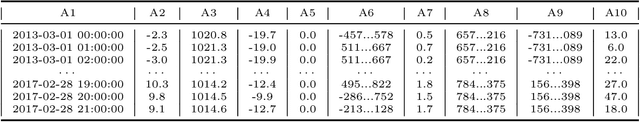
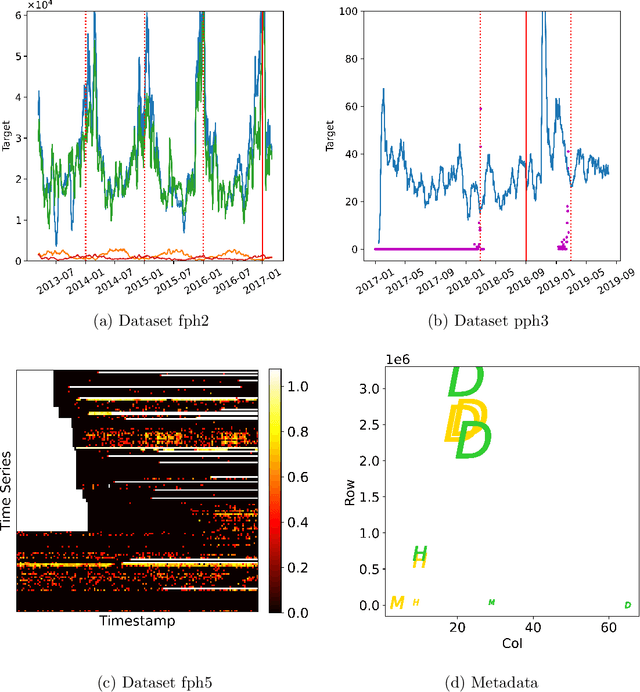
Analyzing better time series with limited human effort is of interest to academia and industry. Driven by business scenarios, we organized the first Automated Time Series Regression challenge (AutoSeries) for the WSDM Cup 2020. We present its design, analysis, and post-hoc experiments. The code submission requirement precluded participants from any manual intervention, testing automated machine learning capabilities of solutions, across many datasets, under hardware and time limitations. We prepared 10 datasets from diverse application domains (sales, power consumption, air quality, traffic, and parking), featuring missing data, mixed continuous and categorical variables, and various sampling rates. Each dataset was split into a training and a test sequence (which was streamed, allowing models to continuously adapt). The setting of time series regression, differs from classical forecasting in that covariates at the present time are known. Great strides were made by participants to tackle this AutoSeries problem, as demonstrated by the jump in performance from the sample submission, and post-hoc comparisons with AutoGluon. Simple yet effective methods were used, based on feature engineering, LightGBM, and random search hyper-parameter tuning, addressing all aspects of the challenge. Our post-hoc analyses revealed that providing additional time did not yield significant improvements. The winners' code was open-sourced https://www.4paradigm.com/competition/autoseries2020.
Detecting Anomalies within Time Series using Local Neural Transformations
Feb 08, 2022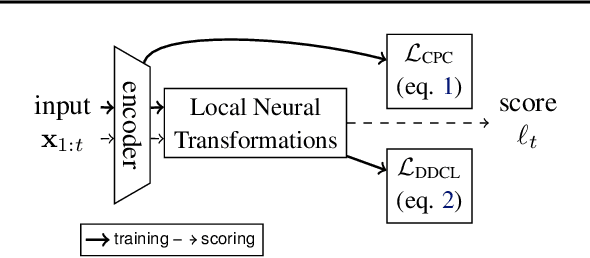
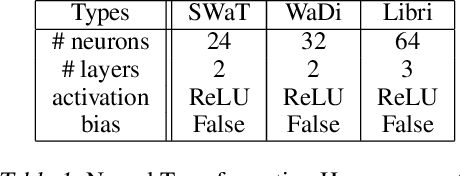
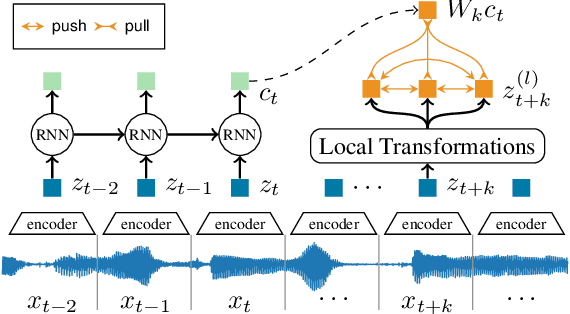
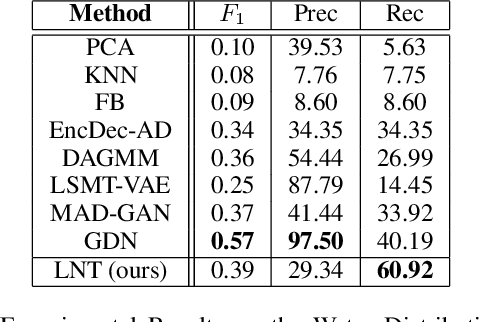
We develop a new method to detect anomalies within time series, which is essential in many application domains, reaching from self-driving cars, finance, and marketing to medical diagnosis and epidemiology. The method is based on self-supervised deep learning that has played a key role in facilitating deep anomaly detection on images, where powerful image transformations are available. However, such transformations are widely unavailable for time series. Addressing this, we develop Local Neural Transformations(LNT), a method learning local transformations of time series from data. The method produces an anomaly score for each time step and thus can be used to detect anomalies within time series. We prove in a theoretical analysis that our novel training objective is more suitable for transformation learning than previous deep Anomaly detection(AD) methods. Our experiments demonstrate that LNT can find anomalies in speech segments from the LibriSpeech data set and better detect interruptions to cyber-physical systems than previous work. Visualization of the learned transformations gives insight into the type of transformations that LNT learns.
Sensor selection on graphs via data-driven node sub-sampling in network time series
Apr 24, 2020
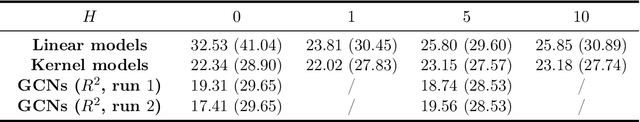
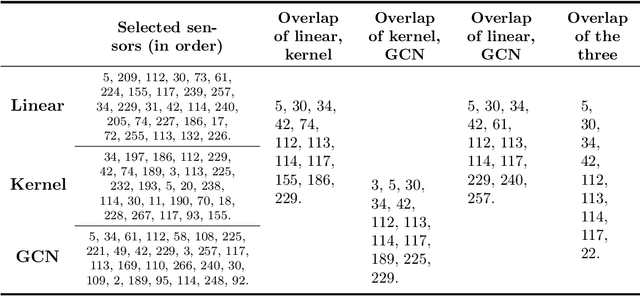
This paper is concerned by the problem of selecting an optimal sampling set of sensors over a network of time series for the purpose of signal recovery at non-observed sensors with a minimal reconstruction error. The problem is motivated by applications where time-dependent graph signals are collected over redundant networks. In this setting, one may wish to only use a subset of sensors to predict data streams over the whole collection of nodes in the underlying graph. A typical application is the possibility to reduce the power consumption in a network of sensors that may have limited battery supplies. We propose and compare various data-driven strategies to turn off a fixed number of sensors or equivalently to select a sampling set of nodes. We also relate our approach to the existing literature on sensor selection from multivariate data with a (possibly) underlying graph structure. Our methodology combines tools from multivariate time series analysis, graph signal processing, statistical learning in high-dimension and deep learning. To illustrate the performances of our approach, we report numerical experiments on the analysis of real data from bike sharing networks in different cities.
Markov Modeling of Time-Series Data using Symbolic Analysis
Mar 23, 2021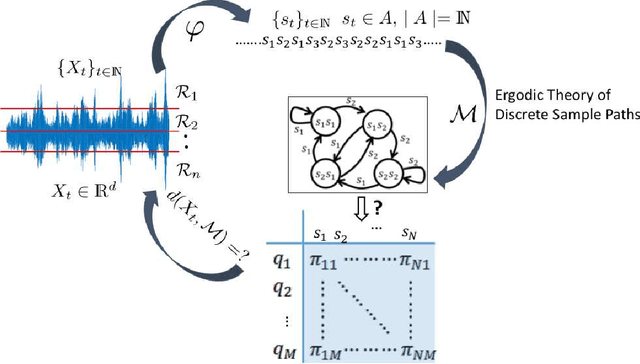
Markov models are often used to capture the temporal patterns of sequential data for statistical learning applications. While the Hidden Markov modeling-based learning mechanisms are well studied in literature, we analyze a symbolic-dynamics inspired approach. Under this umbrella, Markov modeling of time-series data consists of two major steps -- discretization of continuous attributes followed by estimating the size of temporal memory of the discretized sequence. These two steps are critical for the accurate and concise representation of time-series data in the discrete space. Discretization governs the information content of the resultant discretized sequence. On the other hand, memory estimation of the symbolic sequence helps to extract the predictive patterns in the discretized data. Clearly, the effectiveness of signal representation as a discrete Markov process depends on both these steps. In this paper, we will review the different techniques for discretization and memory estimation for discrete stochastic processes. In particular, we will focus on the individual problems of discretization and order estimation for discrete stochastic process. We will present some results from literature on partitioning from dynamical systems theory and order estimation using concepts of information theory and statistical learning. The paper also presents some related problem formulations which will be useful for machine learning and statistical learning application using the symbolic framework of data analysis. We present some results of statistical analysis of a complex thermoacoustic instability phenomenon during lean-premixed combustion in jet-turbine engines using the proposed Markov modeling method.
A Machine-Learning Phase Classification Scheme for Anomaly Detection in Signals with Periodic Characteristics
Nov 29, 2018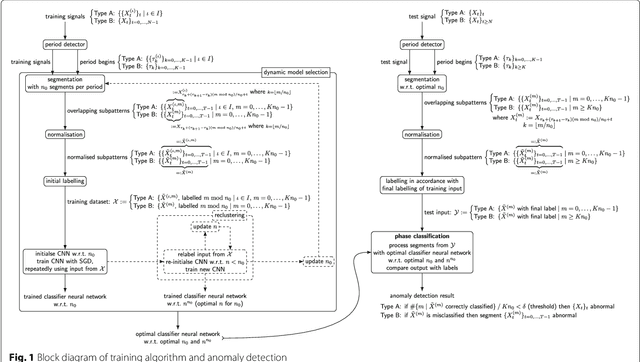
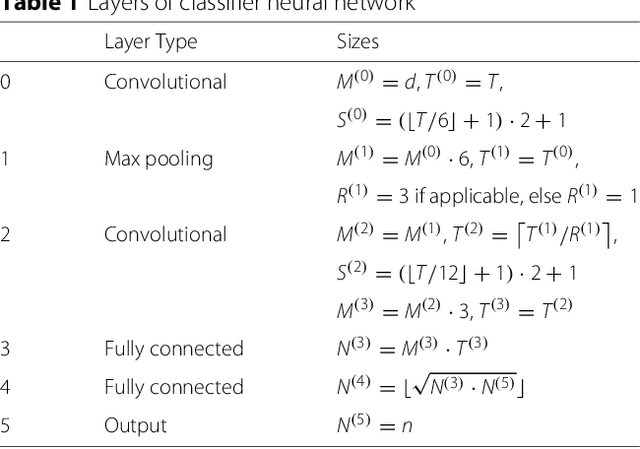
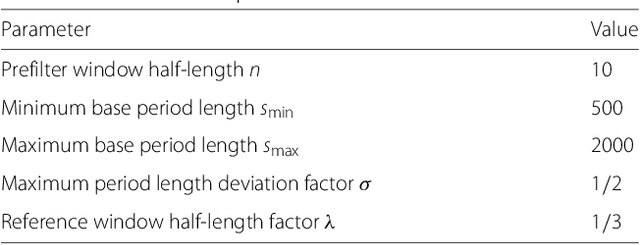
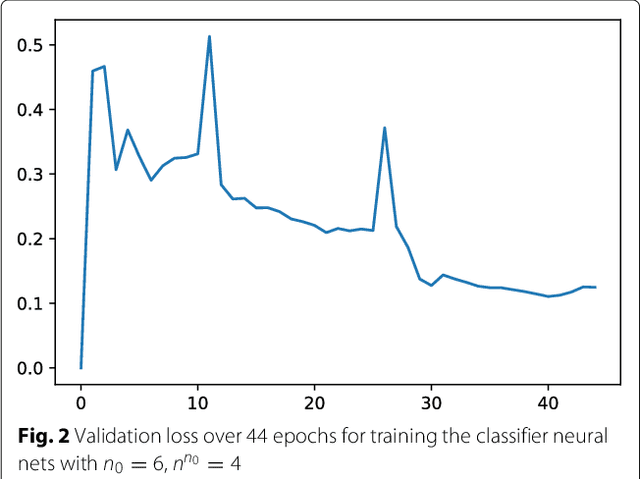
In this paper we propose a novel machine-learning method for anomaly detection. Focusing on data with periodic characteristics where randomly varying period lengths are explicitly allowed, a multi-dimensional time series analysis is conducted by training a data-adapted classifier consisting of deep convolutional neural networks performing phase classification. The entire algorithm including data pre-processing, period detection, segmentation, and even dynamic adjustment of the neural nets is implemented for a fully automatic execution. The proposed method is evaluated on three example datasets from the areas of cardiology, intrusion detection, and signal processing, presenting reasonable performance.
Meta-Learning for Koopman Spectral Analysis with Short Time-series
Feb 09, 2021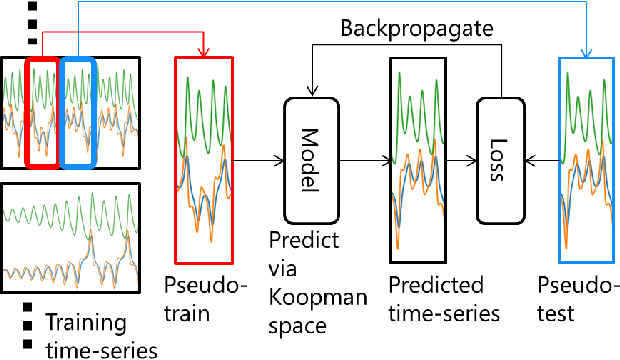
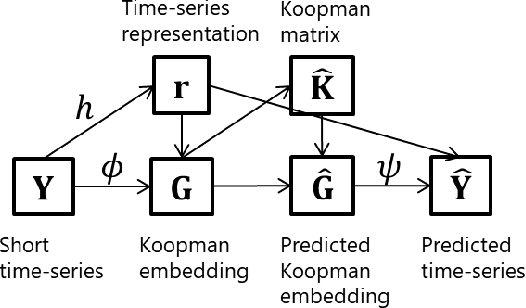
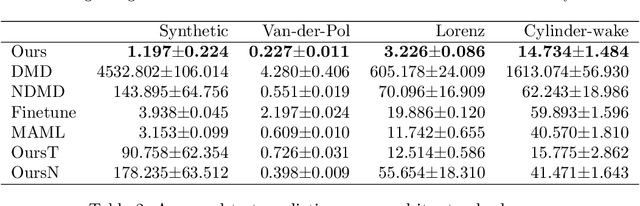
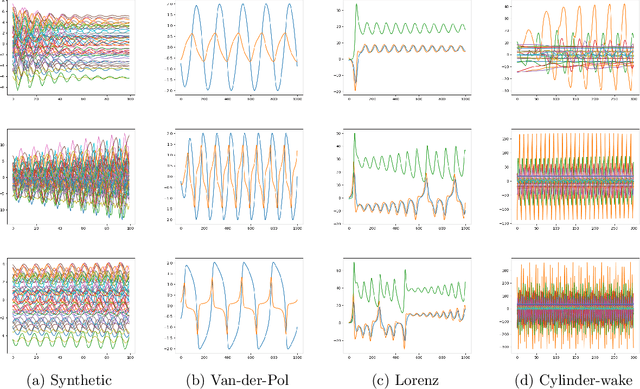
Koopman spectral analysis has attracted attention for nonlinear dynamical systems since we can analyze nonlinear dynamics with a linear regime by embedding data into a Koopman space by a nonlinear function. For the analysis, we need to find appropriate embedding functions. Although several neural network-based methods have been proposed for learning embedding functions, existing methods require long time-series for training neural networks. This limitation prohibits performing Koopman spectral analysis in applications where only short time-series are available. In this paper, we propose a meta-learning method for estimating embedding functions from unseen short time-series by exploiting knowledge learned from related but different time-series. With the proposed method, a representation of a given short time-series is obtained by a bidirectional LSTM for extracting its properties. The embedding function of the short time-series is modeled by a neural network that depends on the time-series representation. By sharing the LSTM and neural networks across multiple time-series, we can learn common knowledge from different time-series while modeling time-series-specific embedding functions with the time-series representation. Our model is trained such that the expected test prediction error is minimized with the episodic training framework. We experimentally demonstrate that the proposed method achieves better performance in terms of eigenvalue estimation and future prediction than existing methods.
Transfer Learning for Autonomous Chatter Detection in Machining
Apr 11, 2022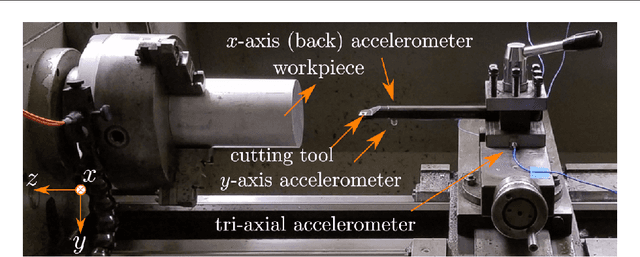
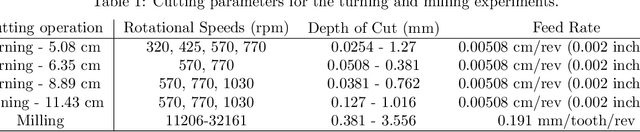
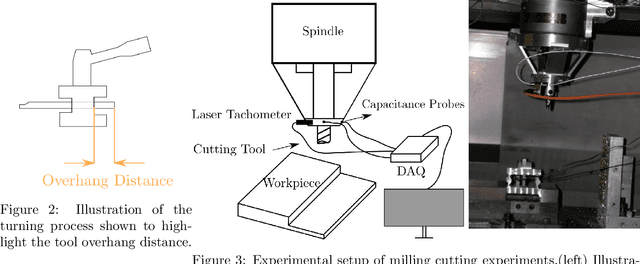
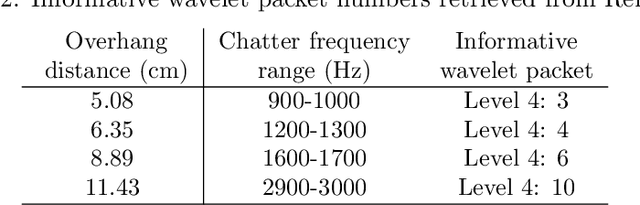
Large-amplitude chatter vibrations are one of the most important phenomena in machining processes. It is often detrimental in cutting operations causing a poor surface finish and decreased tool life. Therefore, chatter detection using machine learning has been an active research area over the last decade. Three challenges can be identified in applying machine learning for chatter detection at large in industry: an insufficient understanding of the universality of chatter features across different processes, the need for automating feature extraction, and the existence of limited data for each specific workpiece-machine tool combination. These three challenges can be grouped under the umbrella of transfer learning. This paper studies automating chatter detection by evaluating transfer learning of prominent as well as novel chatter detection methods. We investigate chatter classification accuracy using a variety of features extracted from turning and milling experiments with different cutting configurations. The studied methods include Fast Fourier Transform (FFT), Power Spectral Density (PSD), the Auto-correlation Function (ACF), Wavelet Packet Transform (WPT), and Ensemble Empirical Mode Decomposition (EEMD). We also examine more recent approaches based on Topological Data Analysis (TDA) and similarity measures of time series based on Discrete Time Warping (DTW). We evaluate the transfer learning potential of each approach by training and testing both within and across the turning and milling data sets. Our results show that carefully chosen time-frequency features can lead to high classification accuracies albeit at the cost of requiring manual pre-processing and the tagging of an expert user. On the other hand, we found that the TDA and DTW approaches can provide accuracies and F1 scores on par with the time-frequency methods without the need for manual preprocessing.
Neural Architecture Searching for Facial Attributes-based Depression Recognition
Jan 24, 2022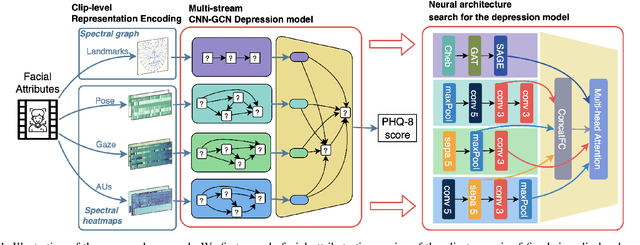
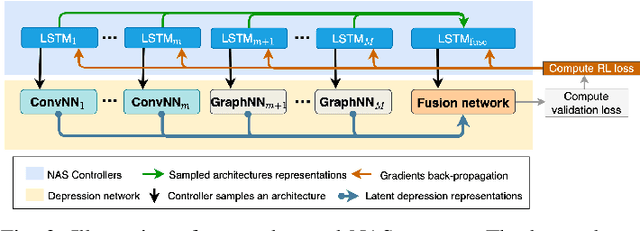
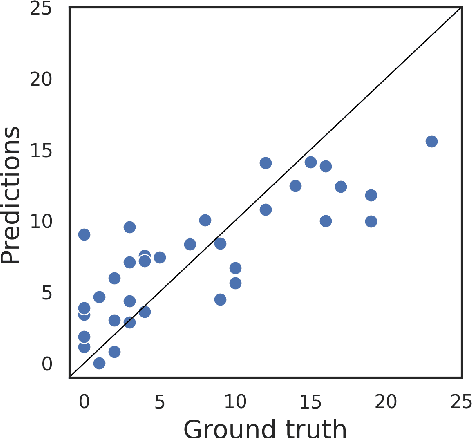
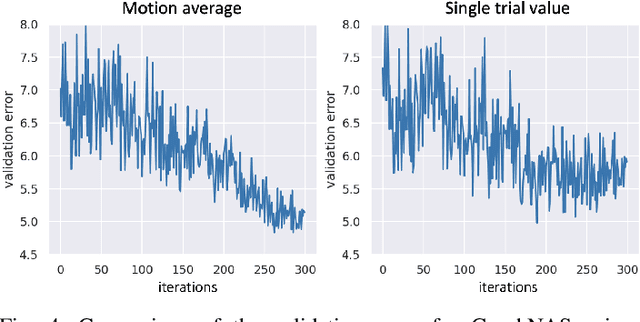
Recent studies show that depression can be partially reflected from human facial attributes. Since facial attributes have various data structure and carry different information, existing approaches fail to specifically consider the optimal way to extract depression-related features from each of them, as well as investigates the best fusion strategy. In this paper, we propose to extend Neural Architecture Search (NAS) technique for designing an optimal model for multiple facial attributes-based depression recognition, which can be efficiently and robustly implemented in a small dataset. Our approach first conducts a warmer up step to the feature extractor of each facial attribute, aiming to largely reduce the search space and providing customized architecture, where each feature extractor can be either a Convolution Neural Networks (CNN) or Graph Neural Networks (GNN). Then, we conduct an end-to-end architecture search for all feature extractors and the fusion network, allowing the complementary depression cues to be optimally combined with less redundancy. The experimental results on AVEC 2016 dataset show that the model explored by our approach achieves breakthrough performance with 27\% and 30\% RMSE and MAE improvements over the existing state-of-the-art. In light of these findings, this paper provides solid evidences and a strong baseline for applying NAS to time-series data-based mental health analysis.
ESAN: Efficient Sentiment Analysis Network of A-Shares Research Reports for Stock Price Prediction
Dec 03, 2021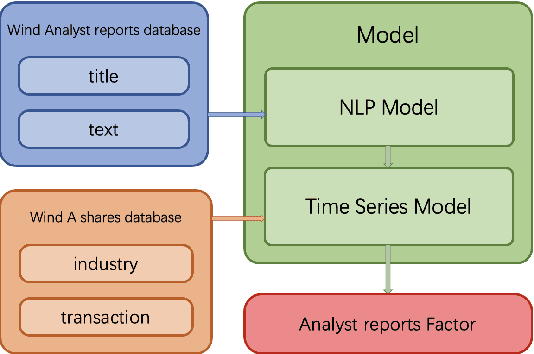
In this paper, we are going to develop a natural language processing model to help us to predict stocks in the long term. The whole network includes two modules. The first module is a natural language processing model which seeks out reliable factors from input reports. While the other is a time-series forecasting model which takes the factors as input and aims to predict stocks earnings yield. To indicate the efficiency of our model to combine the sentiment analysis module and the time-series forecasting module, we name our method ESAN.
Deep learning for time series classification
Oct 01, 2020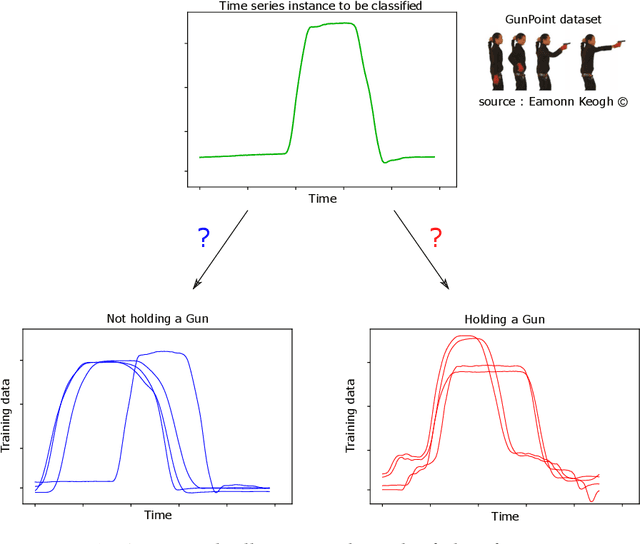
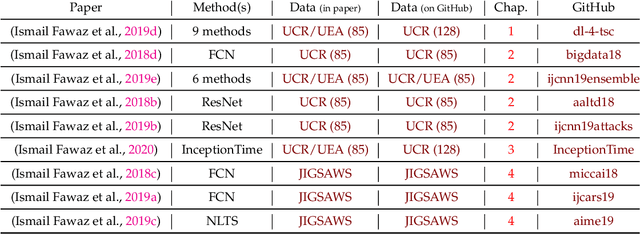
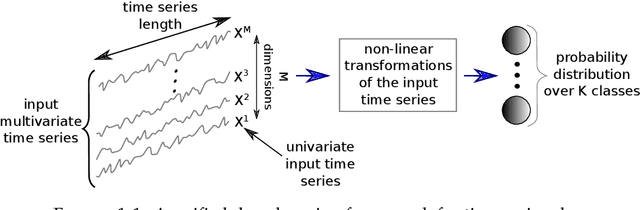
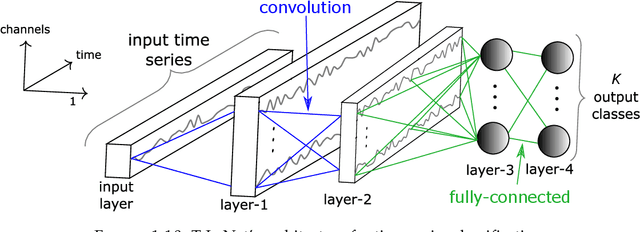
Time series analysis is a field of data science which is interested in analyzing sequences of numerical values ordered in time. Time series are particularly interesting because they allow us to visualize and understand the evolution of a process over time. Their analysis can reveal trends, relationships and similarities across the data. There exists numerous fields containing data in the form of time series: health care (electrocardiogram, blood sugar, etc.), activity recognition, remote sensing, finance (stock market price), industry (sensors), etc. Time series classification consists of constructing algorithms dedicated to automatically label time series data. The sequential aspect of time series data requires the development of algorithms that are able to harness this temporal property, thus making the existing off-the-shelf machine learning models for traditional tabular data suboptimal for solving the underlying task. In this context, deep learning has emerged in recent years as one of the most effective methods for tackling the supervised classification task, particularly in the field of computer vision. The main objective of this thesis was to study and develop deep neural networks specifically constructed for the classification of time series data. We thus carried out the first large scale experimental study allowing us to compare the existing deep methods and to position them compared other non-deep learning based state-of-the-art methods. Subsequently, we made numerous contributions in this area, notably in the context of transfer learning, data augmentation, ensembling and adversarial attacks. Finally, we have also proposed a novel architecture, based on the famous Inception network (Google), which ranks among the most efficient to date.