 Add to Chrome
 Add to Firefox
 Add to Edge
TractCloud-FOV: Deep Learning-based Robust Tractography Parcellation in Diffusion MRI with Incomplete Field of View
Feb 28, 2025Tractography parcellation classifies streamlines reconstructed from diffusion MRI into anatomically defined fiber tracts for clinical and research applications. However, clinical scans often have incomplete fields of view (FOV) where brain regions are partially imaged, leading to partial or truncated fiber tracts. To address this challenge, we introduce TractCloud-FOV, a deep learning framework that robustly parcellates tractography under conditions of incomplete FOV. We propose a novel training strategy, FOV-Cut Augmentation (FOV-CA), in which we synthetically cut tractograms to simulate a spectrum of real-world inferior FOV cutoff scenarios. This data augmentation approach enriches the training set with realistic truncated streamlines, enabling the model to achieve superior generalization. We evaluate the proposed TractCloud-FOV on both synthetically cut tractography and two real-life datasets with incomplete FOV. TractCloud-FOV significantly outperforms several state-of-the-art methods on all testing datasets in terms of streamline classification accuracy, generalization ability, tract anatomical depiction, and computational efficiency. Overall, TractCloud-FOV achieves efficient and consistent tractography parcellation in diffusion MRI with incomplete FOV.
White Matter Geometry-Guided Score-Based Diffusion Model for Tissue Microstructure Imputation in Tractography Imaging
Jul 28, 2024


Parcellation of white matter tractography provides anatomical features for disease prediction, anatomical tract segmentation, surgical brain mapping, and non-imaging phenotype classifications. However, parcellation does not always reach 100% accuracy due to various factors, including inter-individual anatomical variability and the quality of neuroimaging scan data. The failure to identify parcels causes a problem of missing microstructure data values, which is especially challenging for downstream tasks that analyze large brain datasets. In this work, we propose a novel deep-learning model to impute tissue microstructure: the White Matter Geometry-guided Diffusion (WMG-Diff) model. Specifically, we first propose a deep score-based guided diffusion model to impute tissue microstructure for diffusion magnetic resonance imaging (dMRI) tractography fiber clusters. Second, we propose a white matter atlas geometric relationship-guided denoising function to guide the reverse denoising process at the subject-specific level. Third, we train and evaluate our model on a large dataset with 9342 subjects. Comprehensive experiments for tissue microstructure imputation and a downstream non-imaging phenotype prediction task demonstrate that our proposed WMG-Diff outperforms state-of-the-art methods.
TractGraphFormer: Anatomically Informed Hybrid Graph CNN-Transformer Network for Classification from Diffusion MRI Tractography
Jul 11, 2024


The relationship between brain connections and non-imaging phenotypes is increasingly studied using deep neural networks. However, the local and global properties of the brain's white matter networks are often overlooked in convolutional network design. We introduce TractGraphFormer, a hybrid Graph CNN-Transformer deep learning framework tailored for diffusion MRI tractography. This model leverages local anatomical characteristics and global feature dependencies of white matter structures. The Graph CNN module captures white matter geometry and grey matter connectivity to aggregate local features from anatomically similar white matter connections, while the Transformer module uses self-attention to enhance global information learning. Additionally, TractGraphFormer includes an attention module for interpreting predictive white matter connections. In sex prediction tests, TractGraphFormer shows strong performance in large datasets of children (n=9345) and young adults (n=1065). Overall, our approach suggests that widespread connections in the WM are predictive of the sex of an individual, and consistent predictive anatomical tracts are identified across the two datasets. The proposed approach highlights the potential of integrating local anatomical information and global feature dependencies to improve prediction performance in machine learning with diffusion MRI tractography.
A Novel Supervised Contrastive Regression Framework for Prediction of Neurocognitive Measures Using Multi-Site Harmonized Diffusion MRI Tractography
Oct 13, 2022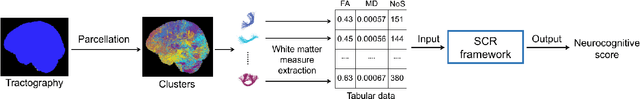
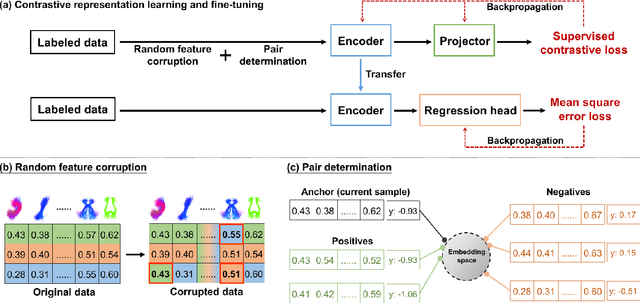
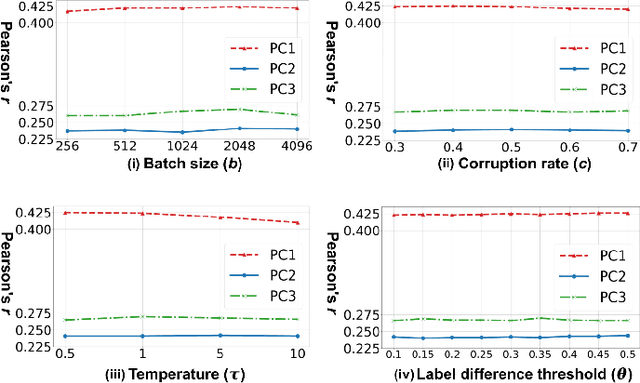
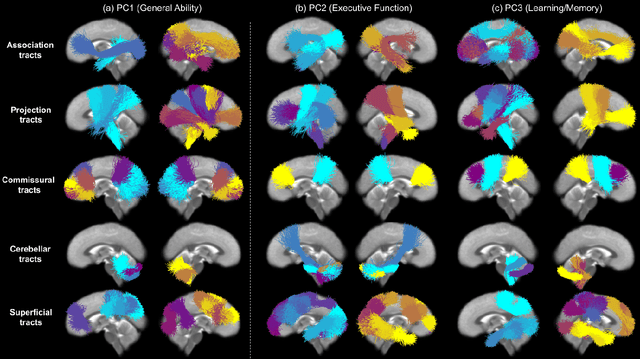
Neuroimaging-based prediction of neurocognitive measures is valuable for studying how the brain's structure relates to cognitive function. However, the accuracy of prediction using popular linear regression models is relatively low. We propose Supervised Contrastive Regression (SCR), a simple yet effective method that allows full supervision for contrastive learning in regression tasks. SCR performs supervised contrastive representation learning by using the absolute difference between continuous regression labels (i.e. neurocognitive scores) to determine positive and negative pairs. We apply SCR to analyze a large-scale dataset including multi-site harmonized diffusion MRI and neurocognitive data from 8735 participants in the Adolescent Brain Cognitive Development (ABCD) Study. We extract white matter microstructural measures using a fine parcellation of white matter tractography into fiber clusters. We predict three scores related to domains of higher-order cognition (general cognitive ability, executive function, and learning/memory). To identify important fiber clusters for prediction of these neurocognitive scores, we propose a permutation feature importance method for high-dimensional data. We find that SCR improves the accuracy of neurocognitive score prediction compared to other state-of-the-art methods. We find that the most predictive fiber clusters are predominantly located within the superficial white matter and projection tracts, particularly the superficial frontal white matter and striato-frontal connections. Overall, our results demonstrate the utility of contrastive representation learning methods for regression, and in particular for improving neuroimaging-based prediction of higher-order cognitive abilities.
FiberStars: Visual Comparison of Diffusion Tractography Data between Multiple Subjects
May 16, 2020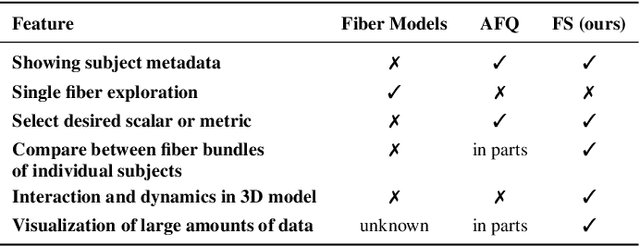
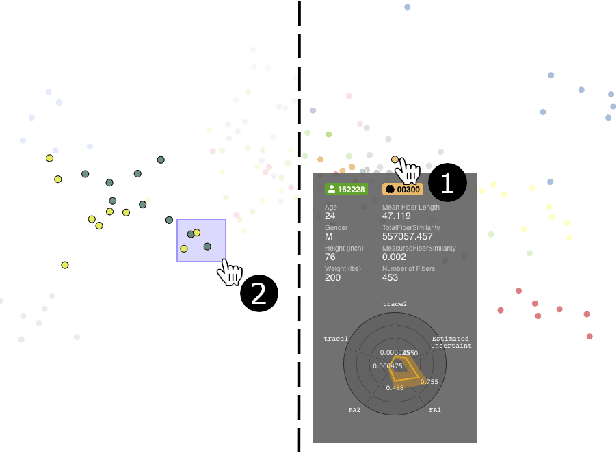
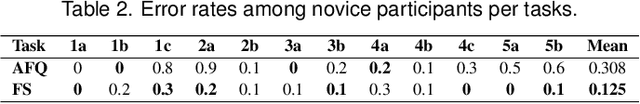
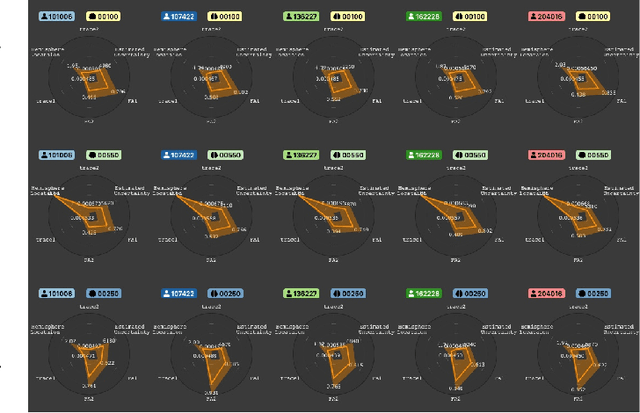
Tractography from high-dimensional diffusion magnetic resonance imaging (dMRI) data allows brain's structural connectivity analysis. Recent dMRI studies aim to compare connectivity patterns across thousands of subjects to understand subtle abnormalities in brain's white matter connectivity across disease populations. Besides connectivity differences, researchers are also interested in investigating distributions of biologically sensitive dMRI derived metrics across subject groups. Existing software products focus solely on the anatomy or are not intuitive and restrict the comparison of multiple subjects. In this paper, we present the design and implementation of FiberStars, a visual analysis tool for tractography data that allows the interactive and scalable visualization of brain fiber clusters in 2D and 3D. With FiberStars, researchers can analyze and compare multiple subjects in large collections of brain fibers. To evaluate the usability of our software, we performed a quantitative user study. We asked non-experts to find patterns in a large tractography dataset with either FiberStars or AFQ-Browser, an existing dMRI exploration tool. Our results show that participants using FiberStars can navigate extensive collections of tractography faster and more accurately. We discuss our findings and provide an analysis of the requirements for comparative visualizations of tractography data. All our research, software, and results are available openly.