 Add to Chrome
 Add to Firefox
 Add to Edge
SlicerTMS: Interactive Real-time Visualization of Transcranial Magnetic Stimulation using Augmented Reality and Deep Learning
May 23, 2023


Transcranial magnetic stimulation (TMS) is a non-invasive neuromodulation approach that effectively treats various brain disorders. One of the critical factors in the success of TMS treatment is accurate coil placement, which can be challenging, especially when targeting specific brain areas for individual patients. Calculating the optimal coil placement and the resulting electric field on the brain surface can be expensive and time-consuming. We introduce SlicerTMS, a simulation method that allows the real-time visualization of the TMS electromagnetic field within the medical imaging platform 3D Slicer. Our software leverages a 3D deep neural network, supports cloud-based inference, and includes augmented reality visualization using WebXR. We evaluate the performance of SlicerTMS with multiple hardware configurations and compare it against the existing TMS visualization application SimNIBS. All our code, data, and experiments are openly available: \url{https://github.com/lorifranke/SlicerTMS}
AutoDOViz: Human-Centered Automation for Decision Optimization
Feb 19, 2023


We present AutoDOViz, an interactive user interface for automated decision optimization (AutoDO) using reinforcement learning (RL). Decision optimization (DO) has classically being practiced by dedicated DO researchers where experts need to spend long periods of time fine tuning a solution through trial-and-error. AutoML pipeline search has sought to make it easier for a data scientist to find the best machine learning pipeline by leveraging automation to search and tune the solution. More recently, these advances have been applied to the domain of AutoDO, with a similar goal to find the best reinforcement learning pipeline through algorithm selection and parameter tuning. However, Decision Optimization requires significantly more complex problem specification when compared to an ML problem. AutoDOViz seeks to lower the barrier of entry for data scientists in problem specification for reinforcement learning problems, leverage the benefits of AutoDO algorithms for RL pipeline search and finally, create visualizations and policy insights in order to facilitate the typical interactive nature when communicating problem formulation and solution proposals between DO experts and domain experts. In this paper, we report our findings from semi-structured expert interviews with DO practitioners as well as business consultants, leading to design requirements for human-centered automation for DO with RL. We evaluate a system implementation with data scientists and find that they are significantly more open to engage in DO after using our proposed solution. AutoDOViz further increases trust in RL agent models and makes the automated training and evaluation process more comprehensible. As shown for other automation in ML tasks, we also conclude automation of RL for DO can benefit from user and vice-versa when the interface promotes human-in-the-loop.
FiberStars: Visual Comparison of Diffusion Tractography Data between Multiple Subjects
May 16, 2020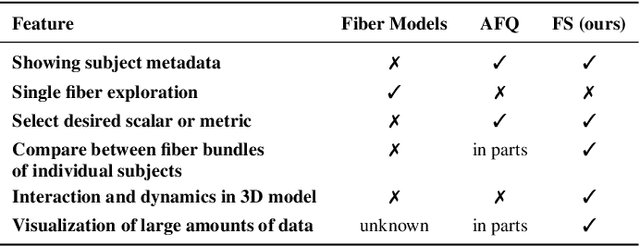
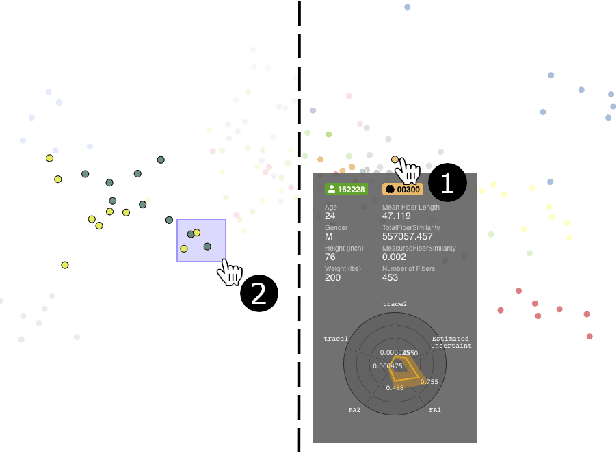
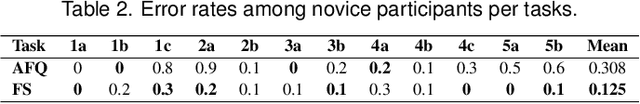
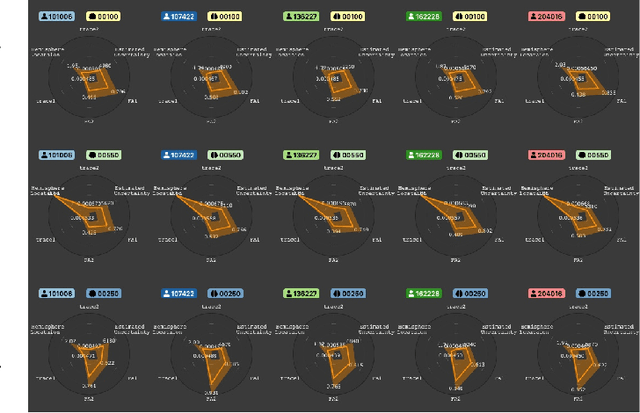
Tractography from high-dimensional diffusion magnetic resonance imaging (dMRI) data allows brain's structural connectivity analysis. Recent dMRI studies aim to compare connectivity patterns across thousands of subjects to understand subtle abnormalities in brain's white matter connectivity across disease populations. Besides connectivity differences, researchers are also interested in investigating distributions of biologically sensitive dMRI derived metrics across subject groups. Existing software products focus solely on the anatomy or are not intuitive and restrict the comparison of multiple subjects. In this paper, we present the design and implementation of FiberStars, a visual analysis tool for tractography data that allows the interactive and scalable visualization of brain fiber clusters in 2D and 3D. With FiberStars, researchers can analyze and compare multiple subjects in large collections of brain fibers. To evaluate the usability of our software, we performed a quantitative user study. We asked non-experts to find patterns in a large tractography dataset with either FiberStars or AFQ-Browser, an existing dMRI exploration tool. Our results show that participants using FiberStars can navigate extensive collections of tractography faster and more accurately. We discuss our findings and provide an analysis of the requirements for comparative visualizations of tractography data. All our research, software, and results are available openly.
TRAKO: Efficient Transmission of Tractography Data for Visualization
Apr 26, 2020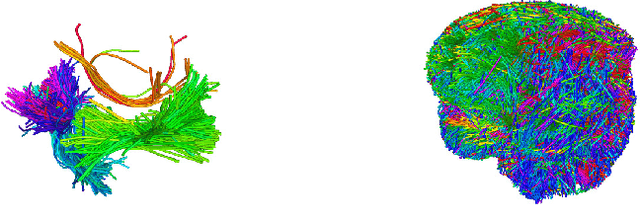
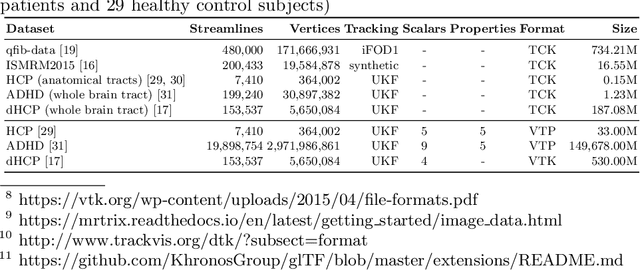
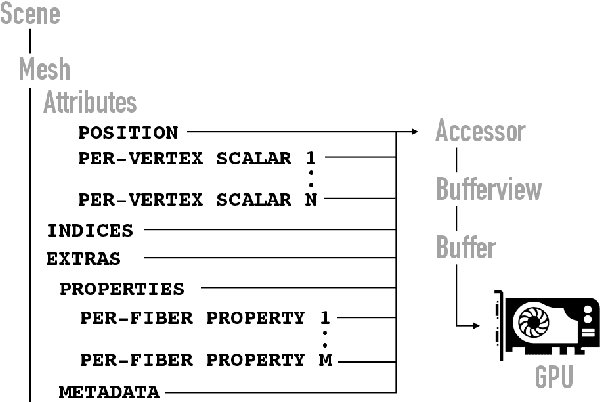
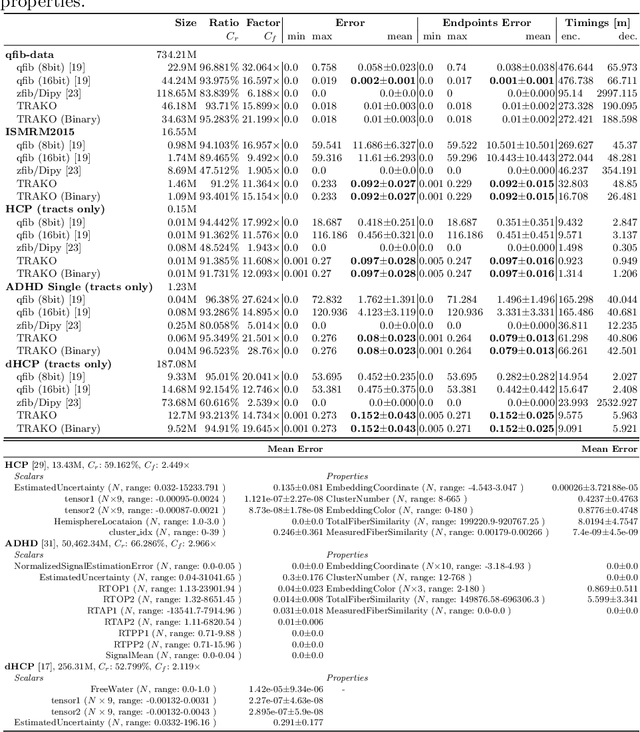
Fiber tracking produces large tractography datasets that are tens of gigabytes in size consisting of millions of streamlines. Such vast amounts of data require formats that allow for efficient storage, transfer, and visualization. We present TRAKO, a new data format based on the Graphics Layer Transmission Format (glTF) that enables immediate graphical and hardware-accelerated processing. We integrate a state-of-the-art compression technique for vertices, streamlines, and attached scalar and property data. We then compare TRAKO to existing tractography storage methods and provide a detailed evaluation on eight datasets. TRAKO can achieve data reductions of over 28x without loss of statistical significance when used to replicate analysis from previously published studies.