 Add to Chrome
 Add to Firefox
 Add to Edge
ChartGalaxy: A Dataset for Infographic Chart Understanding and Generation
May 24, 2025Infographic charts are a powerful medium for communicating abstract data by combining visual elements (e.g., charts, images) with textual information. However, their visual and structural richness poses challenges for large vision-language models (LVLMs), which are typically trained on plain charts. To bridge this gap, we introduce ChartGalaxy, a million-scale dataset designed to advance the understanding and generation of infographic charts. The dataset is constructed through an inductive process that identifies 75 chart types, 330 chart variations, and 68 layout templates from real infographic charts and uses them to create synthetic ones programmatically. We showcase the utility of this dataset through: 1) improving infographic chart understanding via fine-tuning, 2) benchmarking code generation for infographic charts, and 3) enabling example-based infographic chart generation. By capturing the visual and structural complexity of real design, ChartGalaxy provides a useful resource for enhancing multimodal reasoning and generation in LVLMs.
VisImages: A Large-scale, High-quality Image Corpus in Visualization Publications
Jul 10, 2020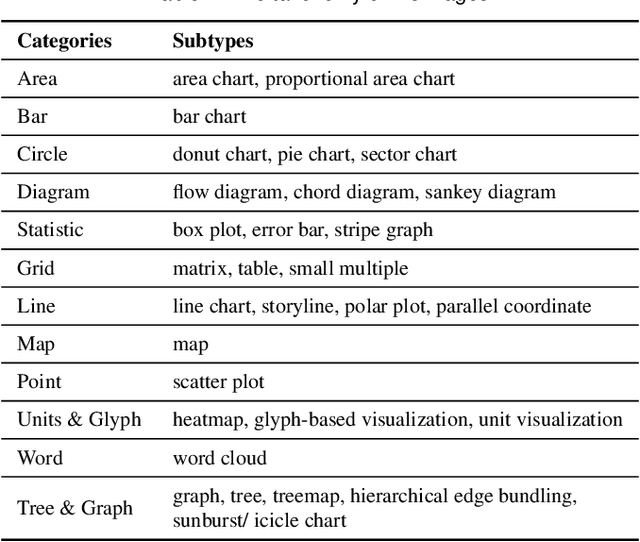
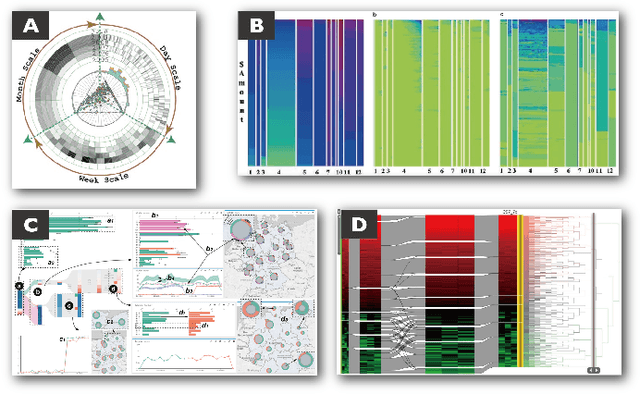
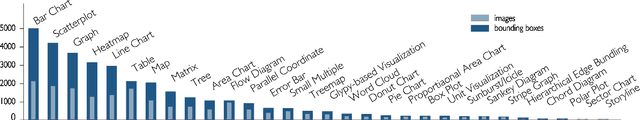
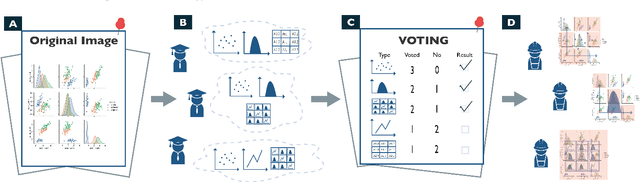
Images in visualization publications contain rich information, such as novel visual designs, model details, and experiment results. Constructing such an image corpus can contribute to the community in many aspects, including literature analysis from the perspective of visual representations, empirical studies on visual memorability, and machine learning research for chart detection. This study presents VisImages, a high-quality and large-scale image corpus collected from visualization publications. VisImages contain fruitful and diverse annotations for each image, including captions, types of visual representations, and bounding boxes. First, we algorithmically extract the images associated with captions and manually correct the errors. Second, to categorize visualizations in publications, we extend and iteratively refine the existing taxonomy through a multi-round pilot study. Third, guided by this taxonomy, we invite senior visualization practitioners to annotate visual representations that appear in each image. In this process, we borrow techniques such as "gold standards" and majority voting for quality control. Finally, we recruit the crowd to draw bounding boxes for visual representations in the images. The resulting corpus contains 35,096 annotated visualizations from 12,267 images with 12,057 captions in 1397 papers from VAST and InfoVis. We demonstrate the usefulness of VisImages through the following four use cases: 1) analysis of color usage in VAST and InfoVis papers across years, 2) discussion of the researcher preference on visualization types, 3) spatial distribution analysis of visualizations in visual analytic systems, and 4) training visualization detection models.