 Add to Chrome
 Add to Firefox
 Add to Edge
A satellite foundation model for improved wealth monitoring
Apr 25, 2026Poverty statistics guide social policy, but in many low- and middle-income countries, censuses and household surveys that collect these data are costly, infrequent, quickly outdated, and sometimes error-prone. Satellite imagery offers global coverage and the possibility of predicting economic livelihoods at scale, yet existing approaches to predicting livelihoods with imagery or other non-traditional data often fail to reliably identify local-level variation and, as we show, degrade under temporal shift. Here we introduce Tempov, a satellite foundation model pretrained by self-supervision on three million bi-temporal Landsat pairs and adapted with parameter-efficient fine-tuning to sparse survey labels. The model enables large-scale, high-resolution wealth mapping and dynamic measurement, including zero-shot nowcasting up to a decade after observed labels, retrospective hindcasting, and decadal change tracking, while outperforming existing neural network and geospatial foundation-model baselines. In low-label regimes, Tempov achieves competitive accuracy with only 10% of survey samples, indicating substantially reduced dependence on expensive label collection. The model further generalizes across populous countries within and outside Africa, and scales to a unified Africa-wide model with strong continent-level performance ($R^2=0.63$, $r^2=0.68$), from which we generate high-resolution decadal maps of wealth and wealth changes for the African continent. Analysis of these maps shows large variation in recent economic performance both within and across countries. Our open-source approach provides a pathway to timely, scalable, low-cost monitoring of wealth and poverty from routinely collected satellite data.
Mapping the world population one building at a time
Dec 15, 2017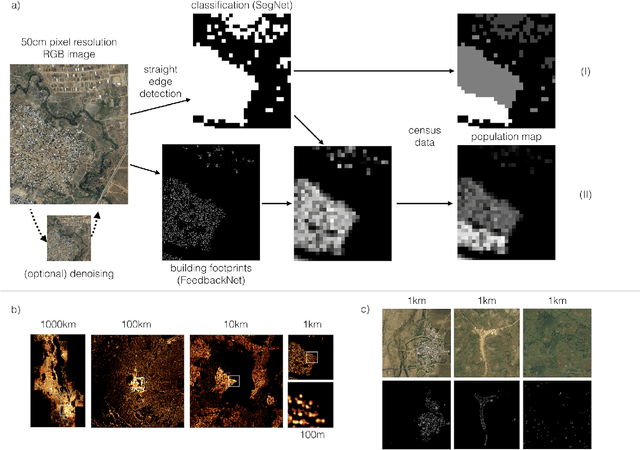
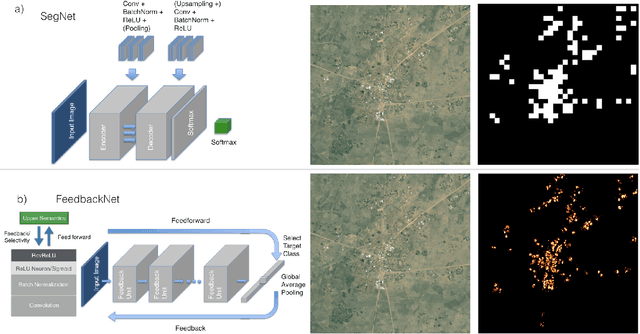
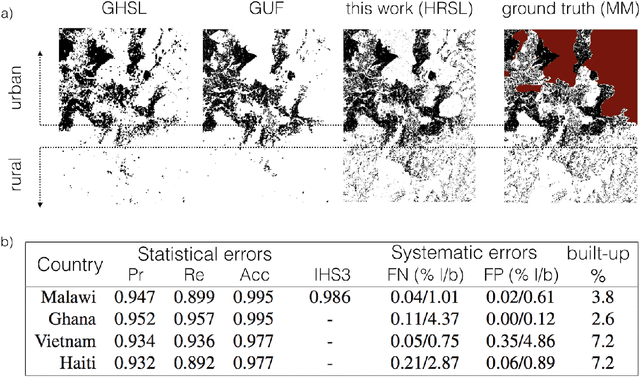
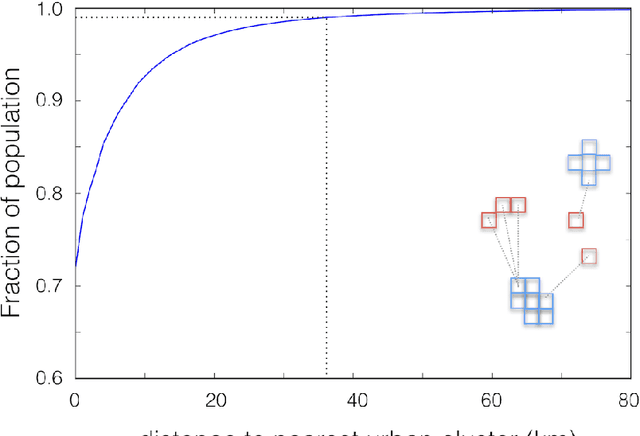
High resolution datasets of population density which accurately map sparsely-distributed human populations do not exist at a global scale. Typically, population data is obtained using censuses and statistical modeling. More recently, methods using remotely-sensed data have emerged, capable of effectively identifying urbanized areas. Obtaining high accuracy in estimation of population distribution in rural areas remains a very challenging task due to the simultaneous requirements of sufficient sensitivity and resolution to detect very sparse populations through remote sensing as well as reliable performance at a global scale. Here, we present a computer vision method based on machine learning to create population maps from satellite imagery at a global scale, with a spatial sensitivity corresponding to individual buildings and suitable for global deployment. By combining this settlement data with census data, we create population maps with ~30 meter resolution for 18 countries. We validate our method, and find that the building identification has an average precision and recall of 0.95 and 0.91, respectively and that the population estimates have a standard error of a factor ~2 or less. Based on our data, we analyze 29 percent of the world population, and show that 99 percent lives within 36 km of the nearest urban cluster. The resulting high-resolution population datasets have applications in infrastructure planning, vaccination campaign planning, disaster response efforts and risk analysis such as high accuracy flood risk analysis.