 Add to Chrome
 Add to Firefox
 Add to Edge
A satellite foundation model for improved wealth monitoring
Apr 25, 2026
Poverty statistics guide social policy, but in many low- and middle-income countries, censuses and household surveys that collect these data are costly, infrequent, quickly outdated, and sometimes error-prone. Satellite imagery offers global coverage and the possibility of predicting economic livelihoods at scale, yet existing approaches to predicting livelihoods with imagery or other non-traditional data often fail to reliably identify local-level variation and, as we show, degrade under temporal shift. Here we introduce Tempov, a satellite foundation model pretrained by self-supervision on three million bi-temporal Landsat pairs and adapted with parameter-efficient fine-tuning to sparse survey labels. The model enables large-scale, high-resolution wealth mapping and dynamic measurement, including zero-shot nowcasting up to a decade after observed labels, retrospective hindcasting, and decadal change tracking, while outperforming existing neural network and geospatial foundation-model baselines. In low-label regimes, Tempov achieves competitive accuracy with only 10% of survey samples, indicating substantially reduced dependence on expensive label collection. The model further generalizes across populous countries within and outside Africa, and scales to a unified Africa-wide model with strong continent-level performance ($R^2=0.63$, $r^2=0.68$), from which we generate high-resolution decadal maps of wealth and wealth changes for the African continent. Analysis of these maps shows large variation in recent economic performance both within and across countries. Our open-source approach provides a pathway to timely, scalable, low-cost monitoring of wealth and poverty from routinely collected satellite data.

Poverty Mapping Using Convolutional Neural Networks Trained on High and Medium Resolution Satellite Images, With an Application in Mexico
Nov 16, 2017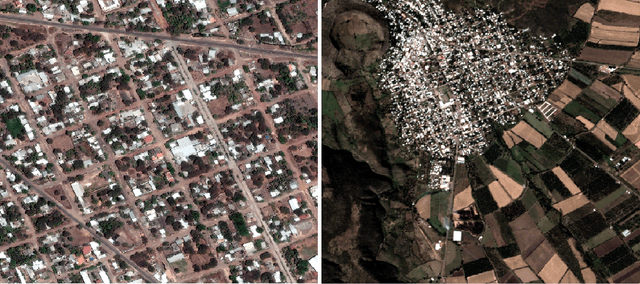
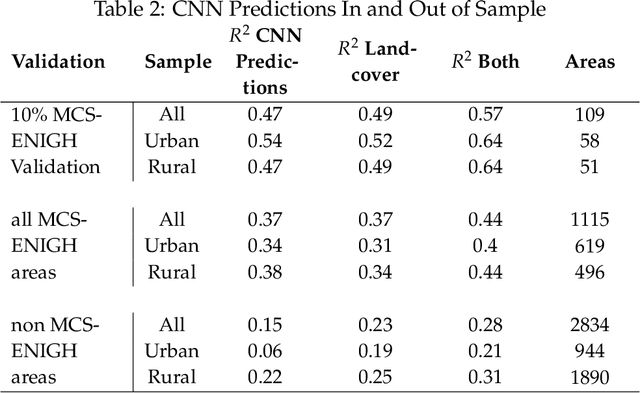
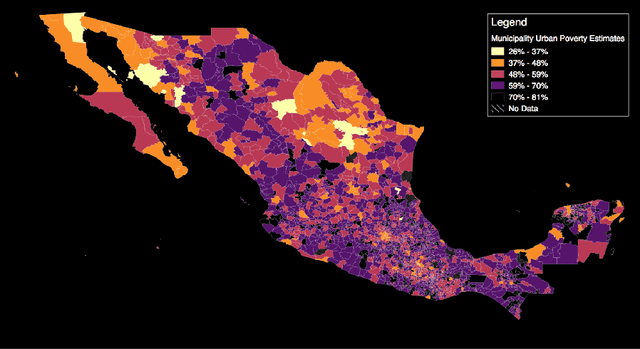
Mapping the spatial distribution of poverty in developing countries remains an important and costly challenge. These "poverty maps" are key inputs for poverty targeting, public goods provision, political accountability, and impact evaluation, that are all the more important given the geographic dispersion of the remaining bottom billion severely poor individuals. In this paper we train Convolutional Neural Networks (CNNs) to estimate poverty directly from high and medium resolution satellite images. We use both Planet and Digital Globe imagery with spatial resolutions of 3-5 sq. m. and 50 sq. cm. respectively, covering all 2 million sq. km. of Mexico. Benchmark poverty estimates come from the 2014 MCS-ENIGH combined with the 2015 Intercensus and are used to estimate poverty rates for 2,456 Mexican municipalities. CNNs are trained using the 896 municipalities in the 2014 MCS-ENIGH. We experiment with several architectures (GoogleNet, VGG) and use GoogleNet as a final architecture where weights are fine-tuned from ImageNet. We find that 1) the best models, which incorporate satellite-estimated land use as a predictor, explain approximately 57% of the variation in poverty in a validation sample of 10 percent of MCS-ENIGH municipalities; 2) Across all MCS-ENIGH municipalities explanatory power reduces to 44% in a CNN prediction and landcover model; 3) Predicted poverty from the CNN predictions alone explains 47% of the variation in poverty in the validation sample, and 37% over all MCS-ENIGH municipalities; 4) In urban areas we see slight improvements from using Digital Globe versus Planet imagery, which explain 61% and 54% of poverty variation respectively. We conclude that CNNs can be trained end-to-end on satellite imagery to estimate poverty, although there is much work to be done to understand how the training process influences out of sample validation.