 Add to Chrome
 Add to Firefox
 Add to Edge
How Many Samples are Needed to Learn a Convolutional Neural Network?
May 21, 2018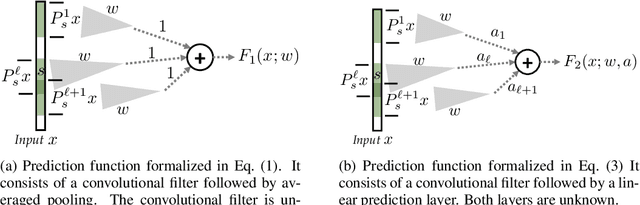
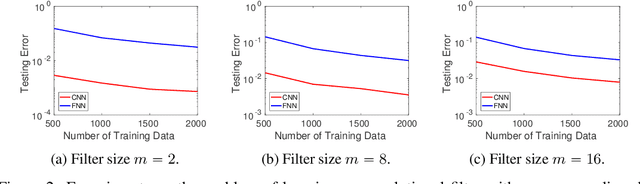
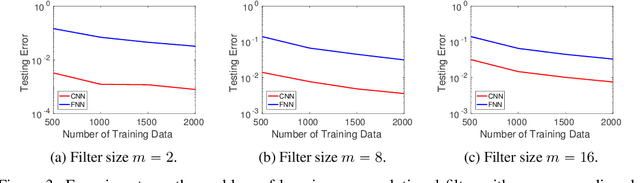
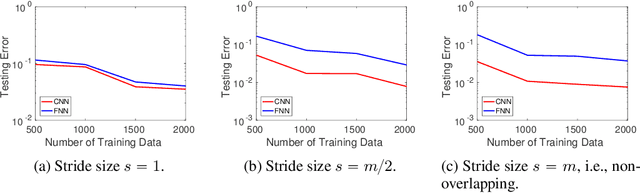
A widespread folklore for explaining the success of convolutional neural network (CNN) is that CNN is a more compact representation than the fully connected neural network (FNN) and thus requires fewer samples for learning. We initiate the study of rigorously characterizing the sample complexity of learning convolutional neural networks. We show that for learning an $m$-dimensional convolutional filter with linear activation acting on a $d$-dimensional input, the sample complexity of achieving population prediction error of $\epsilon$ is $\widetilde{O} (m/\epsilon^2)$, whereas its FNN counterpart needs at least $\Omega(d/\epsilon^2)$ samples. Since $m \ll d$, this result demonstrates the advantage of using CNN. We further consider the sample complexity of learning a one-hidden-layer CNN with linear activation where both the $m$-dimensional convolutional filter and the $r$-dimensional output weights are unknown. For this model, we show the sample complexity is $\widetilde{O}\left((m+r)/\epsilon^2\right)$ when the ratio between the stride size and the filter size is a constant. For both models, we also present lower bounds showing our sample complexities are tight up to logarithmic factors. Our main tools for deriving these results are localized empirical process and a new lemma characterizing the convolutional structure. We believe these tools may inspire further developments in understanding CNN.
Robust Estimation via Robust Gradient Estimation
Apr 20, 2018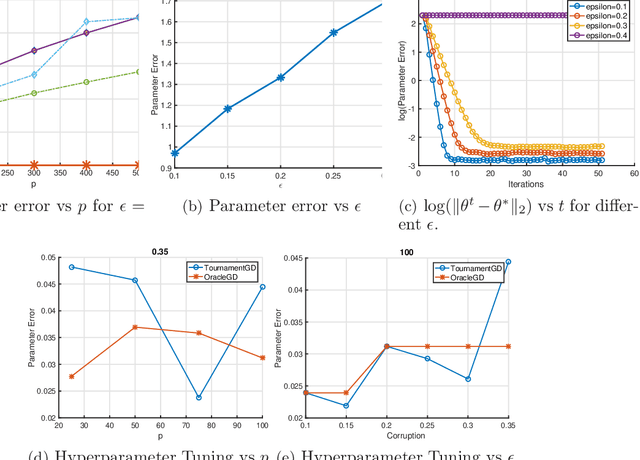
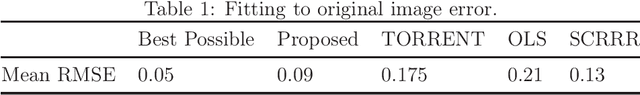
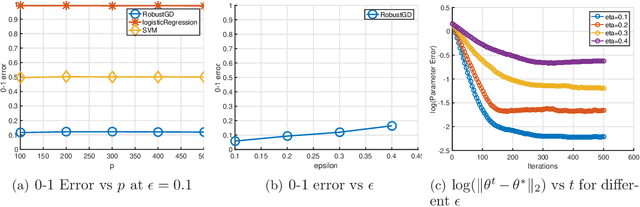
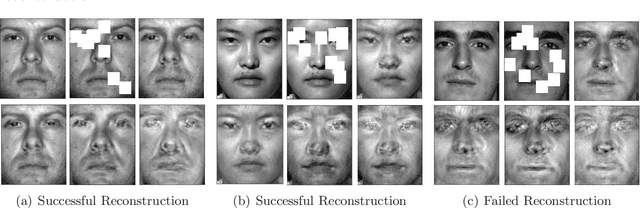
We provide a new computationally-efficient class of estimators for risk minimization. We show that these estimators are robust for general statistical models: in the classical Huber epsilon-contamination model and in heavy-tailed settings. Our workhorse is a novel robust variant of gradient descent, and we provide conditions under which our gradient descent variant provides accurate estimators in a general convex risk minimization problem. We provide specific consequences of our theory for linear regression, logistic regression and for estimation of the canonical parameters in an exponential family. These results provide some of the first computationally tractable and provably robust estimators for these canonical statistical models. Finally, we study the empirical performance of our proposed methods on synthetic and real datasets, and find that our methods convincingly outperform a variety of baselines.
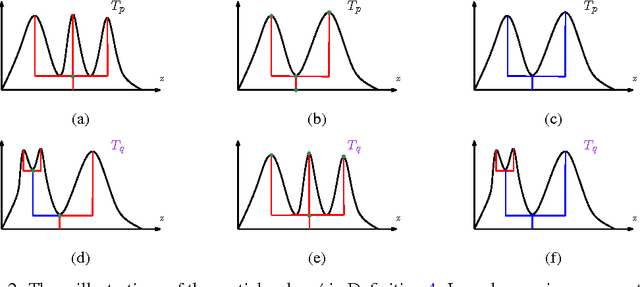
Optimization of Smooth Functions with Noisy Observations: Local Minimax Rates
Mar 22, 2018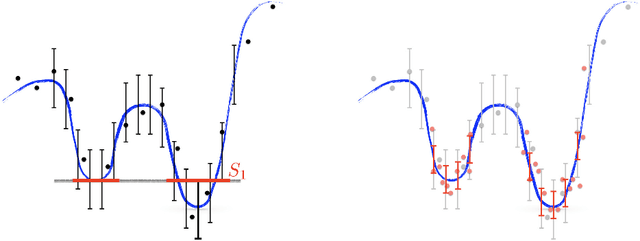
We consider the problem of global optimization of an unknown non-convex smooth function with zeroth-order feedback. In this setup, an algorithm is allowed to adaptively query the underlying function at different locations and receives noisy evaluations of function values at the queried points (i.e. the algorithm has access to zeroth-order information). Optimization performance is evaluated by the expected difference of function values at the estimated optimum and the true optimum. In contrast to the classical optimization setup, first-order information like gradients are not directly accessible to the optimization algorithm. We show that the classical minimax framework of analysis, which roughly characterizes the worst-case query complexity of an optimization algorithm in this setting, leads to excessively pessimistic results. We propose a local minimax framework to study the fundamental difficulty of optimizing smooth functions with adaptive function evaluations, which provides a refined picture of the intrinsic difficulty of zeroth-order optimization. We show that for functions with fast level set growth around the global minimum, carefully designed optimization algorithms can identify a near global minimizer with many fewer queries. For the special case of strongly convex and smooth functions, our implied convergence rates match the ones developed for zeroth-order convex optimization problems. At the other end of the spectrum, for worst-case smooth functions no algorithm can converge faster than the minimax rate of estimating the entire unknown function in the $\ell_\infty$-norm. We provide an intuitive and efficient algorithm that attains the derived upper error bounds.
Stochastic Zeroth-order Optimization in High Dimensions
Feb 26, 2018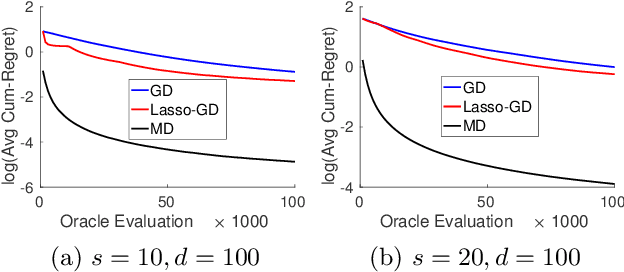
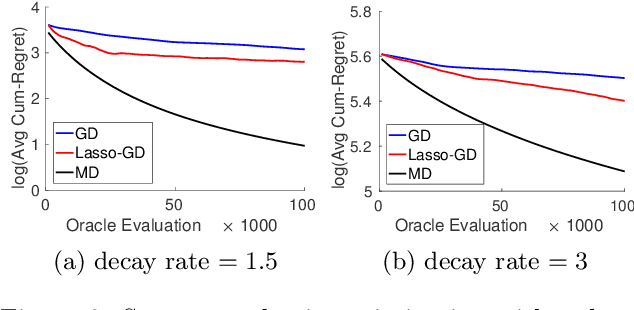
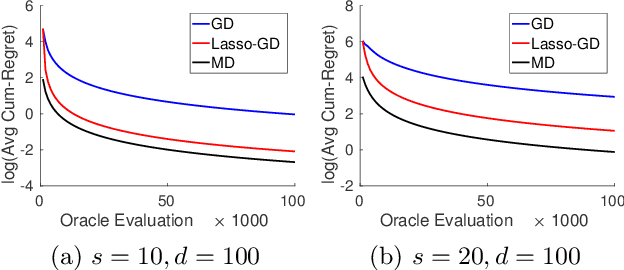
We consider the problem of optimizing a high-dimensional convex function using stochastic zeroth-order queries. Under sparsity assumptions on the gradients or function values, we present two algorithms: a successive component/feature selection algorithm and a noisy mirror descent algorithm using Lasso gradient estimates, and show that both algorithms have convergence rates that de- pend only logarithmically on the ambient dimension of the problem. Empirical results confirm our theoretical findings and show that the algorithms we design outperform classical zeroth-order optimization methods in the high-dimensional setting.
Hypothesis Testing for High-Dimensional Multinomials: A Selective Review
Dec 17, 2017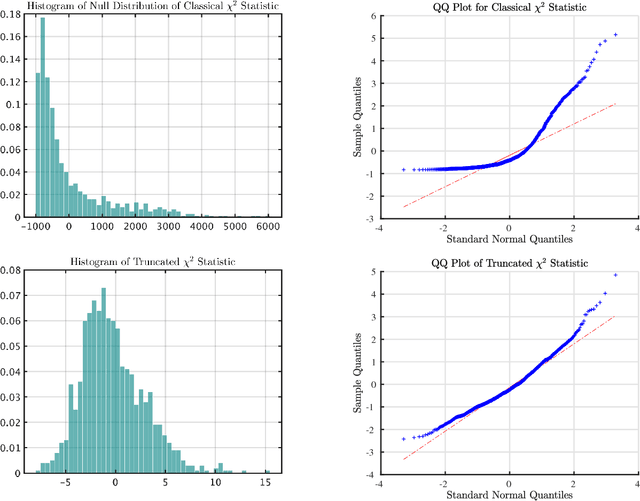
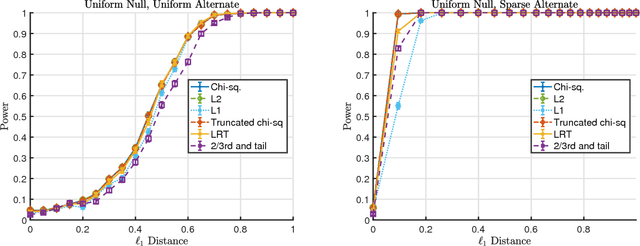
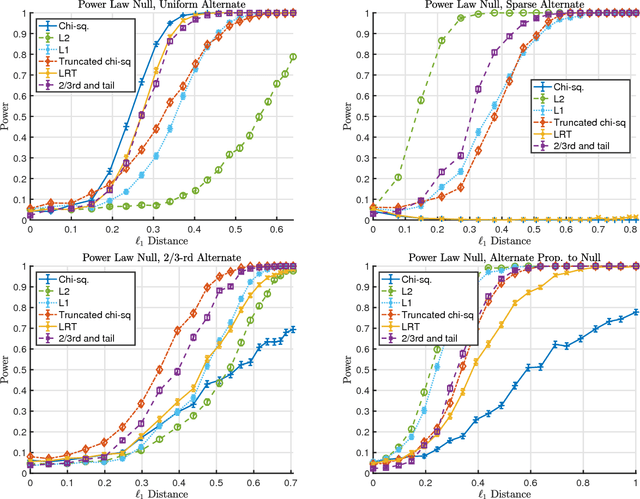
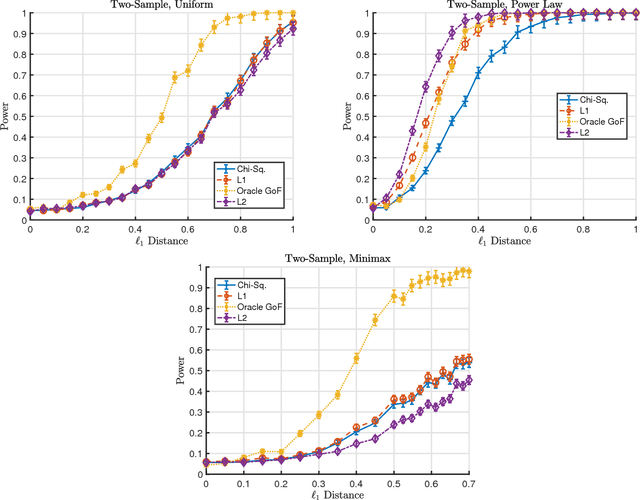
The statistical analysis of discrete data has been the subject of extensive statistical research dating back to the work of Pearson. In this survey we review some recently developed methods for testing hypotheses about high-dimensional multinomials. Traditional tests like the $\chi^2$ test and the likelihood ratio test can have poor power in the high-dimensional setting. Much of the research in this area has focused on finding tests with asymptotically Normal limits and developing (stringent) conditions under which tests have Normal limits. We argue that this perspective suffers from a significant deficiency: it can exclude many high-dimensional cases when - despite having non Normal null distributions - carefully designed tests can have high power. Finally, we illustrate that taking a minimax perspective and considering refinements of this perspective can lead naturally to powerful and practical tests.
Rate Optimal Estimation and Confidence Intervals for High-dimensional Regression with Missing Covariates
Nov 03, 2017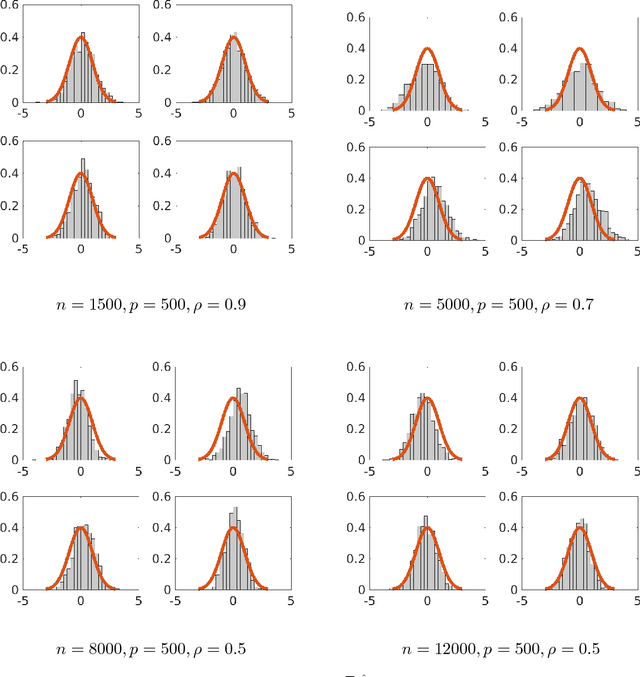
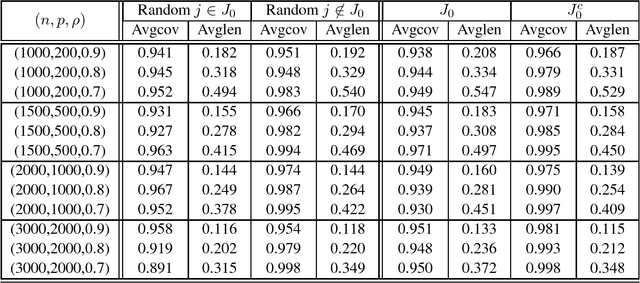
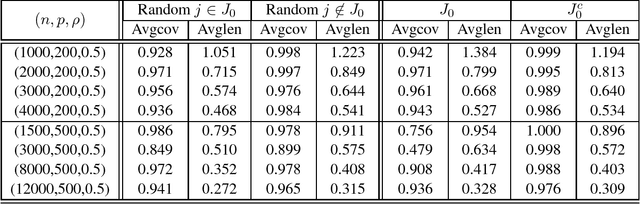

Although a majority of the theoretical literature in high-dimensional statistics has focused on settings which involve fully-observed data, settings with missing values and corruptions are common in practice. We consider the problems of estimation and of constructing component-wise confidence intervals in a sparse high-dimensional linear regression model when some covariates of the design matrix are missing completely at random. We analyze a variant of the Dantzig selector [9] for estimating the regression model and we use a de-biasing argument to construct component-wise confidence intervals. Our first main result is to establish upper bounds on the estimation error as a function of the model parameters (the sparsity level s, the expected fraction of observed covariates $\rho_*$, and a measure of the signal strength $\|\beta^*\|_2$). We find that even in an idealized setting where the covariates are assumed to be missing completely at random, somewhat surprisingly and in contrast to the fully-observed setting, there is a dichotomy in the dependence on model parameters and much faster rates are obtained if the covariance matrix of the random design is known. To study this issue further, our second main contribution is to provide lower bounds on the estimation error showing that this discrepancy in rates is unavoidable in a minimax sense. We then consider the problem of high-dimensional inference in the presence of missing data. We construct and analyze confidence intervals using a de-biased estimator. In the presence of missing data, inference is complicated by the fact that the de-biasing matrix is correlated with the pilot estimator and this necessitates the design of a new estimator and a novel analysis. We also complement our mathematical study with extensive simulations on synthetic and semi-synthetic data that show the accuracy of our asymptotic predictions for finite sample sizes.
Hypothesis Testing For Densities and High-Dimensional Multinomials: Sharp Local Minimax Rates
Jun 30, 2017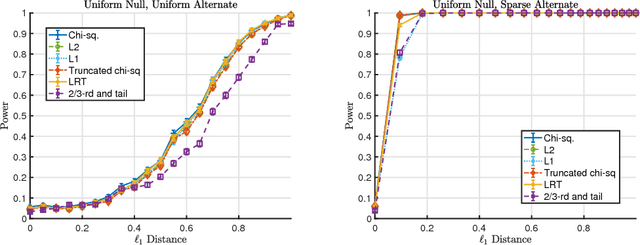
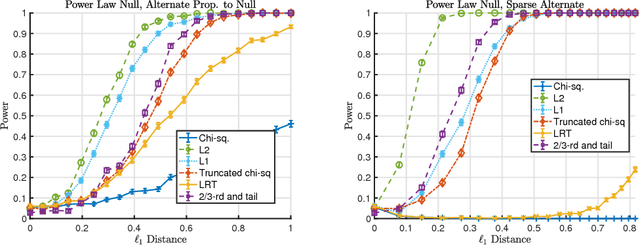
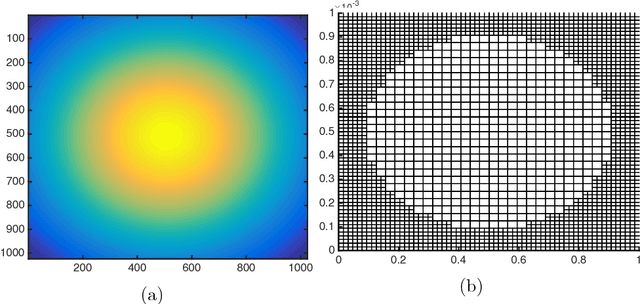
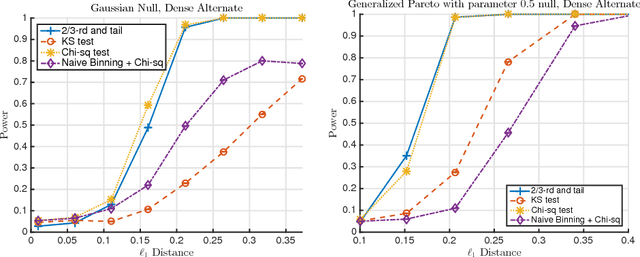
We consider the goodness-of-fit testing problem of distinguishing whether the data are drawn from a specified distribution, versus a composite alternative separated from the null in the total variation metric. In the discrete case, we consider goodness-of-fit testing when the null distribution has a possibly growing or unbounded number of categories. In the continuous case, we consider testing a Lipschitz density, with possibly unbounded support, in the low-smoothness regime where the Lipschitz parameter is not assumed to be constant. In contrast to existing results, we show that the minimax rate and critical testing radius in these settings depend strongly, and in a precise way, on the null distribution being tested and this motivates the study of the (local) minimax rate as a function of the null distribution. For multinomials the local minimax rate was recently studied in the work of Valiant and Valiant. We re-visit and extend their results and develop two modifications to the chi-squared test whose performance we characterize. For testing Lipschitz densities, we show that the usual binning tests are inadequate in the low-smoothness regime and we design a spatially adaptive partitioning scheme that forms the basis for our locally minimax optimal tests. Furthermore, we provide the first local minimax lower bounds for this problem which yield a sharp characterization of the dependence of the critical radius on the null hypothesis being tested. In the low-smoothness regime we also provide adaptive tests, that adapt to the unknown smoothness parameter. We illustrate our results with a variety of simulations that demonstrate the practical utility of our proposed tests.
Computationally Efficient Robust Estimation of Sparse Functionals
Feb 24, 2017Many conventional statistical procedures are extremely sensitive to seemingly minor deviations from modeling assumptions. This problem is exacerbated in modern high-dimensional settings, where the problem dimension can grow with and possibly exceed the sample size. We consider the problem of robust estimation of sparse functionals, and provide a computationally and statistically efficient algorithm in the high-dimensional setting. Our theory identifies a unified set of deterministic conditions under which our algorithm guarantees accurate recovery. By further establishing that these deterministic conditions hold with high-probability for a wide range of statistical models, our theory applies to many problems of considerable interest including sparse mean and covariance estimation; sparse linear regression; and sparse generalized linear models.
Statistical Inference for Cluster Trees
Feb 12, 2017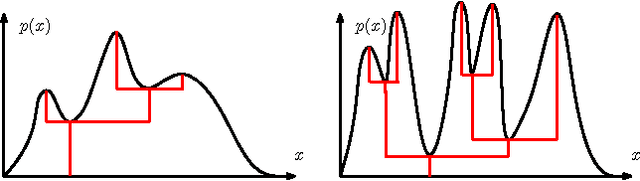
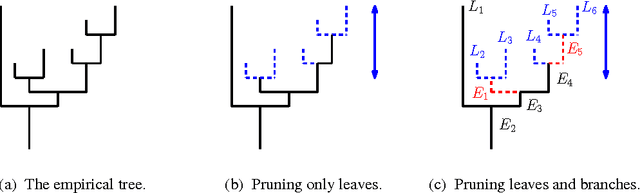
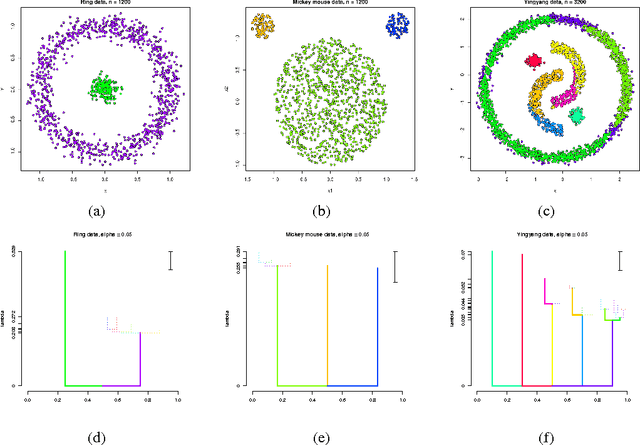
A cluster tree provides a highly-interpretable summary of a density function by representing the hierarchy of its high-density clusters. It is estimated using the empirical tree, which is the cluster tree constructed from a density estimator. This paper addresses the basic question of quantifying our uncertainty by assessing the statistical significance of topological features of an empirical cluster tree. We first study a variety of metrics that can be used to compare different trees, analyze their properties and assess their suitability for inference. We then propose methods to construct and summarize confidence sets for the unknown true cluster tree. We introduce a partial ordering on cluster trees which we use to prune some of the statistically insignificant features of the empirical tree, yielding interpretable and parsimonious cluster trees. Finally, we illustrate the proposed methods on a variety of synthetic examples and furthermore demonstrate their utility in the analysis of a Graft-versus-Host Disease (GvHD) data set.
Stochastically Transitive Models for Pairwise Comparisons: Statistical and Computational Issues
Sep 28, 2016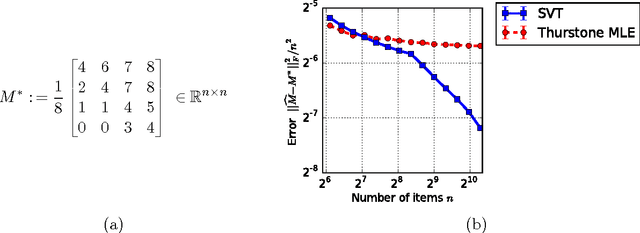
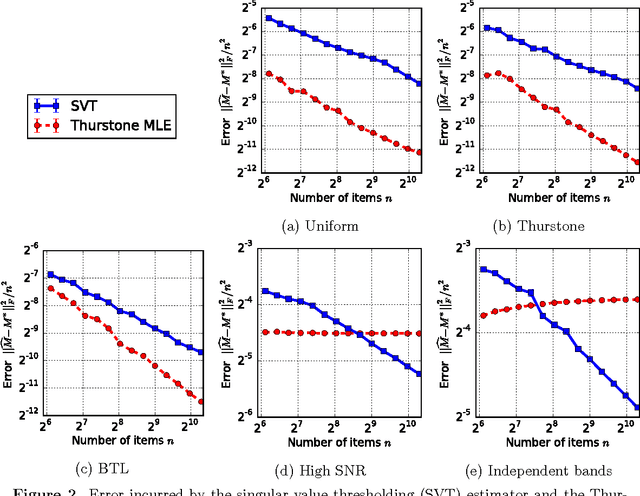
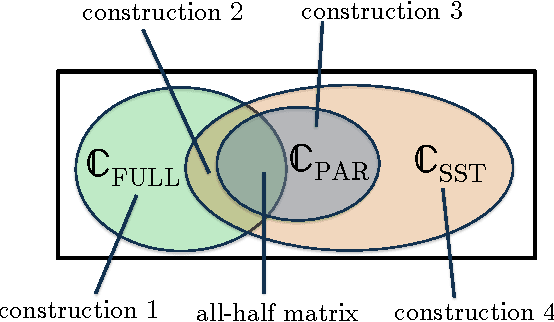
There are various parametric models for analyzing pairwise comparison data, including the Bradley-Terry-Luce (BTL) and Thurstone models, but their reliance on strong parametric assumptions is limiting. In this work, we study a flexible model for pairwise comparisons, under which the probabilities of outcomes are required only to satisfy a natural form of stochastic transitivity. This class includes parametric models including the BTL and Thurstone models as special cases, but is considerably more general. We provide various examples of models in this broader stochastically transitive class for which classical parametric models provide poor fits. Despite this greater flexibility, we show that the matrix of probabilities can be estimated at the same rate as in standard parametric models. On the other hand, unlike in the BTL and Thurstone models, computing the minimax-optimal estimator in the stochastically transitive model is non-trivial, and we explore various computationally tractable alternatives. We show that a simple singular value thresholding algorithm is statistically consistent but does not achieve the minimax rate. We then propose and study algorithms that achieve the minimax rate over interesting sub-classes of the full stochastically transitive class. We complement our theoretical results with thorough numerical simulations.