 Add to Chrome
 Add to Firefox
 Add to Edge
A Unified Understanding of Deep NLP Models for Text Classification
Jun 19, 2022
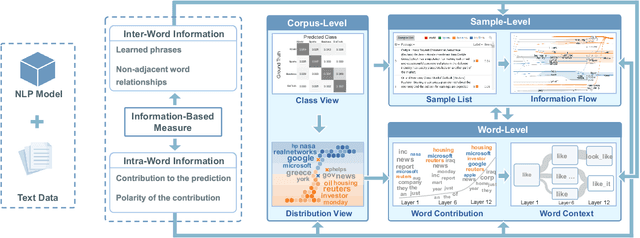
The rapid development of deep natural language processing (NLP) models for text classification has led to an urgent need for a unified understanding of these models proposed individually. Existing methods cannot meet the need for understanding different models in one framework due to the lack of a unified measure for explaining both low-level (e.g., words) and high-level (e.g., phrases) features. We have developed a visual analysis tool, DeepNLPVis, to enable a unified understanding of NLP models for text classification. The key idea is a mutual information-based measure, which provides quantitative explanations on how each layer of a model maintains the information of input words in a sample. We model the intra- and inter-word information at each layer measuring the importance of a word to the final prediction as well as the relationships between words, such as the formation of phrases. A multi-level visualization, which consists of a corpus-level, a sample-level, and a word-level visualization, supports the analysis from the overall training set to individual samples. Two case studies on classification tasks and comparison between models demonstrate that DeepNLPVis can help users effectively identify potential problems caused by samples and model architectures and then make informed improvements.
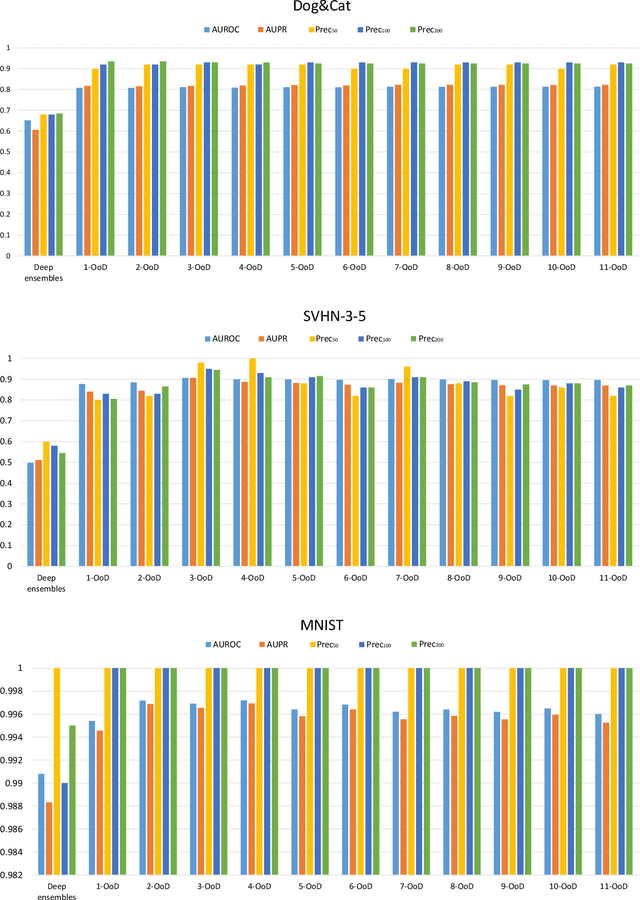
Diagnosing Ensemble Few-Shot Classifiers
Jun 09, 2022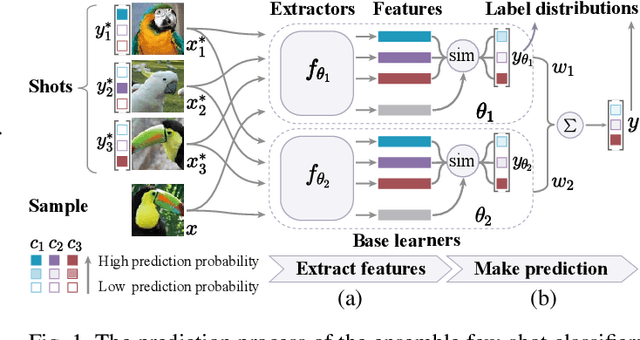
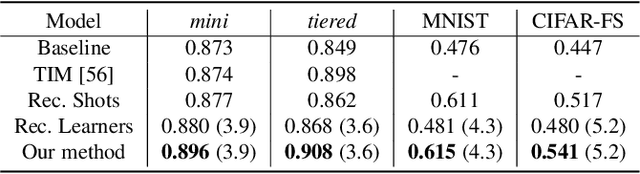
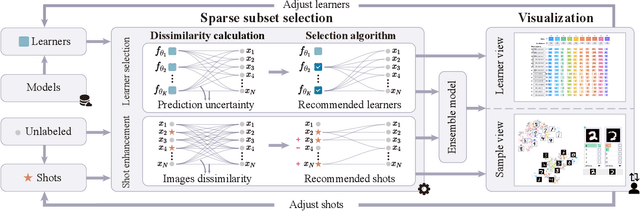
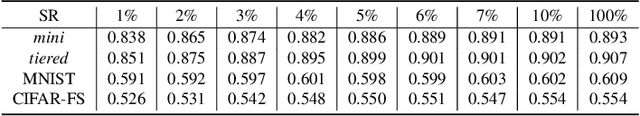
The base learners and labeled samples (shots) in an ensemble few-shot classifier greatly affect the model performance. When the performance is not satisfactory, it is usually difficult to understand the underlying causes and make improvements. To tackle this issue, we propose a visual analysis method, FSLDiagnotor. Given a set of base learners and a collection of samples with a few shots, we consider two problems: 1) finding a subset of base learners that well predict the sample collections; and 2) replacing the low-quality shots with more representative ones to adequately represent the sample collections. We formulate both problems as sparse subset selection and develop two selection algorithms to recommend appropriate learners and shots, respectively. A matrix visualization and a scatterplot are combined to explain the recommended learners and shots in context and facilitate users in adjusting them. Based on the adjustment, the algorithm updates the recommendation results for another round of improvement. Two case studies are conducted to demonstrate that FSLDiagnotor helps build a few-shot classifier efficiently and increases the accuracy by 12% and 21%, respectively.
Real-Time Visual Analysis of High-Volume Social Media Posts
Aug 06, 2021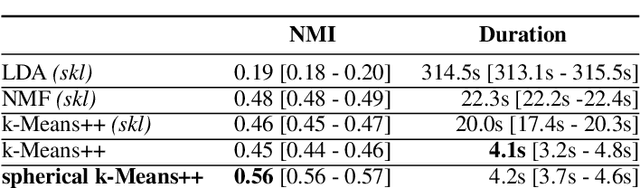
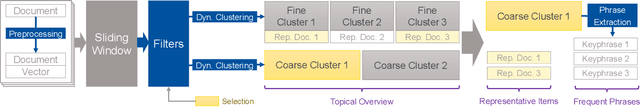
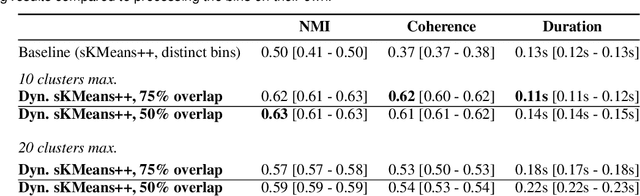
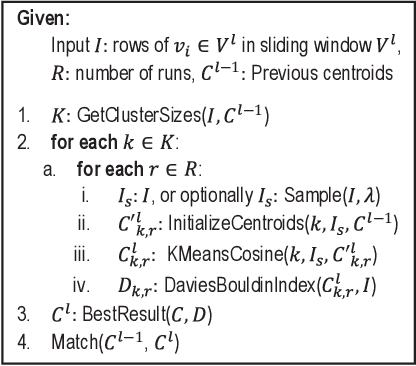
Breaking news and first-hand reports often trend on social media platforms before traditional news outlets cover them. The real-time analysis of posts on such platforms can reveal valuable and timely insights for journalists, politicians, business analysts, and first responders, but the high number and diversity of new posts pose a challenge. In this work, we present an interactive system that enables the visual analysis of streaming social media data on a large scale in real-time. We propose an efficient and explainable dynamic clustering algorithm that powers a continuously updated visualization of the current thematic landscape as well as detailed visual summaries of specific topics of interest. Our parallel clustering strategy provides an adaptive stream with a digestible but diverse selection of recent posts related to relevant topics. We also integrate familiar visual metaphors that are highly interlinked for enabling both explorative and more focused monitoring tasks. Analysts can gradually increase the resolution to dive deeper into particular topics. In contrast to previous work, our system also works with non-geolocated posts and avoids extensive preprocessing such as detecting events. We evaluated our dynamic clustering algorithm and discuss several use cases that show the utility of our system.
Interactive Steering of Hierarchical Clustering
Sep 21, 2020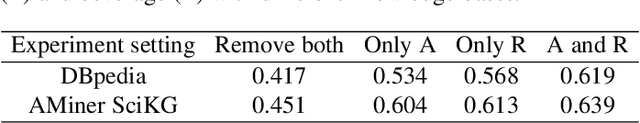
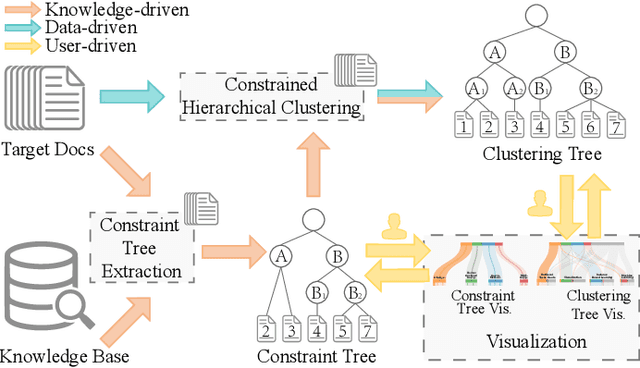
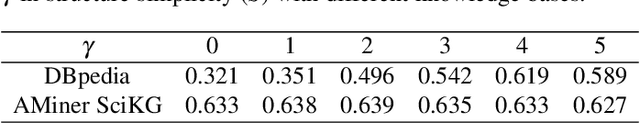
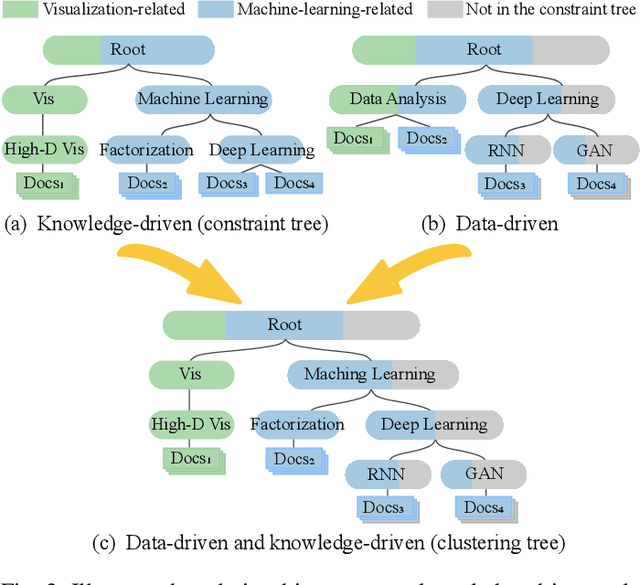
Hierarchical clustering is an important technique to organize big data for exploratory data analysis. However, existing one-size-fits-all hierarchical clustering methods often fail to meet the diverse needs of different users. To address this challenge, we present an interactive steering method to visually supervise constrained hierarchical clustering by utilizing both public knowledge (e.g., Wikipedia) and private knowledge from users. The novelty of our approach includes 1) automatically constructing constraints for hierarchical clustering using knowledge (knowledge-driven) and intrinsic data distribution (data-driven), and 2) enabling the interactive steering of clustering through a visual interface (user-driven). Our method first maps each data item to the most relevant items in a knowledge base. An initial constraint tree is then extracted using the ant colony optimization algorithm. The algorithm balances the tree width and depth and covers the data items with high confidence. Given the constraint tree, the data items are hierarchically clustered using evolutionary Bayesian rose tree. To clearly convey the hierarchical clustering results, an uncertainty-aware tree visualization has been developed to enable users to quickly locate the most uncertain sub-hierarchies and interactively improve them. The quantitative evaluation and case study demonstrate that the proposed approach facilitates the building of customized clustering trees in an efficient and effective manner.
Visual Analysis of Discrimination in Machine Learning
Jul 30, 2020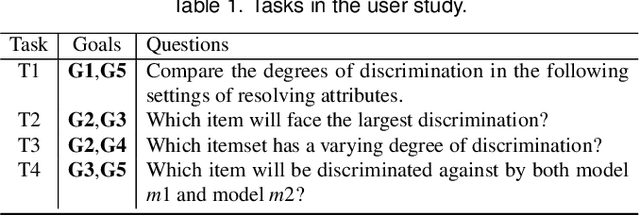
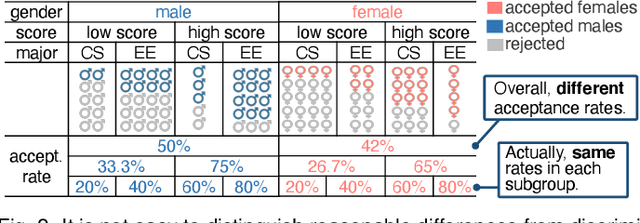
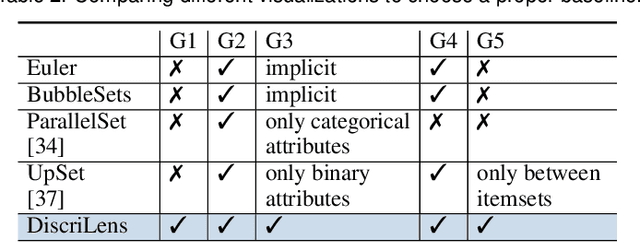
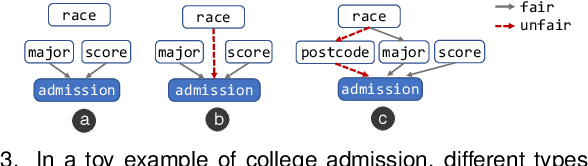
The growing use of automated decision-making in critical applications, such as crime prediction and college admission, has raised questions about fairness in machine learning. How can we decide whether different treatments are reasonable or discriminatory? In this paper, we investigate discrimination in machine learning from a visual analytics perspective and propose an interactive visualization tool, DiscriLens, to support a more comprehensive analysis. To reveal detailed information on algorithmic discrimination, DiscriLens identifies a collection of potentially discriminatory itemsets based on causal modeling and classification rules mining. By combining an extended Euler diagram with a matrix-based visualization, we develop a novel set visualization to facilitate the exploration and interpretation of discriminatory itemsets. A user study shows that users can interpret the visually encoded information in DiscriLens quickly and accurately. Use cases demonstrate that DiscriLens provides informative guidance in understanding and reducing algorithmic discrimination.
Diagnosing Concept Drift with Visual Analytics
Jul 29, 2020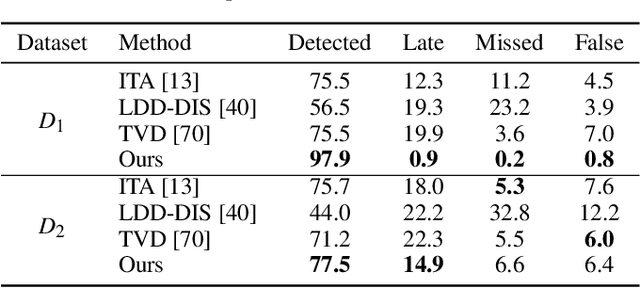
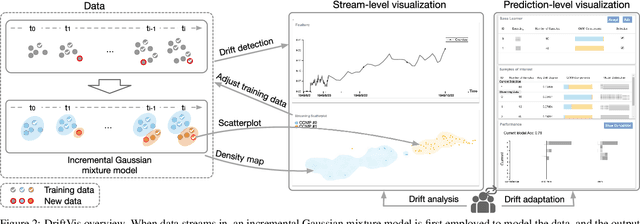
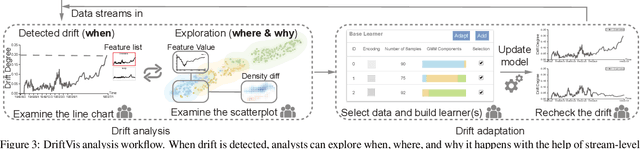
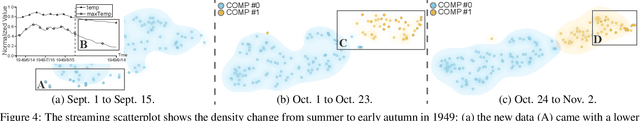
Concept drift is a phenomenon in which the distribution of a data stream changes over time in unforeseen ways, causing prediction models built on historical data to become inaccurate. While a variety of automated methods have been developed to identify when concept drift occurs, there is limited support for analysts who need to understand and correct their models when drift is detected. In this paper, we present a visual analytics method, DriftVis, to support model builders and analysts in the identification and correction of concept drift in streaming data. DriftVis combines a distribution-based drift detection method with a streaming scatterplot to support the analysis of drift caused by the distribution changes of data streams and to explore the impact of these changes on the model's accuracy. Two case studies on weather prediction and text classification have been conducted to demonstrate our proposed tool and illustrate how visual analytics can be used to support the detection, examination, and correction of concept drift.
OoDAnalyzer: Interactive Analysis of Out-of-Distribution Samples
Feb 08, 2020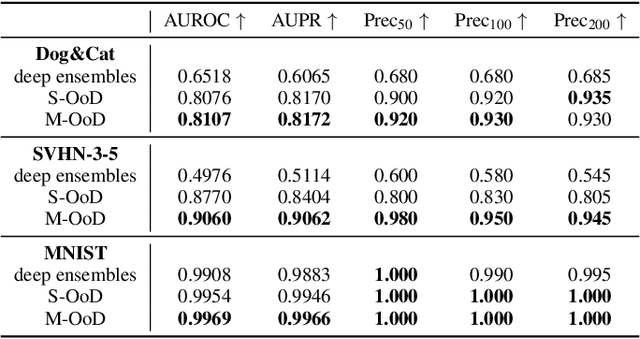
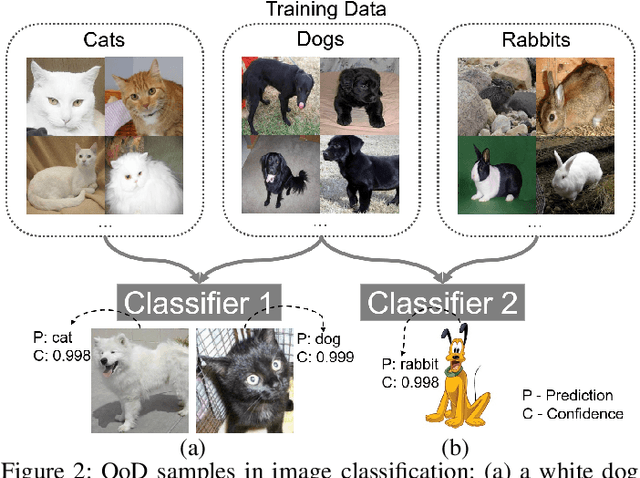
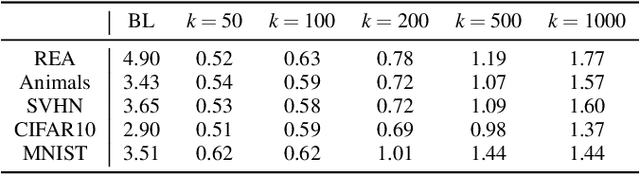
One major cause of performance degradation in predictive models is that the test samples are not well covered by the training data. Such not well-represented samples are called OoD samples. In this paper, we propose OoDAnalyzer, a visual analysis approach for interactively identifying OoD samples and explaining them in context. Our approach integrates an ensemble OoD detection method and a grid-based visualization. The detection method is improved from deep ensembles by combining more features with algorithms in the same family. To better analyze and understand the OoD samples in context, we have developed a novel kNN-based grid layout algorithm motivated by Hall's theorem. The algorithm approximates the optimal layout and has $O(kN^2)$ time complexity, faster than the grid layout algorithm with overall best performance but $O(N^3)$ time complexity. Quantitative evaluation and case studies were performed on several datasets to demonstrate the effectiveness and usefulness of OoDAnalyzer.
Analyzing the Noise Robustness of Deep Neural Networks
Jan 26, 2020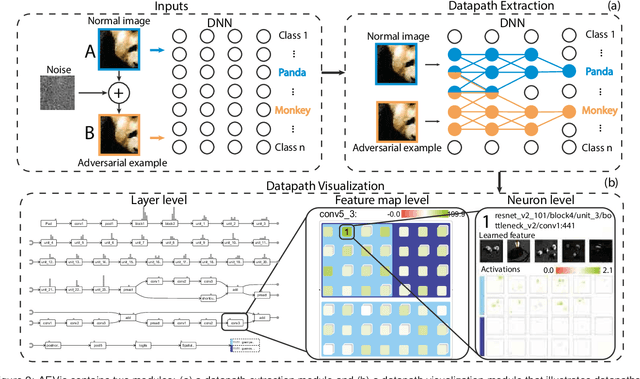
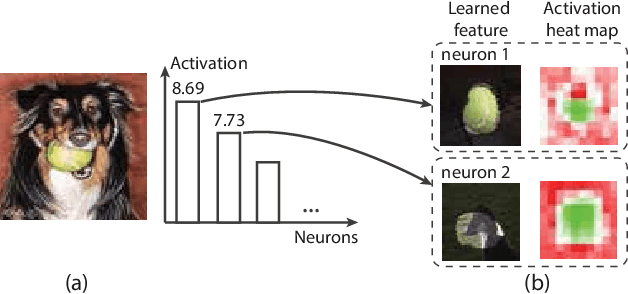
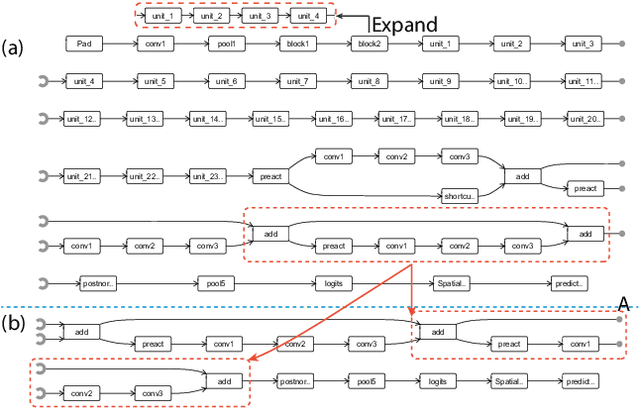
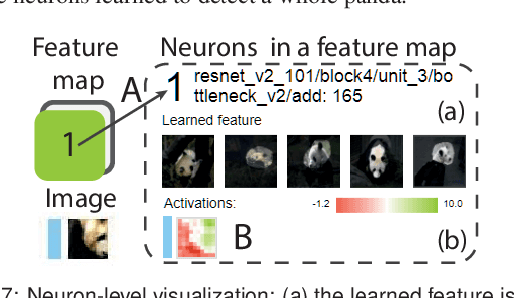
Adversarial examples, generated by adding small but intentionally imperceptible perturbations to normal examples, can mislead deep neural networks (DNNs) to make incorrect predictions. Although much work has been done on both adversarial attack and defense, a fine-grained understanding of adversarial examples is still lacking. To address this issue, we present a visual analysis method to explain why adversarial examples are misclassified. The key is to compare and analyze the datapaths of both the adversarial and normal examples. A datapath is a group of critical neurons along with their connections. We formulate the datapath extraction as a subset selection problem and solve it by constructing and training a neural network. A multi-level visualization consisting of a network-level visualization of data flows, a layer-level visualization of feature maps, and a neuron-level visualization of learned features, has been designed to help investigate how datapaths of adversarial and normal examples diverge and merge in the prediction process. A quantitative evaluation and a case study were conducted to demonstrate the promise of our method to explain the misclassification of adversarial examples.
Recent Research Advances on Interactive Machine Learning
Nov 12, 2018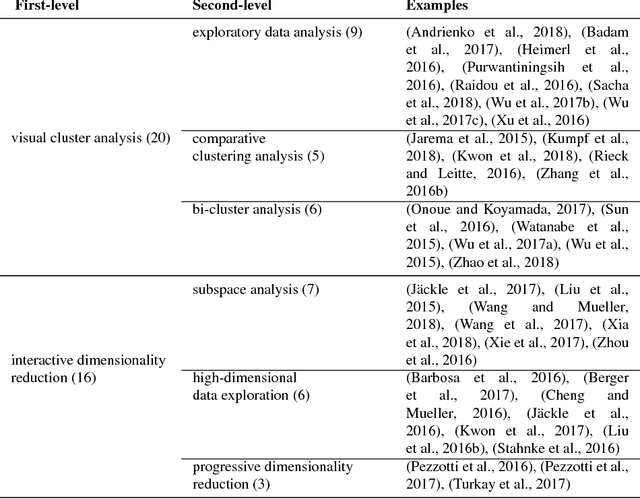
Interactive Machine Learning (IML) is an iterative learning process that tightly couples a human with a machine learner, which is widely used by researchers and practitioners to effectively solve a wide variety of real-world application problems. Although recent years have witnessed the proliferation of IML in the field of visual analytics, most recent surveys either focus on a specific area of IML or aim to summarize a visualization field that is too generic for IML. In this paper, we systematically review the recent literature on IML and classify them into a task-oriented taxonomy built by us. We conclude the survey with a discussion of open challenges and research opportunities that we believe are inspiring for future work in IML.