 Add to Chrome
 Add to Firefox
 Add to Edge
Missing Data Imputation for Classification Problems
Feb 25, 2020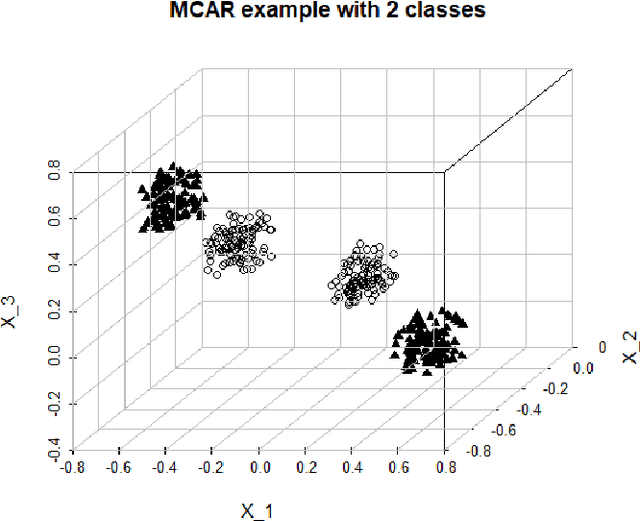
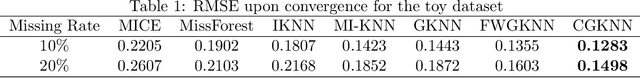
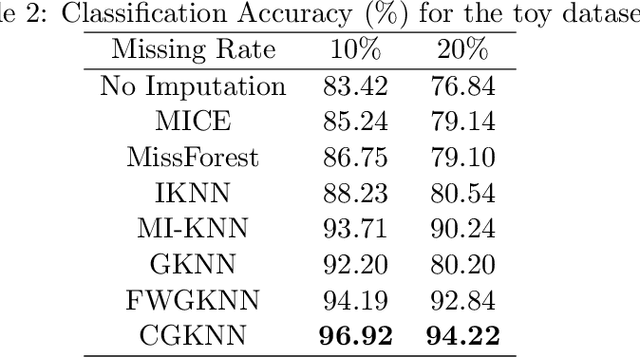
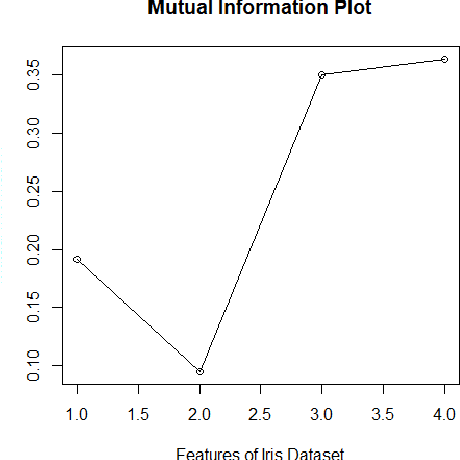
Imputation of missing data is a common application in various classification problems where the feature training matrix has missingness. A widely used solution to this imputation problem is based on the lazy learning technique, $k$-nearest neighbor (kNN) approach. However, most of the previous work on missing data does not take into account the presence of the class label in the classification problem. Also, existing kNN imputation methods use variants of Minkowski distance as a measure of distance, which does not work well with heterogeneous data. In this paper, we propose a novel iterative kNN imputation technique based on class weighted grey distance between the missing datum and all the training data. Grey distance works well in heterogeneous data with missing instances. The distance is weighted by Mutual Information (MI) which is a measure of feature relevance between the features and the class label. This ensures that the imputation of the training data is directed towards improving classification performance. This class weighted grey kNN imputation algorithm demonstrates improved performance when compared to other kNN imputation algorithms, as well as standard imputation algorithms such as MICE and missForest, in imputation and classification problems. These problems are based on simulated scenarios and UCI datasets with various rates of missingness.
Technical Background for "A Precision Medicine Approach to Develop and Internally Validate Optimal Exercise and Weight Loss Treatments for Overweight and Obese Adults with Knee Osteoarthritis"
Feb 20, 2020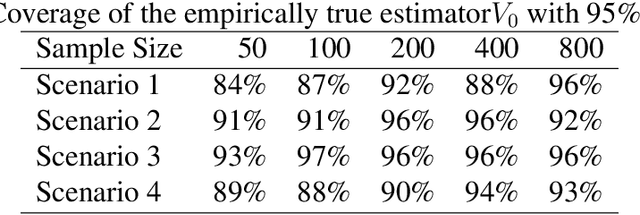
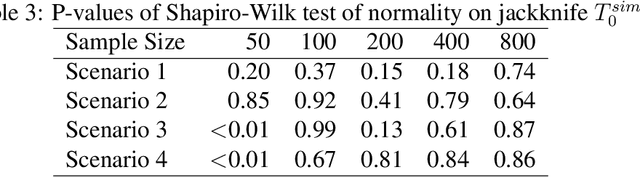
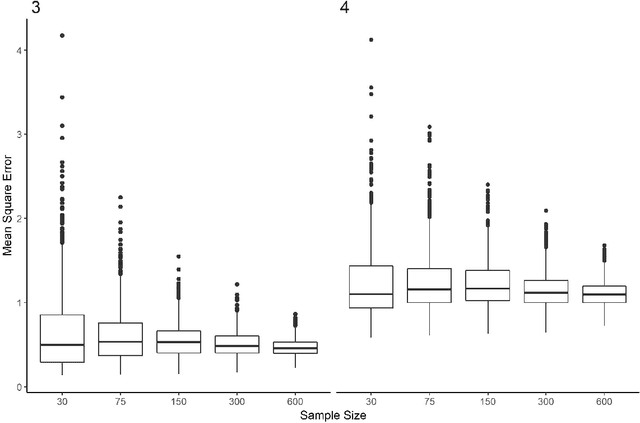
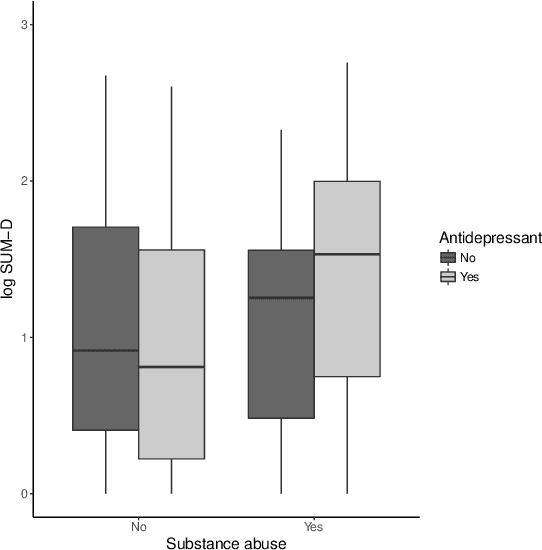
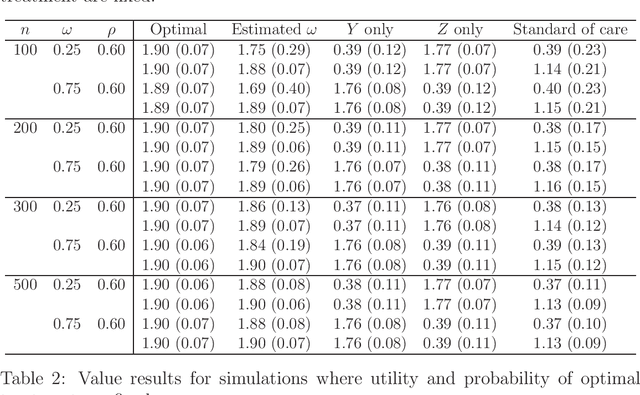
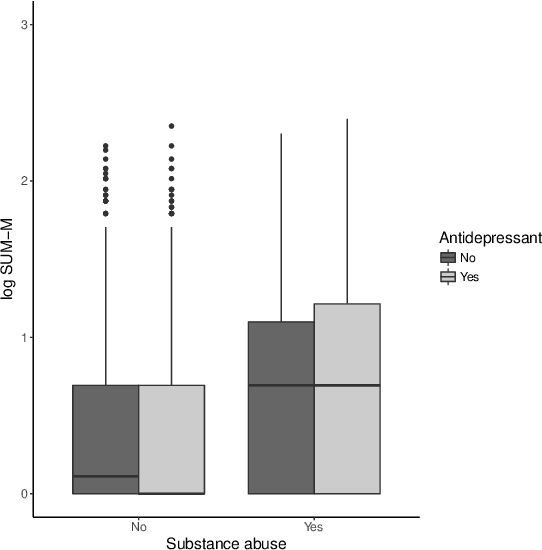
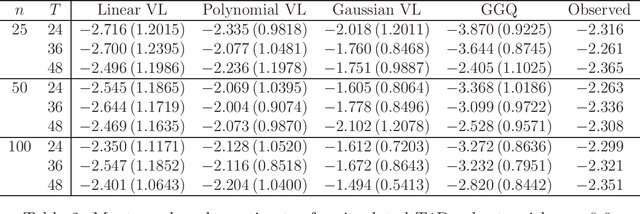
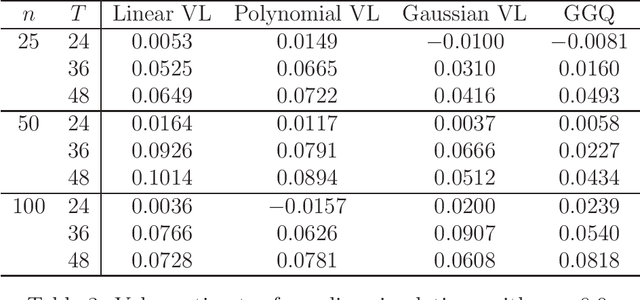
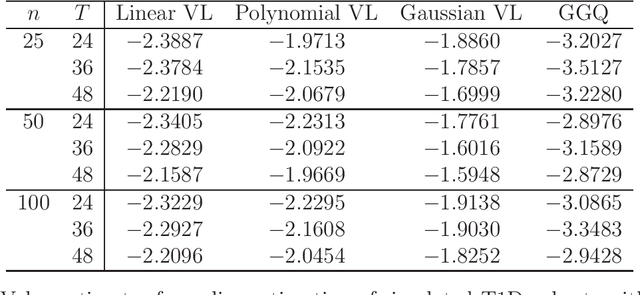
We provide additional statistical background for the methodology developed in the clinical analysis of knee osteoarthritis in "A Precision Medicine Approach to Develop and Internally Validate Optimal Exercise and Weight Loss Treatments for Overweight and Obese Adults with Knee Osteoarthritis" (Jiang et al. 2020). Jiang et al. 2020 proposed a pipeline to learn optimal treatment rules with precision medicine models and compared them with zero-order models with a Z-test. The model performance was based on value functions, a scalar that predicts the future reward of each decision rule. The jackknife (i.e., leave-one-out cross validation) method was applied to estimate the value function and its variance of several outcomes in IDEA. IDEA is a randomized clinical trial studying three interventions (exercise (E), dietary weight loss (D), and D+E) on overweight and obese participants with knee osteoarthritis. In this report, we expand the discussion and justification with additional statistical background. We elaborate more on the background of precision medicine, the derivation of the jackknife estimator of value function and its estimated variance, the consistency property of jackknife estimator, as well as additional simulation results that reflect more of the performance of jackknife estimators. We recommend reading Jiang et al. 2020 for clinical application and interpretation of the optimal ITR of knee osteoarthritis as well as the overall understanding of the pipeline and recommend using this article to understand the underlying statistical derivation and methodology.
Estimating heterogeneous treatment effects with right-censored data via causal survival forests
Jan 27, 2020


There is fast-growing literature on estimating heterogeneous treatment effects via random forests in observational studies. However, there are few approaches available for right-censored survival data. In clinical trials, right-censored survival data are frequently encountered. Quantifying the causal relationship between a treatment and the survival outcome is of great interest. Random forests provide a robust, nonparametric approach to statistical estimation. In addition, recent developments allow forest-based methods to quantify the uncertainty of the estimated heterogeneous treatment effects. We propose causal survival forests that directly target on estimating the treatment effect from an observational study. We establish consistency and asymptotic normality of the proposed estimators and provide an estimator of the asymptotic variance that enables valid confidence intervals of the estimated treatment effect. The performance of our approach is demonstrated via extensive simulations and data from an HIV study.
High dimensional precision medicine from patient-derived xenografts
Dec 13, 2019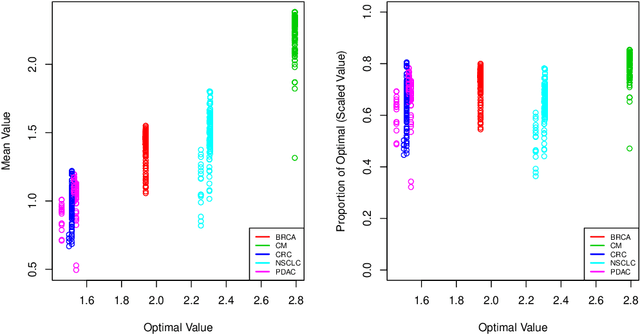
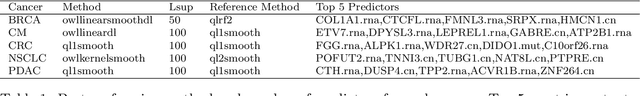
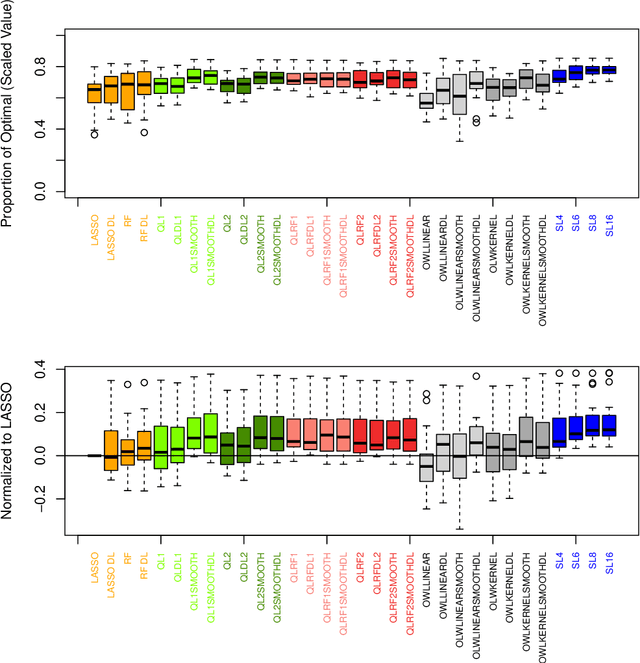
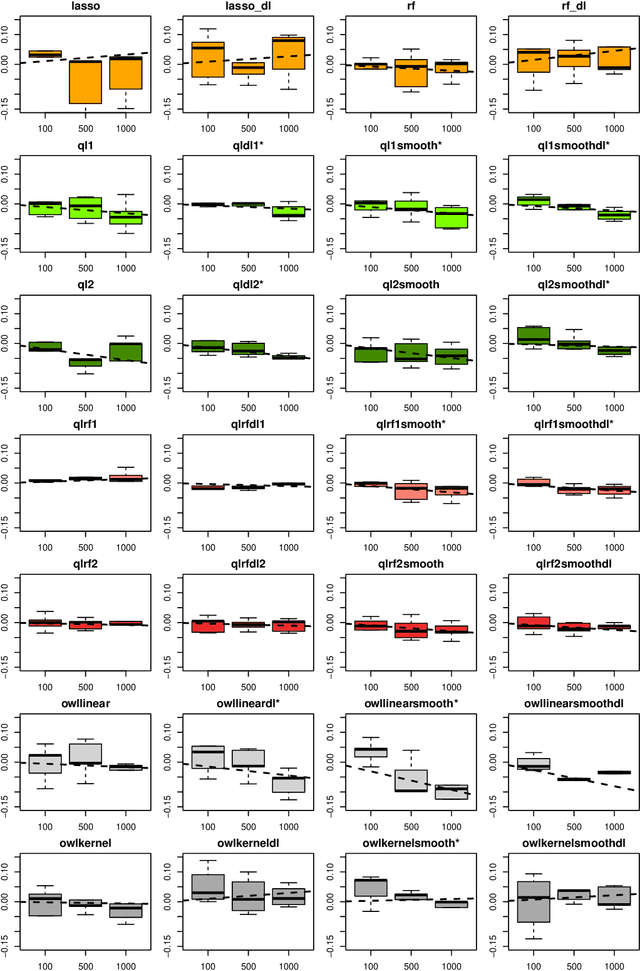
The complexity of human cancer often results in significant heterogeneity in response to treatment. Precision medicine offers potential to improve patient outcomes by leveraging this heterogeneity. Individualized treatment rules (ITRs) formalize precision medicine as maps from the patient covariate space into the space of allowable treatments. The optimal ITR is that which maximizes the mean of a clinical outcome in a population of interest. Patient-derived xenograft (PDX) studies permit the evaluation of multiple treatments within a single tumor and thus are ideally suited for estimating optimal ITRs. PDX data are characterized by correlated outcomes, a high-dimensional feature space, and a large number of treatments. Existing methods for estimating optimal ITRs do not take advantage of the unique structure of PDX data or handle the associated challenges well. In this paper, we explore machine learning methods for estimating optimal ITRs from PDX data. We analyze data from a large PDX study to identify biomarkers that are informative for developing personalized treatment recommendations in multiple cancers. We estimate optimal ITRs using regression-based approaches such as Q-learning and direct search methods such as outcome weighted learning. Finally, we implement a superlearner approach to combine a set of estimated ITRs and show that the resulting ITR performs better than any of the input ITRs, mitigating uncertainty regarding user choice of any particular ITR estimation methodology. Our results indicate that PDX data are a valuable resource for developing individualized treatment strategies in oncology.
Testing Independence with the Binary Expansion Randomized Ensemble Test
Dec 11, 2019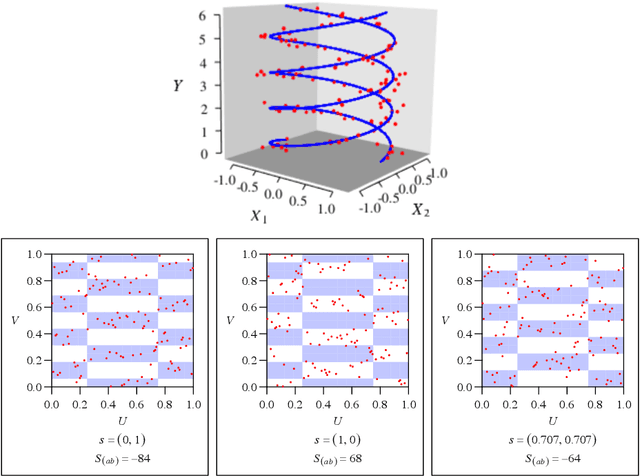
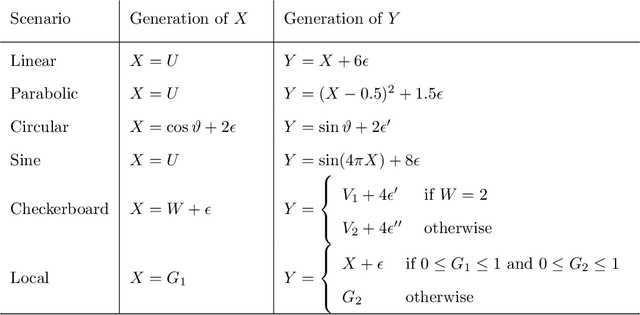
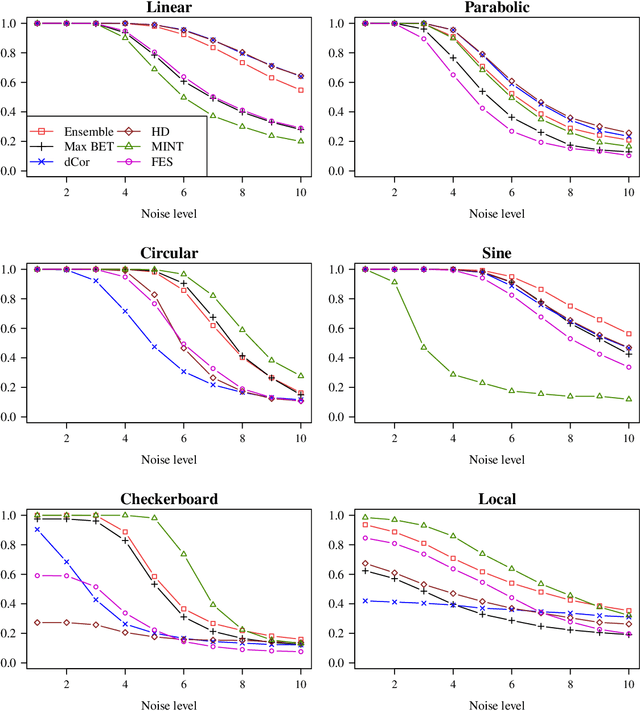

Recently, the binary expansion testing framework was introduced to test the independence of two continuous random variables by utilizing symmetry statistics that are complete sufficient statistics for dependence. We develop a new test by an ensemble method that uses the sum of squared symmetry statistics and distance correlation. Simulation studies suggest that this method improves the power while preserving the clear interpretation of the binary expansion testing. We extend this method to tests of independence of random vectors in arbitrary dimension. By random projections, the proposed binary expansion randomized ensemble test transforms the multivariate independence testing problem into a univariate problem. Simulation studies and data example analyses show that the proposed method provides relatively robust performance compared with existing methods.
Estimating Individualized Treatment Regimes from Crossover Designs
Feb 05, 2019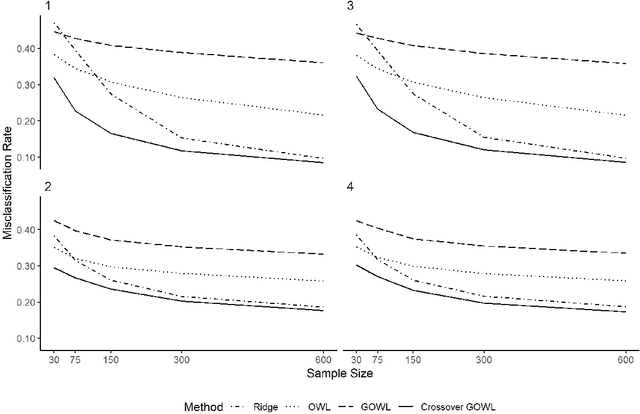
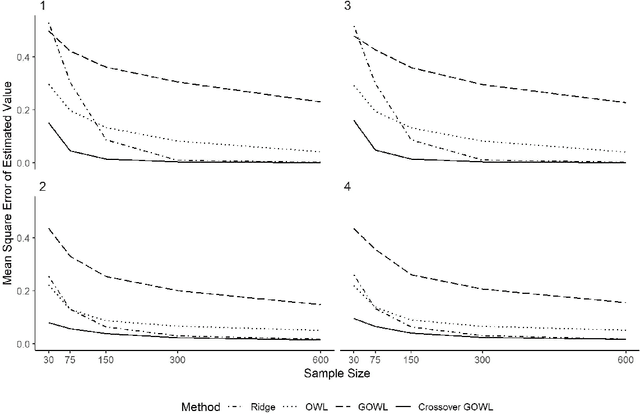
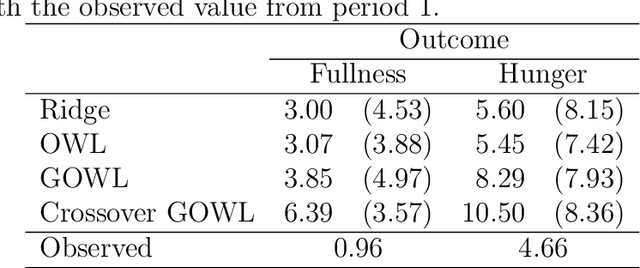
The field of precision medicine aims to tailor treatment based on patient-specific factors in a reproducible way. To this end, estimating an optimal individualized treatment regime (ITR) that recommends treatment decisions based on patient characteristics to maximize the mean of a pre-specified outcome is of particular interest. Several methods have been proposed for estimating an optimal ITR from clinical trial data in the parallel group setting where each subject is randomized to a single intervention. However, little work has been done in the area of estimating the optimal ITR from crossover study designs. Such designs naturally lend themselves to precision medicine, because they allow for observing the response to multiple treatments for each patient. In this paper, we introduce a method for estimating the optimal ITR using data from a 2x2 crossover study with or without carryover effects. The proposed method is similar to policy search methods such as outcome weighted learning; however, we take advantage of the crossover design by using the difference in responses under each treatment as the observed reward. We establish Fisher and global consistency, present numerical experiments, and analyze data from a feeding trial to demonstrate the improved performance of the proposed method compared to standard methods for a parallel study design.
Receiver Operating Characteristic Curves and Confidence Bands for Support Vector Machines
Jul 17, 2018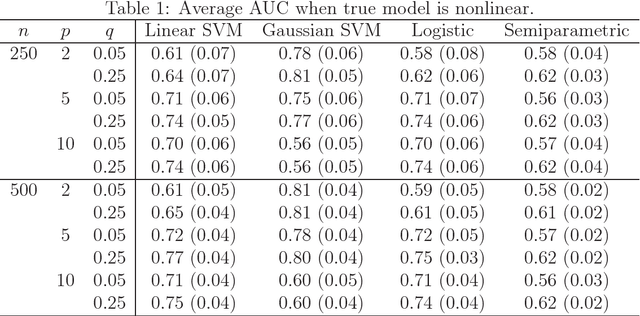
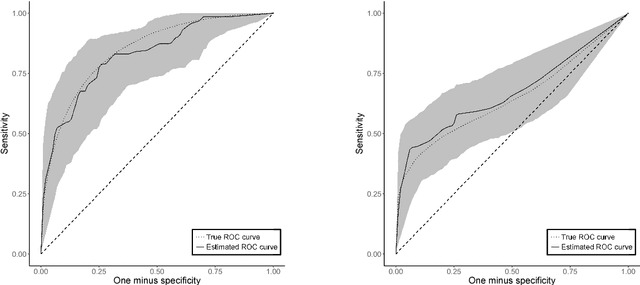
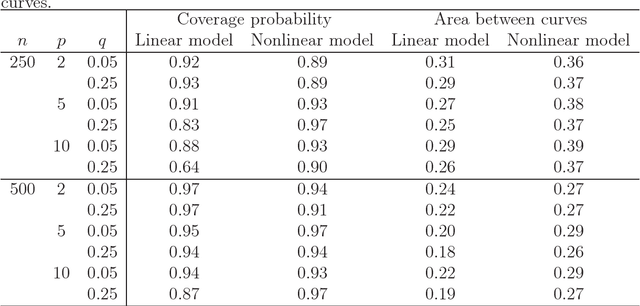
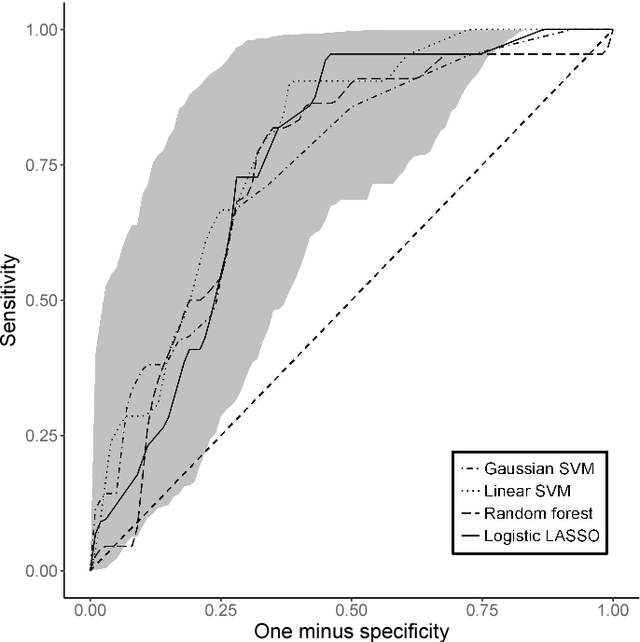
Many problems that appear in biomedical decision making, such as diagnosing disease and predicting response to treatment, can be expressed as binary classification problems. The costs of false positives and false negatives vary across application domains and receiver operating characteristic (ROC) curves provide a visual representation of this trade-off. Nonparametric estimators for the ROC curve, such as a weighted support vector machine (SVM), are desirable because they are robust to model misspecification. While weighted SVMs have great potential for estimating ROC curves, their theoretical properties were heretofore underdeveloped. We propose a method for constructing confidence bands for the SVM ROC curve and provide the theoretical justification for the SVM ROC curve by showing that the risk function of the estimated decision rule is uniformly consistent across the weight parameter. We demonstrate the proposed confidence band method and the superior sensitivity and specificity of the weighted SVM compared to commonly used methods in diagnostic medicine using simulation studies. We present two illustrative examples: diagnosis of hepatitis C and a predictive model for treatment response in breast cancer.
Estimation and Optimization of Composite Outcomes
Feb 13, 2018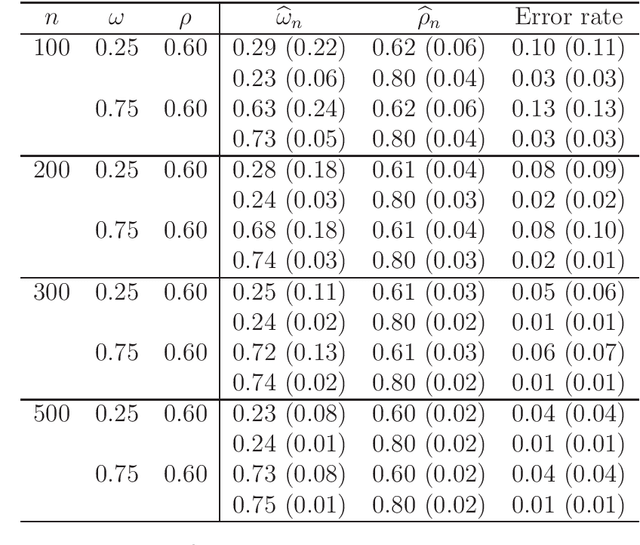
There is tremendous interest in precision medicine as a means to improve patient outcomes by tailoring treatment to individual characteristics. An individualized treatment rule formalizes precision medicine as a map from patient information to a recommended treatment. A rule is defined to be optimal if it maximizes the mean of a scalar outcome in a population of interest, e.g., symptom reduction. However, clinical and intervention scientists often must balance multiple and possibly competing outcomes, e.g., symptom reduction and the risk of an adverse event. One approach to precision medicine in this setting is to elicit a composite outcome which balances all competing outcomes; unfortunately, eliciting a composite outcome directly from patients is difficult without a high-quality instrument and an expert-derived composite outcome may not account for heterogeneity in patient preferences. We consider estimation of composite outcomes using observational data under the assumption that clinicians are approximately (i.e., imperfectly) making decisions to maximize individual patient utility. Estimated composite outcomes are subsequently used to construct an estimator of an individualized treatment rule that maximizes the mean of patient-specific composite outcomes. Furthermore, the estimated composite outcomes and estimated optimal individualized treatment rule can provide new insights into patient preference heterogeneity, clinician behavior, and the value of precision medicine in a given domain. We derive inference procedures for the proposed estimators under mild conditions and demonstrate their finite sample performance through a suite of simulation experiments and an illustrative application to data from a study of bipolar depression.
Causal nearest neighbor rules for optimal treatment regimes
Nov 22, 2017


The estimation of optimal treatment regimes is of considerable interest to precision medicine. In this work, we propose a causal $k$-nearest neighbor method to estimate the optimal treatment regime. The method roots in the framework of causal inference, and estimates the causal treatment effects within the nearest neighborhood. Although the method is simple, it possesses nice theoretical properties. We show that the causal $k$-nearest neighbor regime is universally consistent. That is, the causal $k$-nearest neighbor regime will eventually learn the optimal treatment regime as the sample size increases. We also establish its convergence rate. However, the causal $k$-nearest neighbor regime may suffer from the curse of dimensionality, i.e. performance deteriorates as dimensionality increases. To alleviate this problem, we develop an adaptive causal $k$-nearest neighbor method to perform metric selection and variable selection simultaneously. The performance of the proposed methods is illustrated in simulation studies and in an analysis of a chronic depression clinical trial.
Estimating Dynamic Treatment Regimes in Mobile Health Using V-learning
Oct 14, 2017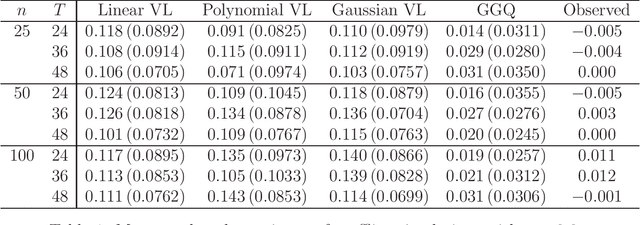
The vision for precision medicine is to use individual patient characteristics to inform a personalized treatment plan that leads to the best healthcare possible for each patient. Mobile technologies have an important role to play in this vision as they offer a means to monitor a patient's health status in real-time and subsequently to deliver interventions if, when, and in the dose that they are needed. Dynamic treatment regimes formalize individualized treatment plans as sequences of decision rules, one per stage of clinical intervention, that map current patient information to a recommended treatment. However, existing methods for estimating optimal dynamic treatment regimes are designed for a small number of fixed decision points occurring on a coarse time-scale. We propose a new reinforcement learning method for estimating an optimal treatment regime that is applicable to data collected using mobile technologies in an outpatient setting. The proposed method accommodates an indefinite time horizon and minute-by-minute decision making that are common in mobile health applications. We show the proposed estimators are consistent and asymptotically normal under mild conditions. The proposed methods are applied to estimate an optimal dynamic treatment regime for controlling blood glucose levels in patients with type 1 diabetes.