 Add to Chrome
 Add to Firefox
 Add to Edge
On the Role of Speech Data in Reducing Toxicity Detection Bias
Nov 12, 2024


Text toxicity detection systems exhibit significant biases, producing disproportionate rates of false positives on samples mentioning demographic groups. But what about toxicity detection in speech? To investigate the extent to which text-based biases are mitigated by speech-based systems, we produce a set of high-quality group annotations for the multilingual MuTox dataset, and then leverage these annotations to systematically compare speech- and text-based toxicity classifiers. Our findings indicate that access to speech data during inference supports reduced bias against group mentions, particularly for ambiguous and disagreement-inducing samples. Our results also suggest that improving classifiers, rather than transcription pipelines, is more helpful for reducing group bias. We publicly release our annotations and provide recommendations for future toxicity dataset construction.
Decomposed evaluations of geographic disparities in text-to-image models
Jun 17, 2024Recent work has identified substantial disparities in generated images of different geographic regions, including stereotypical depictions of everyday objects like houses and cars. However, existing measures for these disparities have been limited to either human evaluations, which are time-consuming and costly, or automatic metrics evaluating full images, which are unable to attribute these disparities to specific parts of the generated images. In this work, we introduce a new set of metrics, Decomposed Indicators of Disparities in Image Generation (Decomposed-DIG), that allows us to separately measure geographic disparities in the depiction of objects and backgrounds in generated images. Using Decomposed-DIG, we audit a widely used latent diffusion model and find that generated images depict objects with better realism than backgrounds and that backgrounds in generated images tend to contain larger regional disparities than objects. We use Decomposed-DIG to pinpoint specific examples of disparities, such as stereotypical background generation in Africa, struggling to generate modern vehicles in Africa, and unrealistically placing some objects in outdoor settings. Informed by our metric, we use a new prompting structure that enables a 52% worst-region improvement and a 20% average improvement in generated background diversity.
An Introduction to Vision-Language Modeling
May 27, 2024


Following the recent popularity of Large Language Models (LLMs), several attempts have been made to extend them to the visual domain. From having a visual assistant that could guide us through unfamiliar environments to generative models that produce images using only a high-level text description, the vision-language model (VLM) applications will significantly impact our relationship with technology. However, there are many challenges that need to be addressed to improve the reliability of those models. While language is discrete, vision evolves in a much higher dimensional space in which concepts cannot always be easily discretized. To better understand the mechanics behind mapping vision to language, we present this introduction to VLMs which we hope will help anyone who would like to enter the field. First, we introduce what VLMs are, how they work, and how to train them. Then, we present and discuss approaches to evaluate VLMs. Although this work primarily focuses on mapping images to language, we also discuss extending VLMs to videos.
Does Progress On Object Recognition Benchmarks Improve Real-World Generalization?
Jul 24, 2023


For more than a decade, researchers have measured progress in object recognition on ImageNet-based generalization benchmarks such as ImageNet-A, -C, and -R. Recent advances in foundation models, trained on orders of magnitude more data, have begun to saturate these standard benchmarks, but remain brittle in practice. This suggests standard benchmarks, which tend to focus on predefined or synthetic changes, may not be sufficient for measuring real world generalization. Consequently, we propose studying generalization across geography as a more realistic measure of progress using two datasets of objects from households across the globe. We conduct an extensive empirical evaluation of progress across nearly 100 vision models up to most recent foundation models. We first identify a progress gap between standard benchmarks and real-world, geographical shifts: progress on ImageNet results in up to 2.5x more progress on standard generalization benchmarks than real-world distribution shifts. Second, we study model generalization across geographies by measuring the disparities in performance across regions, a more fine-grained measure of real world generalization. We observe all models have large geographic disparities, even foundation CLIP models, with differences of 7-20% in accuracy between regions. Counter to modern intuition, we discover progress on standard benchmarks fails to improve geographic disparities and often exacerbates them: geographic disparities between the least performant models and today's best models have more than tripled. Our results suggest scaling alone is insufficient for consistent robustness to real-world distribution shifts. Finally, we highlight in early experiments how simple last layer retraining on more representative, curated data can complement scaling as a promising direction of future work, reducing geographic disparity on both benchmarks by over two-thirds.
Pinpointing Why Object Recognition Performance Degrades Across Income Levels and Geographies
Apr 11, 2023


Despite impressive advances in object-recognition, deep learning systems' performance degrades significantly across geographies and lower income levels raising pressing concerns of inequity. Addressing such performance gaps remains a challenge, as little is understood about why performance degrades across incomes or geographies. We take a step in this direction by annotating images from Dollar Street, a popular benchmark of geographically and economically diverse images, labeling each image with factors such as color, shape, and background. These annotations unlock a new granular view into how objects differ across incomes and regions. We then use these object differences to pinpoint model vulnerabilities across incomes and regions. We study a range of modern vision models, finding that performance disparities are most associated with differences in texture, occlusion, and images with darker lighting. We illustrate how insights from our factor labels can surface mitigations to improve models' performance disparities. As an example, we show that mitigating a model's vulnerability to texture can improve performance on the lower income level. We release all the factor annotations along with an interactive dashboard to facilitate research into more equitable vision systems.
Development and Validation of ML-DQA -- a Machine Learning Data Quality Assurance Framework for Healthcare
Aug 04, 2022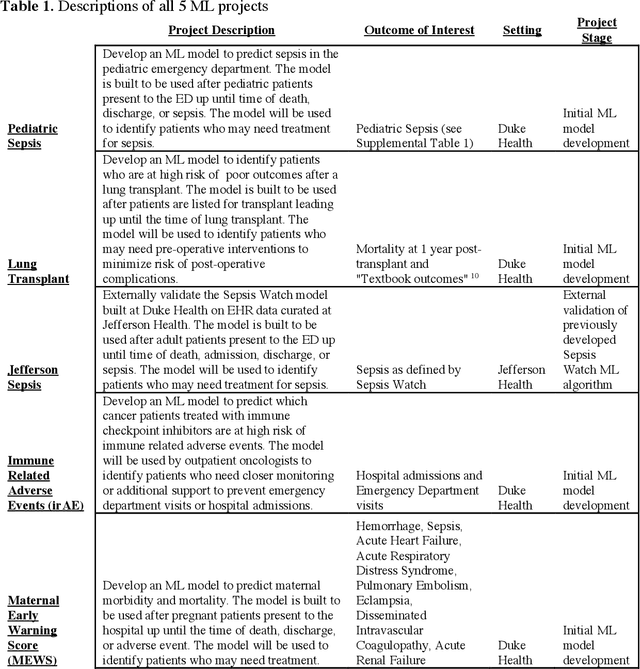
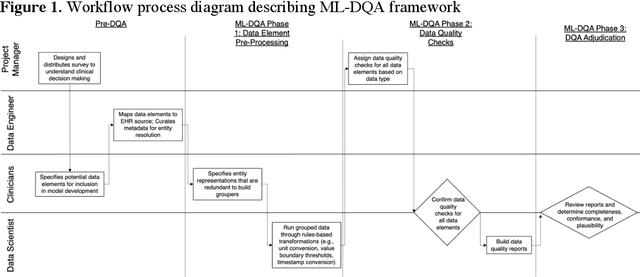
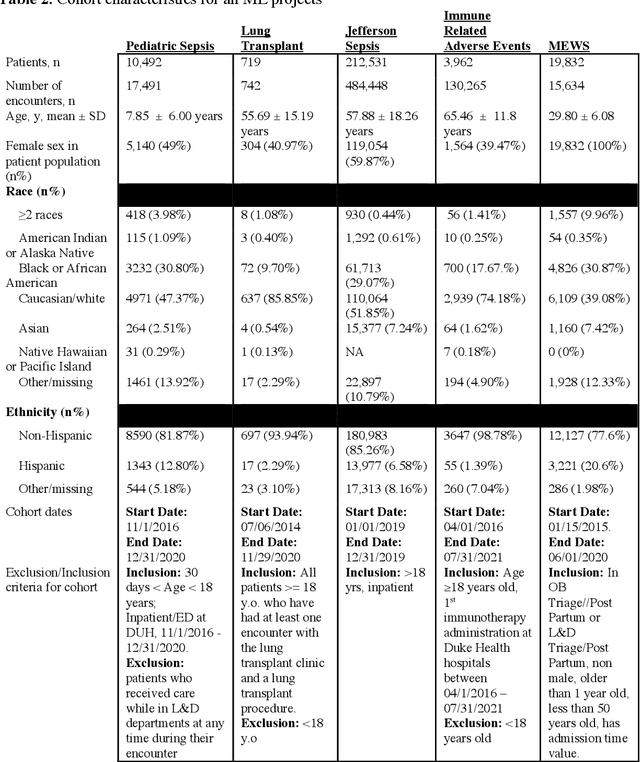
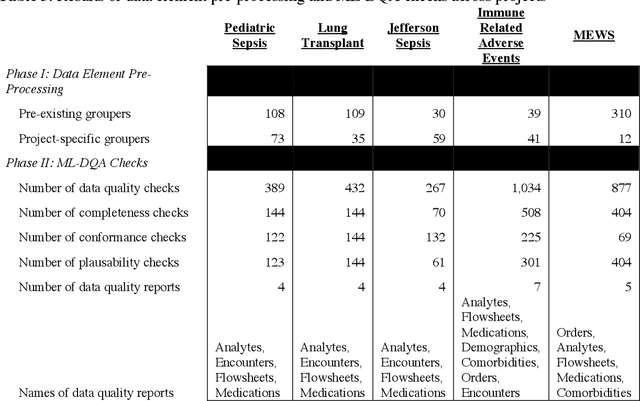
The approaches by which the machine learning and clinical research communities utilize real world data (RWD), including data captured in the electronic health record (EHR), vary dramatically. While clinical researchers cautiously use RWD for clinical investigations, ML for healthcare teams consume public datasets with minimal scrutiny to develop new algorithms. This study bridges this gap by developing and validating ML-DQA, a data quality assurance framework grounded in RWD best practices. The ML-DQA framework is applied to five ML projects across two geographies, different medical conditions, and different cohorts. A total of 2,999 quality checks and 24 quality reports were generated on RWD gathered on 247,536 patients across the five projects. Five generalizable practices emerge: all projects used a similar method to group redundant data element representations; all projects used automated utilities to build diagnosis and medication data elements; all projects used a common library of rules-based transformations; all projects used a unified approach to assign data quality checks to data elements; and all projects used a similar approach to clinical adjudication. An average of 5.8 individuals, including clinicians, data scientists, and trainees, were involved in implementing ML-DQA for each project and an average of 23.4 data elements per project were either transformed or removed in response to ML-DQA. This study demonstrates the importance role of ML-DQA in healthcare projects and provides teams a framework to conduct these essential activities.