 Add to Chrome
 Add to Firefox
 Add to Edge
Efficient WiFi LiDAR SLAM for Autonomous Robots in Large Environments
Jun 17, 2022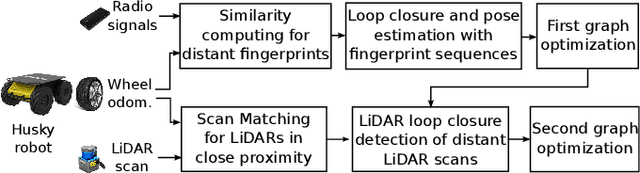
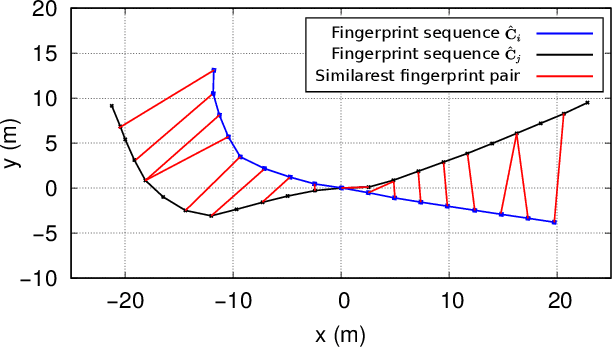
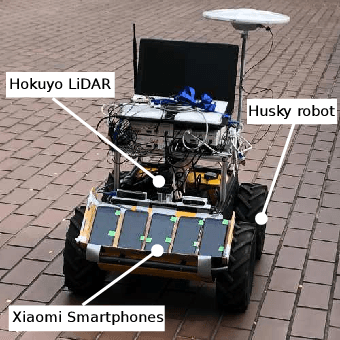
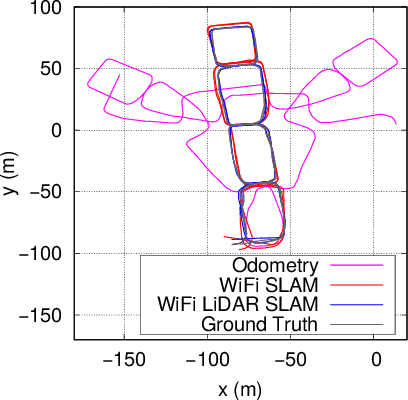
Autonomous robots operating in indoor and GPS denied environments can use LiDAR for SLAM instead. However, LiDARs do not perform well in geometrically-degraded environments, due to the challenge of loop closure detection and computational load to perform scan matching. Existing WiFi infrastructure can be exploited for localization and mapping with low hardware and computational cost. Yet, accurate pose estimation using WiFi is challenging as different signal values can be measured at the same location due to the unpredictability of signal propagation. Therefore, we introduce the use of WiFi fingerprint sequence for pose estimation (i.e. loop closure) in SLAM. This approach exploits the spatial coherence of location fingerprints obtained while a mobile robot is moving. This has better capability of correcting odometry drift. The method also incorporates LiDAR scans and thus, improving computational efficiency for large and geometrically-degraded environments while maintaining the accuracy of LiDAR SLAM. We conducted experiments in an indoor environment to illustrate the effectiveness of the method. The results are evaluated based on Root Mean Square Error (RMSE) and it has achieved an accuracy of 0.88m for the test environment.
Collaborative Radio SLAM for Multiple Robots based on WiFi Fingerprint Similarity
Oct 20, 2021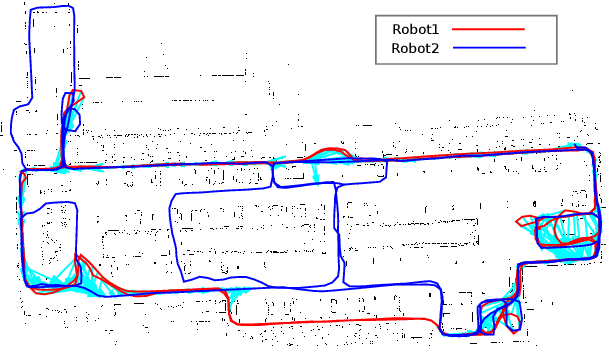
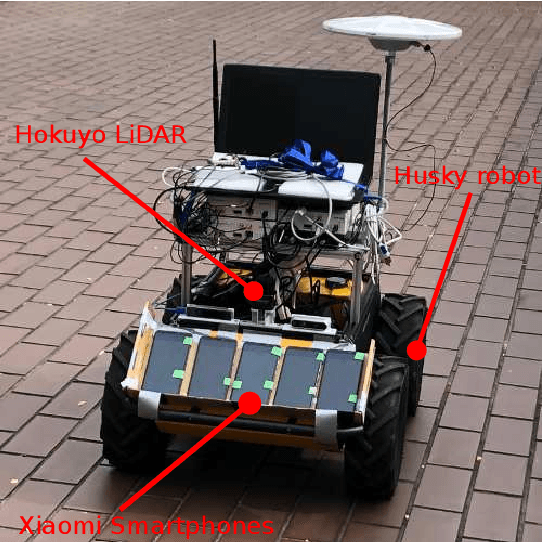
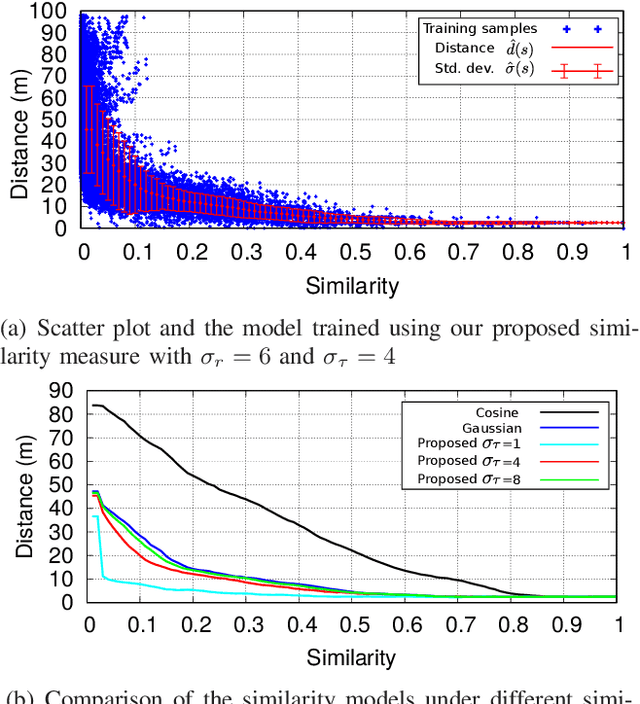
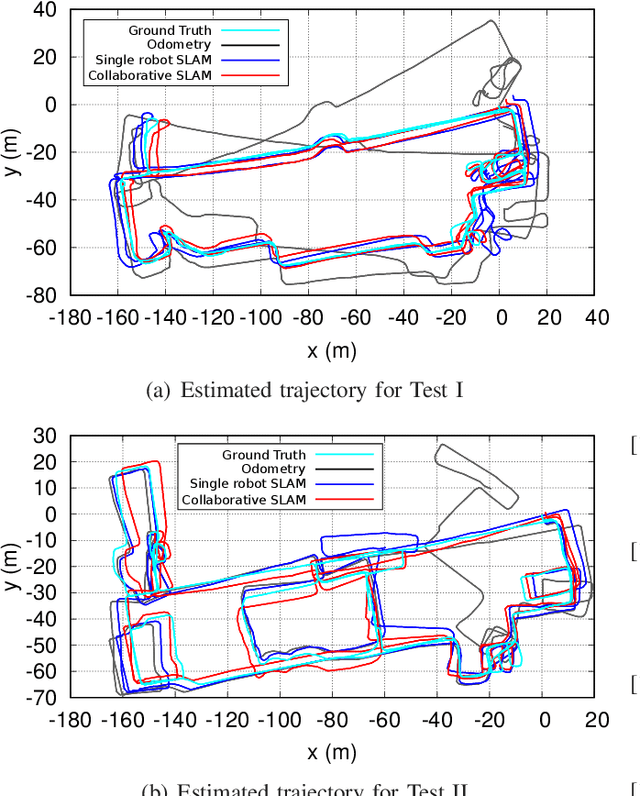
Simultaneous Localization and Mapping (SLAM) enables autonomous robots to navigate and execute their tasks through unknown environments. However, performing SLAM in large environments with a single robot is not efficient, and visual or LiDAR-based SLAM requires feature extraction and matching algorithms, which are computationally expensive. In this paper, we present a collaborative SLAM approach with multiple robots using the pervasive WiFi radio signals. A centralized solution is proposed to optimize the trajectory based on the odometry and radio fingerprints collected from multiple robots. To improve the localization accuracy, a novel similarity model is introduced that combines received signal strength (RSS) and detection likelihood of an access point (AP). We perform extensive experiments to demonstrate the effectiveness of the proposed similarity model and collaborative SLAM framework.
Lithium-ion Battery State of Health Estimation based on Cycle Synchronization using Dynamic Time Warping
Sep 28, 2021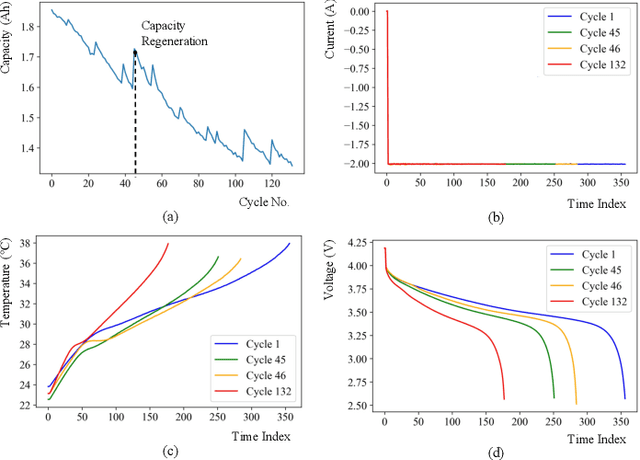
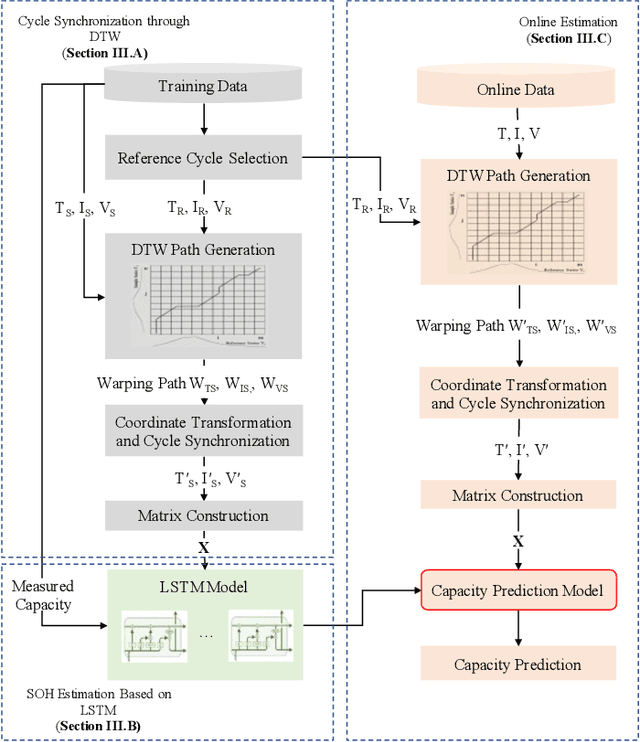
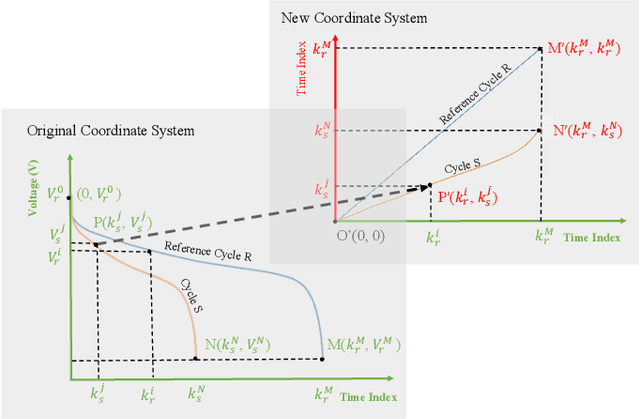
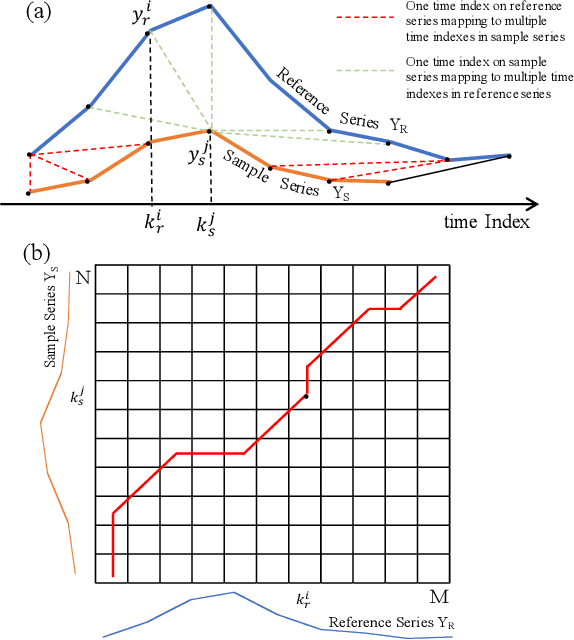
The state of health (SOH) estimation plays an essential role in battery-powered applications to avoid unexpected breakdowns due to battery capacity fading. However, few studies have paid attention to the problem of uneven length of degrading cycles, simply employing manual operation or leaving to the automatic processing mechanism of advanced machine learning models, like long short-term memory (LSTM). As a result, this causes information loss and caps the full capability of the data-driven SOH estimation models. To address this challenge, this paper proposes an innovative cycle synchronization way to change the existing coordinate system using dynamic time warping, not only enabling the equal length inputs of the estimation model but also preserving all information. By exploiting the time information of the time series, the proposed method embeds the time index and the original measurements into a novel indicator to reflect the battery degradation status, which could have the same length over cycles. Adopting the LSTM as the basic estimation model, the cycle synchronization-based SOH model could significantly improve the prediction accuracy by more than 30% compared to the traditional LSTM.
Cost-effective Mapping of Mobile Robot Based on the Fusion of UWB and Short-range 2D LiDAR
Jun 07, 2021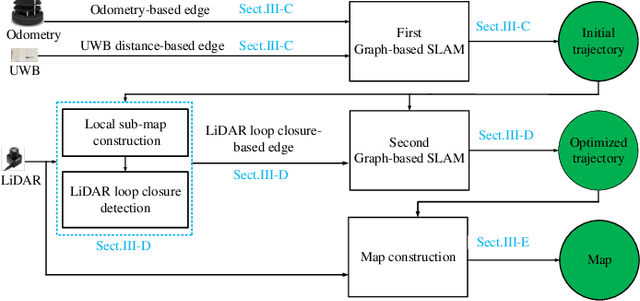
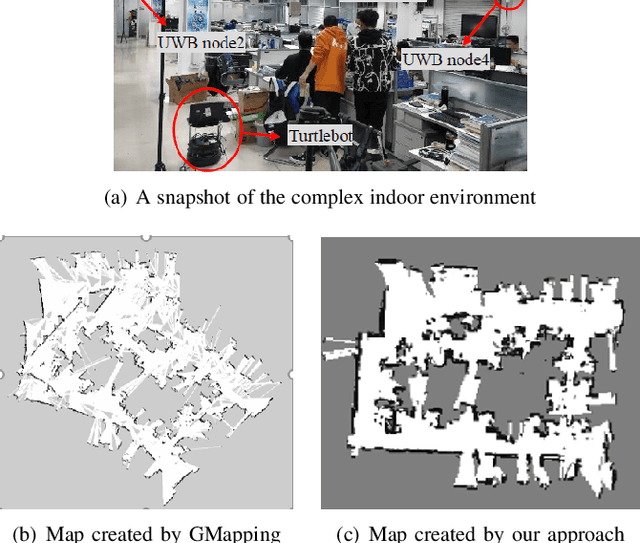
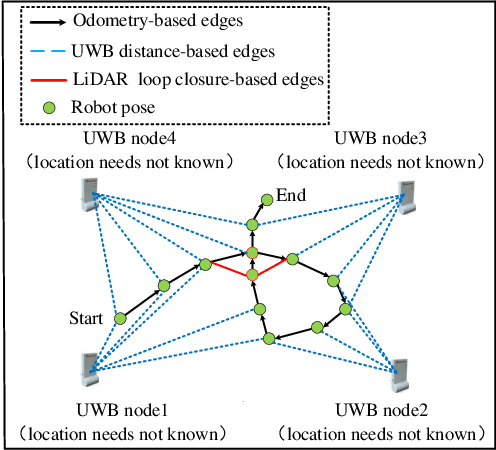
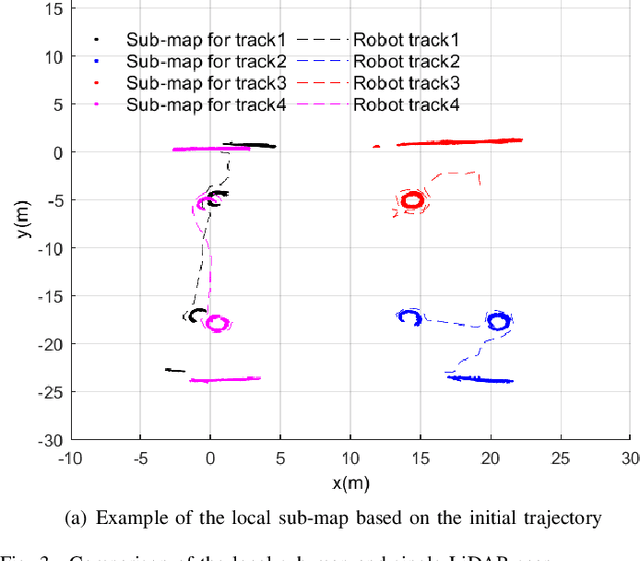
Environment mapping is an essential prerequisite for mobile robots to perform different tasks such as navigation and mission planning. With the availability of low-cost 2D LiDARs, there are increasing applications of such 2D LiDARs in industrial environments. However, environment mapping in an unknown and feature-less environment with such low-cost 2D LiDARs remains a challenge. The challenge mainly originates from the short-range of LiDARs and complexities in performing scan matching in these environments. In order to resolve these shortcomings, we propose to fuse the ultra-wideband (UWB) with 2D LiDARs to improve the mapping quality of a mobile robot. The optimization-based approach is utilized for the fusion of UWB ranging information and odometry to first optimize the trajectory. Then the LiDAR-based loop closures are incorporated to improve the accuracy of the trajectory estimation. Finally, the optimized trajectory is combined with the LiDAR scans to produce the occupancy map of the environment. The performance of the proposed approach is evaluated in an indoor feature-less environment with a size of 20m*20m. Obtained results show that the mapping error of the proposed scheme is 85.5% less than that of the conventional GMapping algorithm with short-range LiDAR (for example Hokuyo URG-04LX in our experiment with a maximum range of 5.6m).
WiFi Fingerprint Clustering for Urban Mobility Analysis
May 04, 2021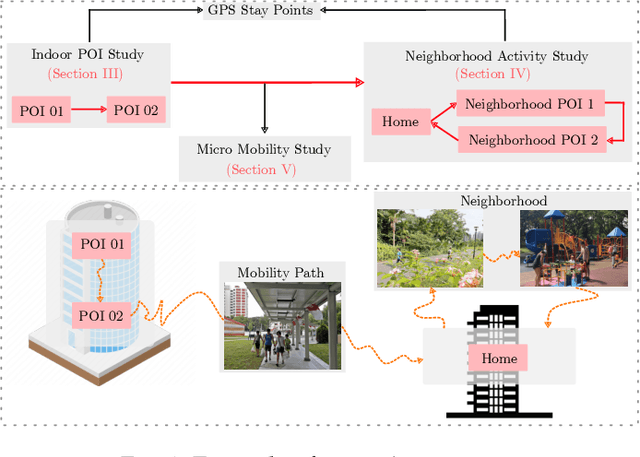
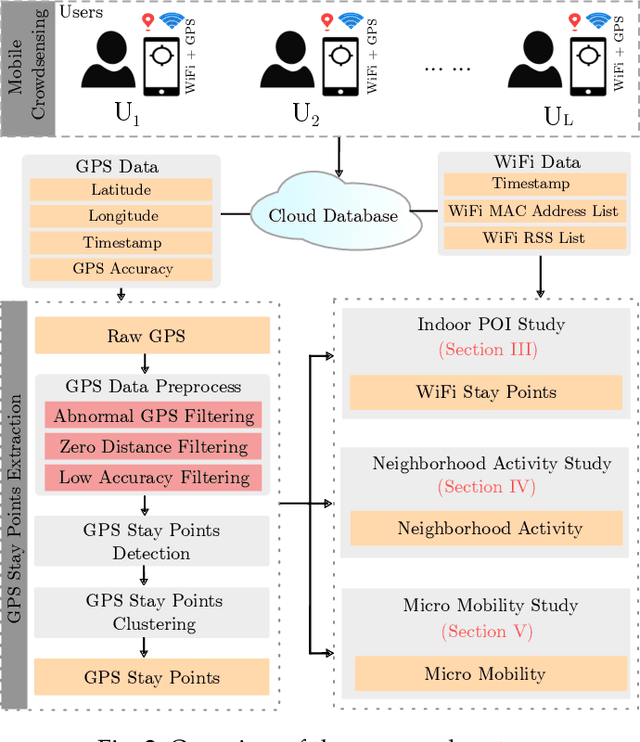
In this paper, we present an unsupervised learning approach to identify the user points of interest (POI) by exploiting WiFi measurements from smartphone application data. Due to the lack of GPS positioning accuracy in indoor, sheltered, and high rise building environments, we rely on widely available WiFi access points (AP) in contemporary urban areas to accurately identify POI and mobility patterns, by comparing the similarity in the WiFi measurements. We propose a system architecture to scan the surrounding WiFi AP, and perform unsupervised learning to demonstrate that it is possible to identify three major insights, namely the indoor POI within a building, neighbourhood activity, and micro-mobility of the users. Our results show that it is possible to identify the aforementioned insights, with the fusion of WiFi and GPS, which are not possible to identify by only using GPS.
Multiple-Perspective Clustering of Passive Wi-Fi Sensing Trajectory Data
Dec 22, 2020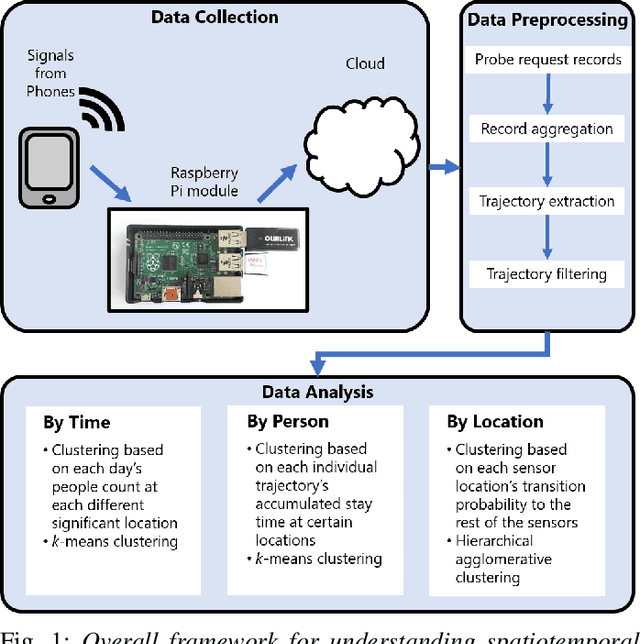
Information about the spatiotemporal flow of humans within an urban context has a wide plethora of applications. Currently, although there are many different approaches to collect such data, there lacks a standardized framework to analyze it. The focus of this paper is on the analysis of the data collected through passive Wi-Fi sensing, as such passively collected data can have a wide coverage at low cost. We propose a systematic approach by using unsupervised machine learning methods, namely k-means clustering and hierarchical agglomerative clustering (HAC) to analyze data collected through such a passive Wi-Fi sniffing method. We examine three aspects of clustering of the data, namely by time, by person, and by location, and we present the results obtained by applying our proposed approach on a real-world dataset collected over five months.
Urban Space Insights Extraction using Acoustic Histogram Information
Dec 14, 2020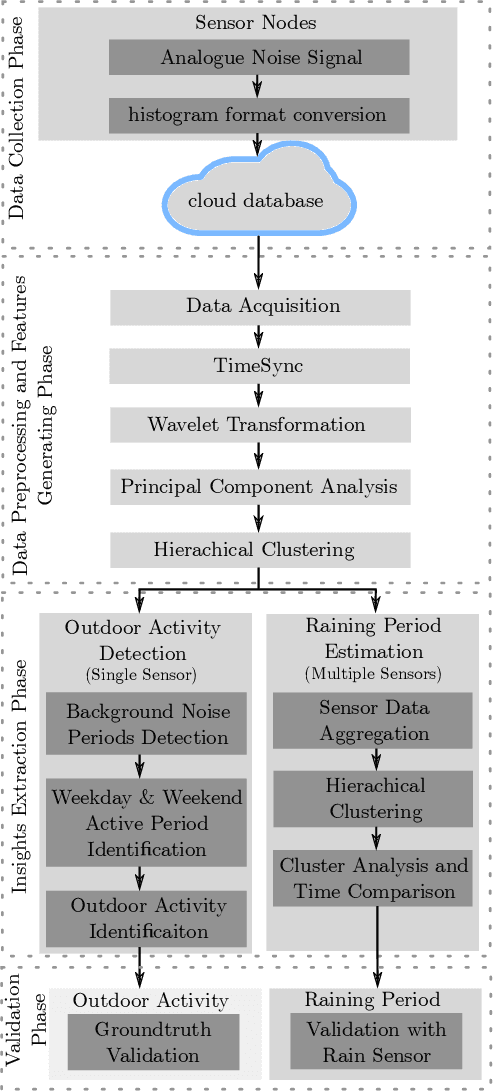
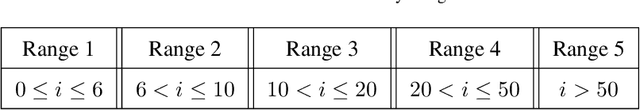
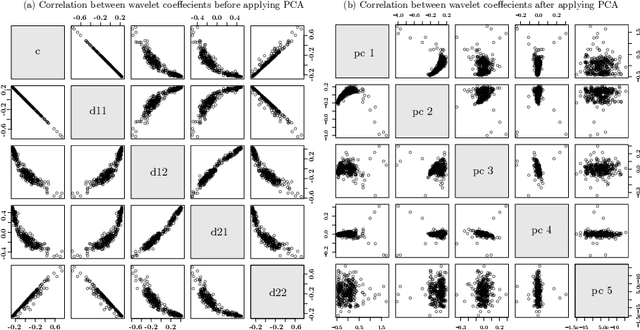
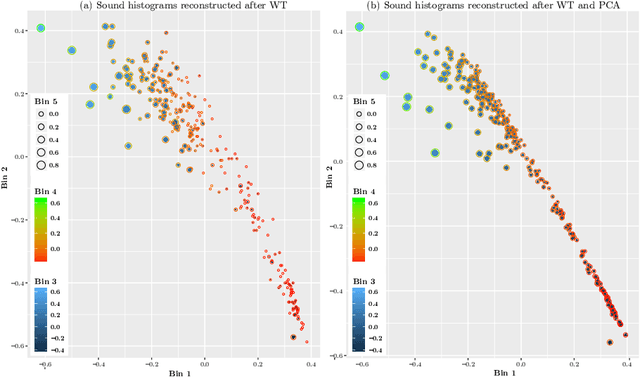
Urban data mining can be identified as a highly potential area that can enhance the smart city services towards better sustainable development especially in the urban residential activity tracking. While existing human activity tracking systems have demonstrated the capability to unveil the hidden aspects of citizens' behavior, they often come with a high implementation cost and require a large communication bandwidth. In this paper, we study the implementation of low-cost analogue sound sensors to detect outdoor activities and estimate the raining period in an urban residential area. The analogue sound sensors are transmitted to the cloud every 5 minutes in histogram format, which consists of sound data sampled every 100ms (10Hz). We then use wavelet transformation (WT) and principal component analysis (PCA) to generate a more robust and consistent feature set from the histogram. After that, we performed unsupervised clustering and attempt to understand the individual characteristics of each cluster to identify outdoor residential activities. In addition, on-site validation has been conducted to show the effectiveness of our approach.
Understanding Crowd Behaviors in a Social Event by Passive WiFi Sensing and Data Mining
Feb 05, 2020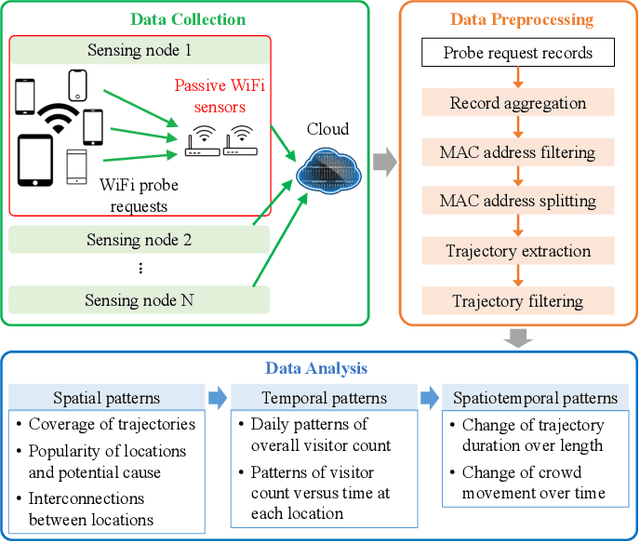
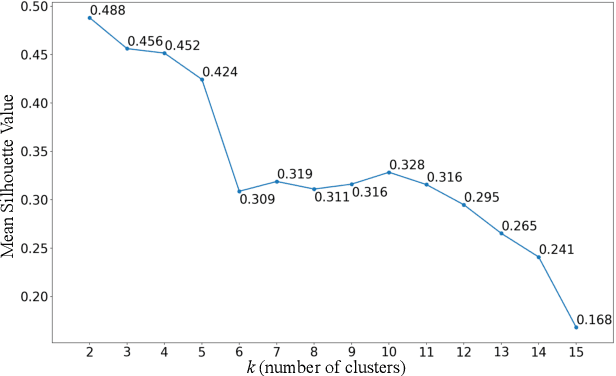
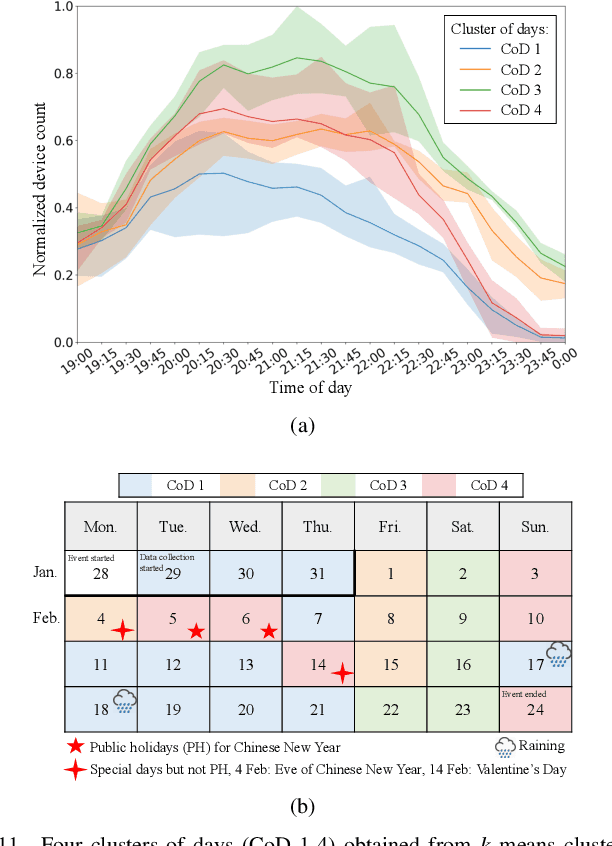
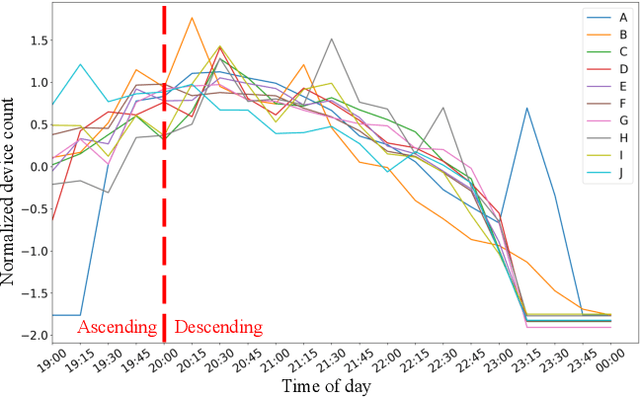
Understanding crowd behaviors in a large social event is crucial for event management. Passive WiFi sensing, by collecting WiFi probe requests sent from mobile devices, provides a better way to monitor crowds compared with people counters and cameras in terms of free interference, larger coverage, lower cost, and more information on people's movement. In existing studies, however, not enough attention has been paid to the thorough analysis and mining of collected data. Especially, the power of machine learning has not been fully exploited. In this paper, therefore, we propose a comprehensive data analysis framework to fully analyze the collected probe requests to extract three types of patterns related to crowd behaviors in a large social event, with the help of statistics, visualization, and unsupervised machine learning. First, trajectories of the mobile devices are extracted from probe requests and analyzed to reveal the spatial patterns of the crowds' movement. Hierarchical agglomerative clustering is adopted to find the interconnections between different locations. Next, k-means and k-shape clustering algorithms are applied to extract temporal visiting patterns of the crowds by days and locations, respectively. Finally, by combining with time, trajectories are transformed into spatiotemporal patterns, which reveal how trajectory duration changes over the length and how the overall trends of crowd movement change over time. The proposed data analysis framework is fully demonstrated using real-world data collected in a large social event. Results show that one can extract comprehensive patterns from data collected by a network of passive WiFi sensors.