 Add to Chrome
 Add to Firefox
 Add to Edge
Mitosis domain generalization in histopathology images -- The MIDOG challenge
Apr 06, 2022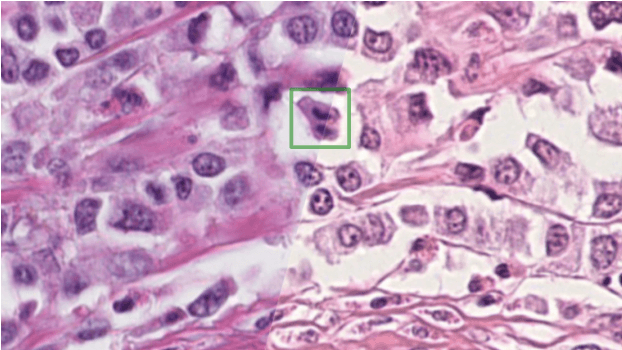
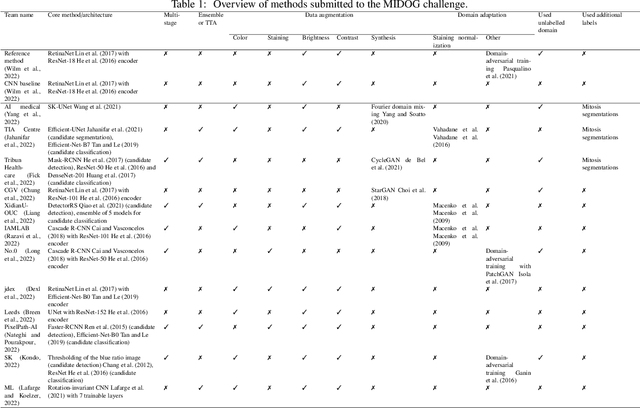
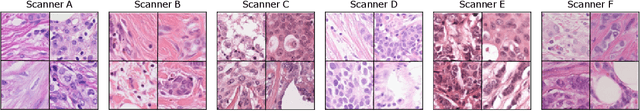
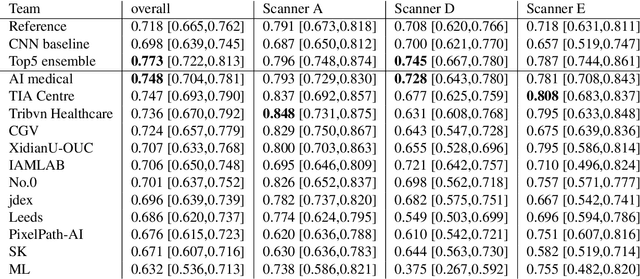
The density of mitotic figures within tumor tissue is known to be highly correlated with tumor proliferation and thus is an important marker in tumor grading. Recognition of mitotic figures by pathologists is known to be subject to a strong inter-rater bias, which limits the prognostic value. State-of-the-art deep learning methods can support the expert in this assessment but are known to strongly deteriorate when applied in a different clinical environment than was used for training. One decisive component in the underlying domain shift has been identified as the variability caused by using different whole slide scanners. The goal of the MICCAI MIDOG 2021 challenge has been to propose and evaluate methods that counter this domain shift and derive scanner-agnostic mitosis detection algorithms. The challenge used a training set of 200 cases, split across four scanning systems. As a test set, an additional 100 cases split across four scanning systems, including two previously unseen scanners, were given. The best approaches performed on an expert level, with the winning algorithm yielding an F_1 score of 0.748 (CI95: 0.704-0.781). In this paper, we evaluate and compare the approaches that were submitted to the challenge and identify methodological factors contributing to better performance.
Self-Supervised Speech Representations Preserve Speech Characteristics while Anonymizing Voices
Apr 04, 2022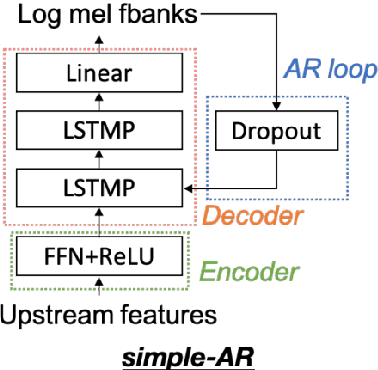
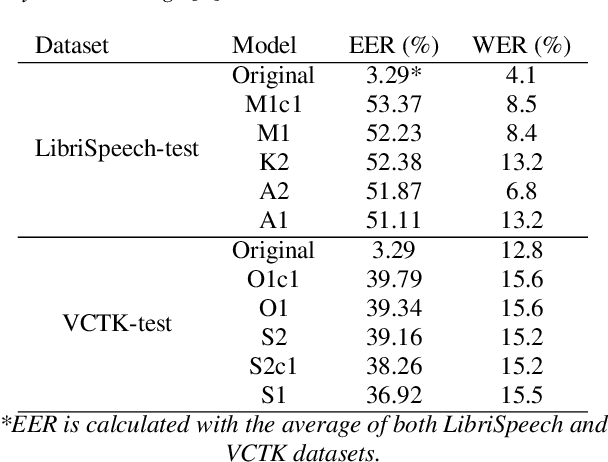
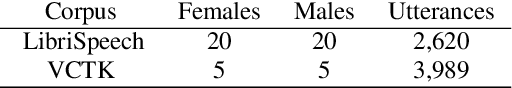
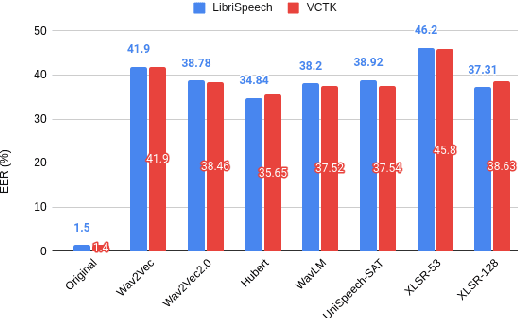
Collecting speech data is an important step in training speech recognition systems and other speech-based machine learning models. However, the issue of privacy protection is an increasing concern that must be addressed. The current study investigates the use of voice conversion as a method for anonymizing voices. In particular, we train several voice conversion models using self-supervised speech representations including Wav2Vec2.0, Hubert and UniSpeech. Converted voices retain a low word error rate within 1% of the original voice. Equal error rate increases from 1.52% to 46.24% on the LibriSpeech test set and from 3.75% to 45.84% on speakers from the VCTK corpus which signifies degraded performance on speaker verification. Lastly, we conduct experiments on dysarthric speech data to show that speech features relevant to articulation, prosody, phonation and phonology can be extracted from anonymized voices for discriminating between healthy and pathological speech.
Cross-lingual Self-Supervised Speech Representations for Improved Dysarthric Speech Recognition
Apr 04, 2022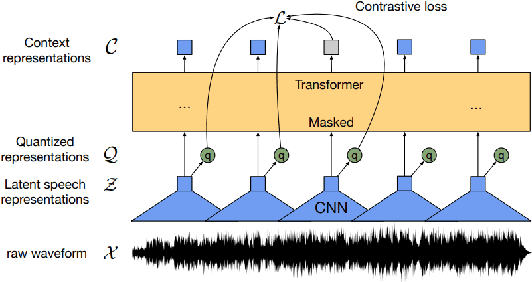
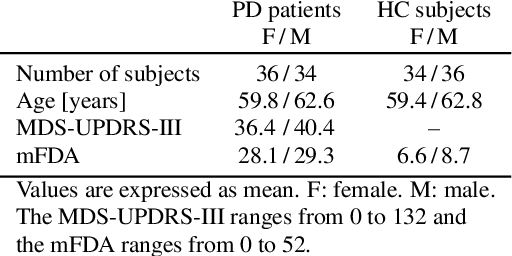
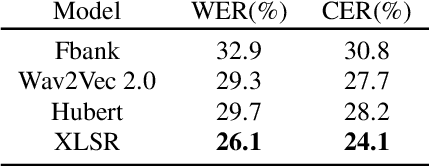
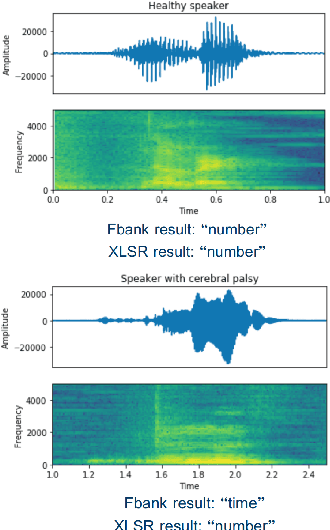
State-of-the-art automatic speech recognition (ASR) systems perform well on healthy speech. However, the performance on impaired speech still remains an issue. The current study explores the usefulness of using Wav2Vec self-supervised speech representations as features for training an ASR system for dysarthric speech. Dysarthric speech recognition is particularly difficult as several aspects of speech such as articulation, prosody and phonation can be impaired. Specifically, we train an acoustic model with features extracted from Wav2Vec, Hubert, and the cross-lingual XLSR model. Results suggest that speech representations pretrained on large unlabelled data can improve word error rate (WER) performance. In particular, features from the multilingual model led to lower WERs than filterbanks (Fbank) or models trained on a single language. Improvements were observed in English speakers with cerebral palsy caused dysarthria (UASpeech corpus), Spanish speakers with Parkinsonian dysarthria (PC-GITA corpus) and Italian speakers with paralysis-based dysarthria (EasyCall corpus). Compared to using Fbank features, XLSR-based features reduced WERs by 6.8%, 22.0%, and 7.0% for the UASpeech, PC-GITA, and EasyCall corpus, respectively.
Limited Parameter Denoising for Low-dose X-ray Computed Tomography Using Deep Reinforcement Learning
Apr 01, 2022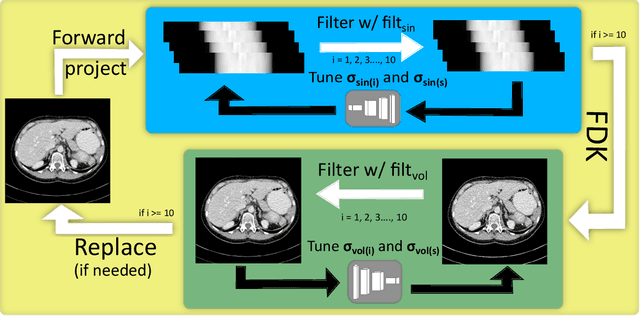
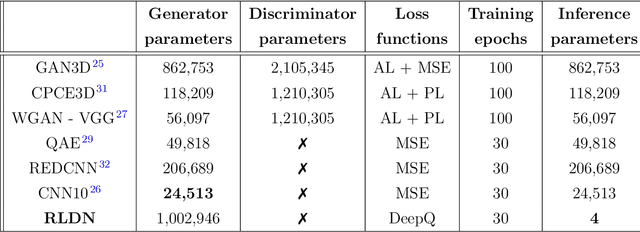
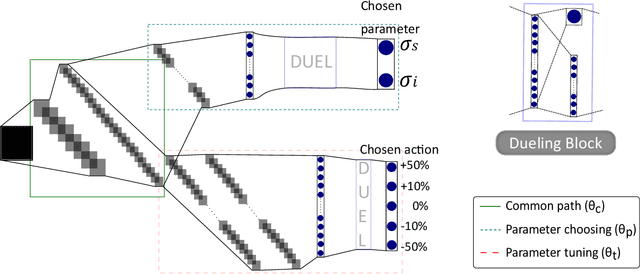
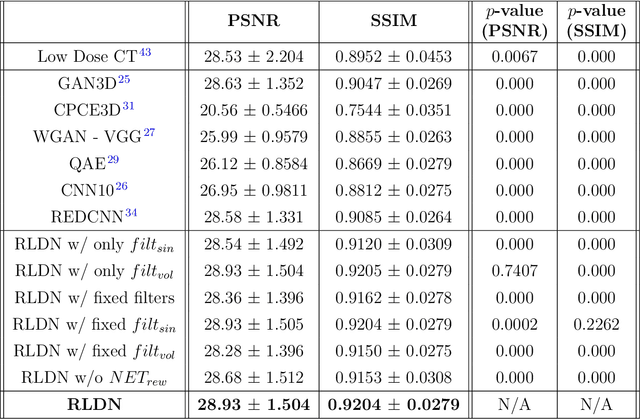
The use of deep learning has successfully solved several problems in the field of medical imaging. Deep learning has been applied to the CT denoising problem successfully. However, the use of deep learning requires large amounts of data to train deep convolutional networks (CNNs). Moreover, due to large parameter count, such deep CNNs may cause unexpected results. In this study, we introduce a novel CT denoising framework, which has interpretable behaviour, and provides useful results with limited data. We employ bilateral filtering in both the projection and volume domains to remove noise. To account for non-stationary noise, we tune the $\sigma$ parameters of the volume for every projection view, and for every volume pixel. The tuning is carried out by two deep CNNs. Due to impracticality of labelling, the two deep CNNs are trained via a Deep-Q reinforcement learning task. The reward for the task is generated by using a custom reward function represented by a neural network. Our experiments were carried out on abdominal scans for the Mayo Clinic TCIA dataset, and the AAPM Low Dose CT Grand Challenge. Our denoising framework has excellent denoising performance increasing the PSNR from 28.53 to 28.93, and increasing the SSIM from 0.8952 to 0.9204. We outperform several state-of-the-art deep CNNs, which have several orders of magnitude higher number of parameters (p-value (PSNR) = 0.000, p-value (SSIM) = 0.000). Our method does not introduce any blurring, which is introduced by MSE loss based methods, or any deep learning artifacts, which are introduced by WGAN based models. Our ablation studies show that parameter tuning and using our reward network results in the best possible results.
Simulation-Driven Training of Vision Transformers Enabling Metal Segmentation in X-Ray Images
Mar 17, 2022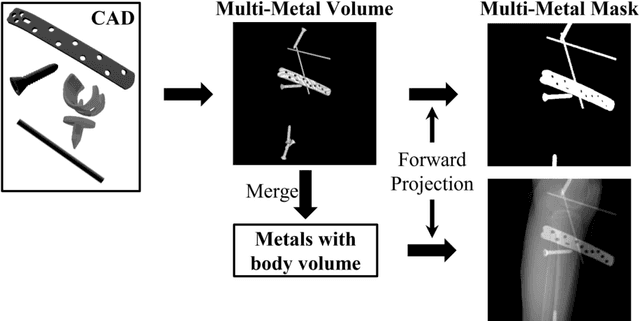
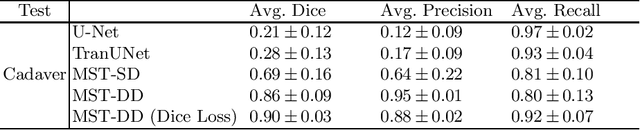
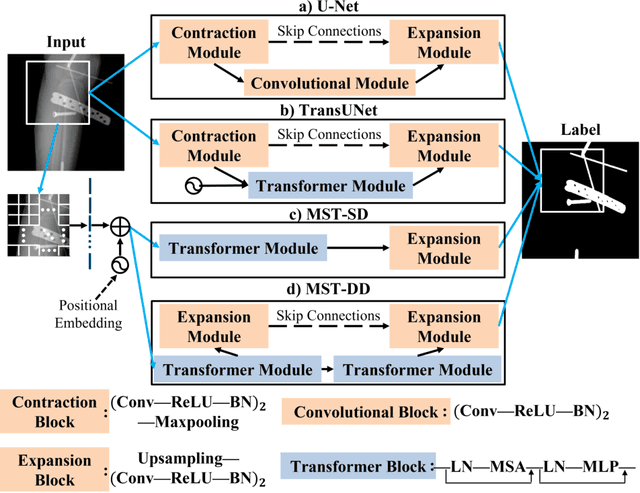
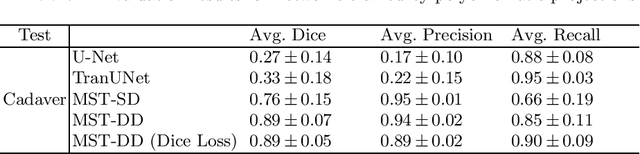
In several image acquisition and processing steps of X-ray radiography, knowledge of the existence of metal implants and their exact position is highly beneficial (e.g. dose regulation, image contrast adjustment). Another application which would benefit from an accurate metal segmentation is cone beam computed tomography (CBCT) which is based on 2D X-ray projections. Due to the high attenuation of metals, severe artifacts occur in the 3D X-ray acquisitions. The metal segmentation in CBCT projections usually serves as a prerequisite for metal artifact avoidance and reduction algorithms. Since the generation of high quality clinical training is a constant challenge, this study proposes to generate simulated X-ray images based on CT data sets combined with self-designed computer aided design (CAD) implants and make use of convolutional neural network (CNN) and vision transformer (ViT) for metal segmentation. Model test is performed on accurately labeled X-ray test datasets obtained from specimen scans. The CNN encoder-based network like U-Net has limited performance on cadaver test data with an average dice score below 0.30, while the metal segmentation transformer with dual decoder (MST-DD) shows high robustness and generalization on the segmentation task, with an average dice score of 0.90. Our study indicates that the CAD model-based data generation has high flexibility and could be a way to overcome the problem of shortage in clinical data sampling and labelling. Furthermore, the MST-DD approach generates a more reliable neural network in case of training on simulated data.
Neural Network based Successor Representations of Space and Language
Feb 22, 2022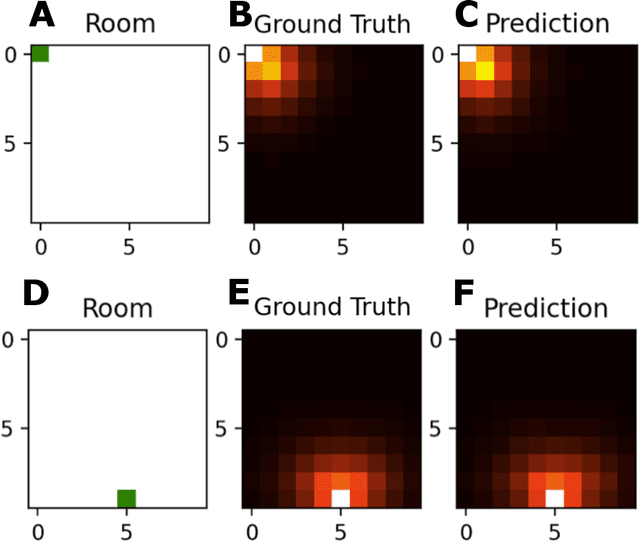
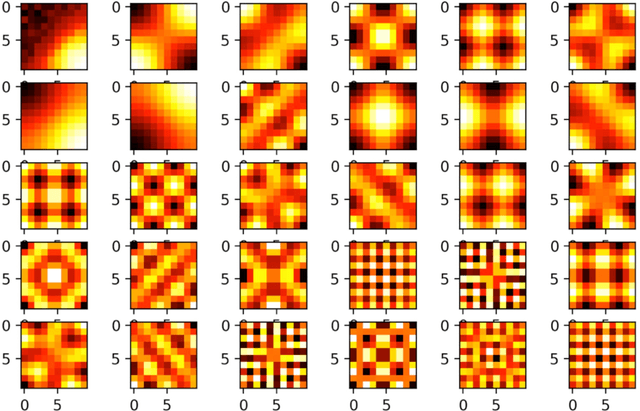
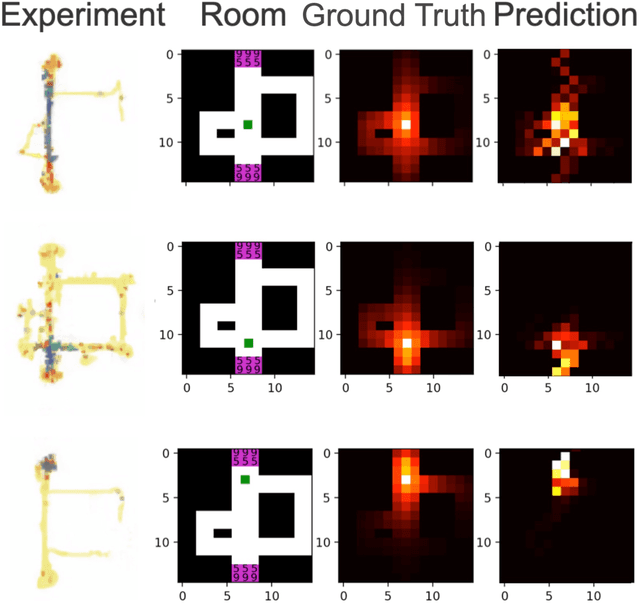
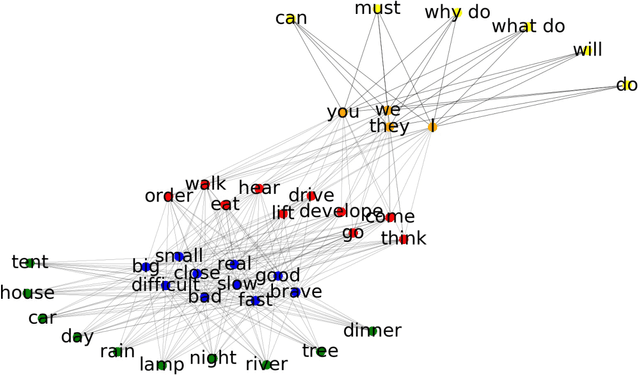
How does the mind organize thoughts? The hippocampal-entorhinal complex is thought to support domain-general representation and processing of structural knowledge of arbitrary state, feature and concept spaces. In particular, it enables the formation of cognitive maps, and navigation on these maps, thereby broadly contributing to cognition. It has been proposed that the concept of multi-scale successor representations provides an explanation of the underlying computations performed by place and grid cells. Here, we present a neural network based approach to learn such representations, and its application to different scenarios: a spatial exploration task based on supervised learning, a spatial navigation task based on reinforcement learning, and a non-spatial task where linguistic constructions have to be inferred by observing sample sentences. In all scenarios, the neural network correctly learns and approximates the underlying structure by building successor representations. Furthermore, the resulting neural firing patterns are strikingly similar to experimentally observed place and grid cell firing patterns. We conclude that cognitive maps and neural network-based successor representations of structured knowledge provide a promising way to overcome some of the short comings of deep learning towards artificial general intelligence.
Deep learning-guided weighted averaging for signal dropout compensation in diffusion-weighted imaging of the liver
Feb 20, 2022Purpose: To develop an algorithm for the retrospective correction of signal dropout artifacts in abdominal diffusion-weighted imaging (DWI) resulting from cardiac motion. Methods: Given a set of image repetitions for a slice, a locally adaptive weighted averaging is proposed which aims to suppress the contribution of image regions affected by signal dropouts. Corresponding weight maps were estimated by a sliding-window algorithm which analyzed signal deviations from a patch-wise reference. In order to ensure the computation of a robust reference, repetitions were filtered by a classifier that was trained to detect images corrupted by signal dropouts. The proposed method, termed Deep Learning-guided Adaptive Weighted Averaging (DLAWA), was evaluated in terms of dropout suppression capability, bias reduction in the Apparent Diffusion Coefficient (ADC) and noise characteristics. Results: In the case of uniform averaging, motion-related dropouts caused signal attenuation and ADC overestimation in parts of the liver with the left lobe being affected particularly. Both effects could be substantially mitigated by DLAWA while preventing global penalties with respect to signal-to-noise ratio (SNR) due to local signal suppression. Performing evaluations on patient data, the capability to recover lesions concealed by signal dropouts was demonstrated as well. Further, DLAWA allowed for transparent control of the trade-off between SNR and signal dropout suppression by means of a few hyperparameters. Conclusion: This work presents an effective and flexible method for the local compensation of signal dropouts resulting from motion and pulsation. Since DLAWA follows a retrospective approach, no changes to the acquisition are required.
Learning Perspective Deformation in X-Ray Transmission Imaging
Feb 13, 2022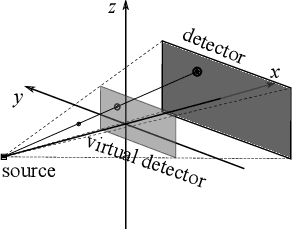
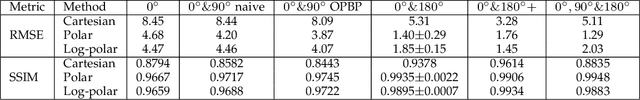
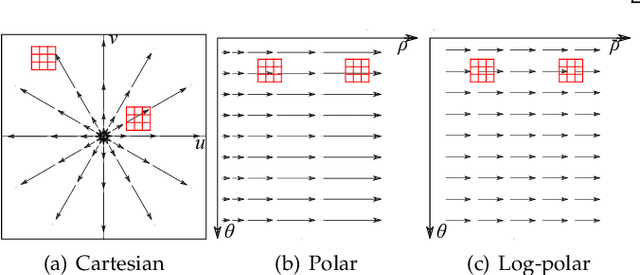
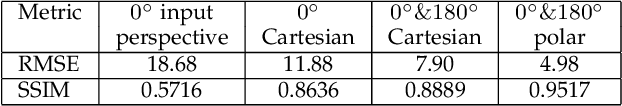
In cone-beam X-ray transmission imaging, due to the divergence of X-rays, imaged structures with different depths have different magnification factors on an X-ray detector, which results in perspective deformation. Perspective deformation causes difficulty in direct, accurate geometric assessments of anatomical structures. In this work, to reduce perspective deformation in X-ray images acquired from regular cone-beam computed tomography (CBCT) systems, we investigate on learning perspective deformation, i.e., converting perspective projections into orthogonal projections. Directly converting a single perspective projection image into an orthogonal projection image is extremely challenging due to the lack of depth information. Therefore, we propose to utilize one additional perspective projection, a complementary (180-degree) or orthogonal (90-degree) view, to provide a certain degree of depth information. Furthermore, learning perspective deformation in different spatial domains is investigated. Our proposed method is evaluated on numerical spherical bead phantoms as well as patients' chest and head X-ray data. The experiments on numerical bead phantom data demonstrate that learning perspective deformation in polar coordinates has significant advantages over learning in Cartesian coordinates, as root-mean-square error (RMSE) decreases from 5.31 to 1.40, while learning in log-polar coordinates has no further considerable improvement (RMSE = 1.85). In addition, using a complementary view (RMSE = 1.40) is better than an orthogonal view (RMSE = 3.87). The experiments on patients' chest and head data demonstrate that learning perspective deformation using dual complementary views is also applicable in anatomical X-ray data, allowing accurate cardiothoracic ratio measurements in chest X-ray images and cephalometric analysis in synthetic cephalograms from cone-beam X-ray projections.
CAD-RADS Scoring using Deep Learning and Task-Specific Centerline Labeling
Feb 08, 2022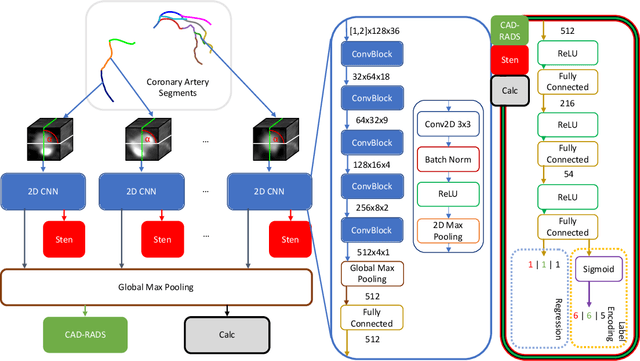
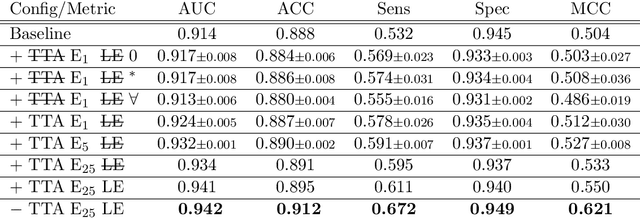
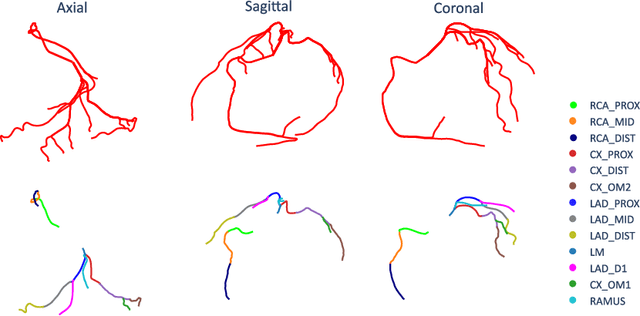
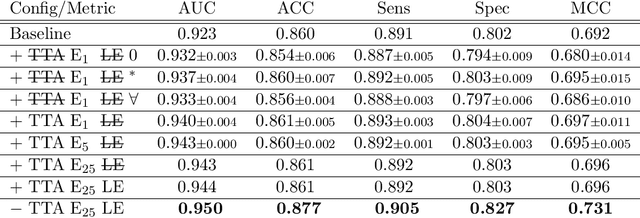
With coronary artery disease (CAD) persisting to be one of the leading causes of death worldwide, interest in supporting physicians with algorithms to speed up and improve diagnosis is high. In clinical practice, the severeness of CAD is often assessed with a coronary CT angiography (CCTA) scan and manually graded with the CAD-Reporting and Data System (CAD-RADS) score. The clinical questions this score assesses are whether patients have CAD or not (rule-out) and whether they have severe CAD or not (hold-out). In this work, we reach new state-of-the-art performance for automatic CAD-RADS scoring. We propose using severity-based label encoding, test time augmentation (TTA) and model ensembling for a task-specific deep learning architecture. Furthermore, we introduce a novel task- and model-specific, heuristic coronary segment labeling, which subdivides coronary trees into consistent parts across patients. It is fast, robust, and easy to implement. We were able to raise the previously reported area under the receiver operating characteristic curve (AUC) from 0.914 to 0.942 in the rule-out and from 0.921 to 0.950 in the hold-out task respectively.
SliTraNet: Automatic Detection of Slide Transitions in Lecture Videos using Convolutional Neural Networks
Feb 07, 2022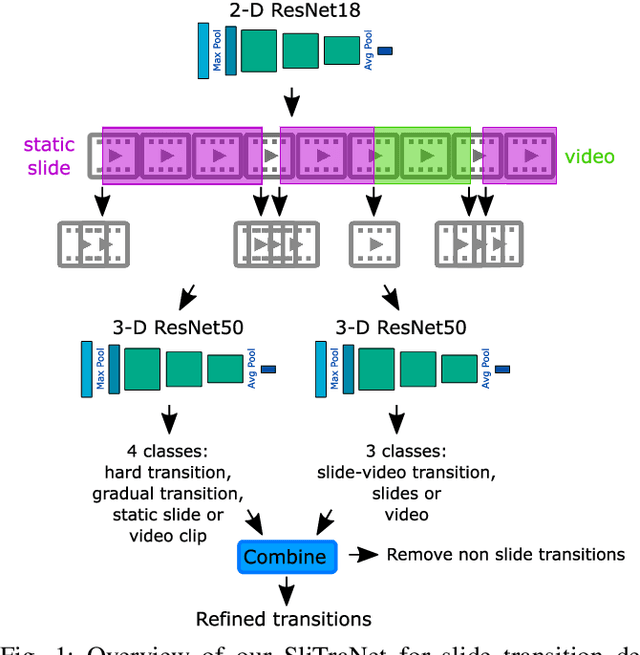
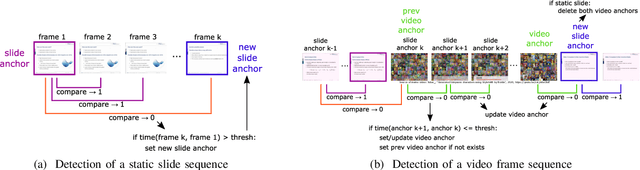
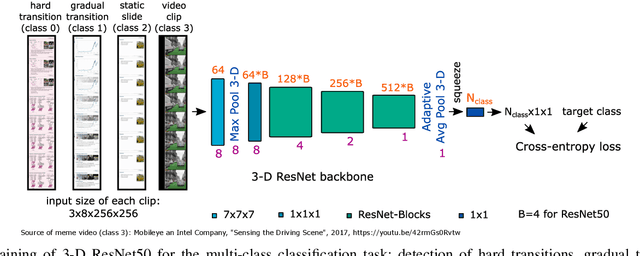
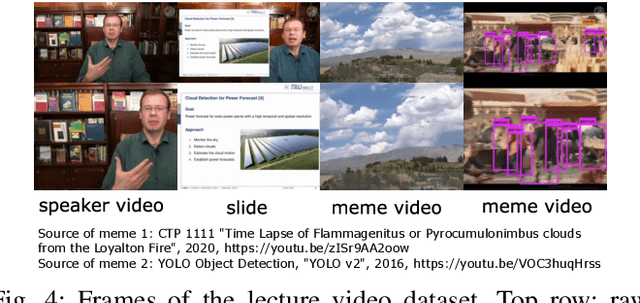
With the increasing number of online learning material in the web, search for specific content in lecture videos can be time consuming. Therefore, automatic slide extraction from the lecture videos can be helpful to give a brief overview of the main content and to support the students in their studies. For this task, we propose a deep learning method to detect slide transitions in lectures videos. We first process each frame of the video by a heuristic-based approach using a 2-D convolutional neural network to predict transition candidates. Then, we increase the complexity by employing two 3-D convolutional neural networks to refine the transition candidates. Evaluation results demonstrate the effectiveness of our method in finding slide transitions.