 Add to Chrome
 Add to Firefox
 Add to Edge
Investigating simple target-covariate relationships for Chronos-2 and TabPFN-TS
May 12, 2026Time Series Foundation Models (TSFMs) have recently achieved state-of-the-art performance, often outperforming supervised models in zero-shot settings. Recent TSFM architectures, such as Chronos-2 and TabPFN-TS, aim to integrate covariates. In this paper, we design controlled experiments based on simple target-covariate relationships to assess this integration capability. Our results show that TabPFN-TS captures these relationships more effectively than Chronos-2, especially for short horizons, suggesting that the strong benchmark performance of Chronos-2 does not automatically translate into optimal modeling of simple covariate-target dependencies.
GALACTIC: Global and Local Agnostic Counterfactuals for Time-series Clustering
Mar 05, 2026Time-series clustering is a fundamental tool for pattern discovery, yet existing explainability methods, primarily based on feature attribution or metadata, fail to identify the transitions that move an instance across cluster boundaries. While Counterfactual Explanations (CEs) identify the minimal temporal perturbations required to alter the prediction of a model, they have been mostly confined to supervised settings. This paper introduces GALACTIC, the first unified framework to bridge local and global counterfactual explainability for unsupervised time-series clustering. At instance level (local), GALACTIC generates perturbations via a cluster-aware optimization objective that respects the target and underlying cluster assignments. At cluster level (global), to mitigate cognitive load and enhance interpretability, we formulate a representative CE selection problem. We propose a Minimum Description Length (MDL) objective to extract a non-redundant summary of global explanations that characterize the transitions between clusters. We prove that our MDL objective is supermodular, which allows the corresponding MDL reduction to be framed as a monotone submodular set function. This enables an efficient greedy selection algorithm with provable $(1-1/e)$ approximation guarantees. Extensive experimental evaluation on the UCR Archive demonstrates that GALACTIC produces significantly sparser local CEs and more concise global summaries than state-of-the-art baselines adapted for our problem, offering the first unified approach for interpreting clustered time-series through counterfactuals.
SEAnet: A Deep Learning Architecture for Data Series Similarity Search
Mar 02, 2026A key operation for massive data series collection analysis is similarity search. According to recent studies, SAX-based indexes offer state-of-the-art performance for similarity search tasks. However, their performance lags under high-frequency, weakly correlated, excessively noisy, or other dataset-specific properties. In this work, we propose Deep Embedding Approximation (DEA), a novel family of data series summarization techniques based on deep neural networks. Moreover, we describe SEAnet, a novel architecture especially designed for learning DEA, that introduces the Sum of Squares preservation property into the deep network design. We further enhance SEAnet with SEAtrans encoder. Finally, we propose novel sampling strategies, SEAsam and SEAsamE, that allow SEAnet to effectively train on massive datasets. Comprehensive experiments on 7 diverse synthetic and real datasets verify the advantages of DEA learned using SEAnet in providing high-quality data series summarizations and similarity search results.
* This paper was published in IEEE Transactions on Knowledge and Data Engineering (Volume: 35, Issue: 12, Page(s): 12972 - 12986, 01 December 2023). Date of Publication: 25 April 2023
ParisKV: Fast and Drift-Robust KV-Cache Retrieval for Long-Context LLMs
Feb 07, 2026KV-cache retrieval is essential for long-context LLM inference, yet existing methods struggle with distribution drift and high latency at scale. We introduce ParisKV, a drift-robust, GPU-native KV-cache retrieval framework based on collision-based candidate selection, followed by a quantized inner-product reranking estimator. For million-token contexts, ParisKV supports CPU-offloaded KV caches via Unified Virtual Addressing (UVA), enabling on-demand top-$k$ fetching with minimal overhead. ParisKV matches or outperforms full attention quality on long-input and long-generation benchmarks. It achieves state-of-the-art long-context decoding efficiency: it matches or exceeds full attention speed even at batch size 1 for long contexts, delivers up to 2.8$\times$ higher throughput within full attention's runnable range, and scales to million-token contexts where full attention runs out of memory. At million-token scale, ParisKV reduces decode latency by 17$\times$ and 44$\times$ compared to MagicPIG and PQCache, respectively, two state-of-the-art KV-cache Top-$k$ retrieval baselines.
Rethinking Zero-Shot Time Series Classification: From Task-specific Classifiers to In-Context Inference
Jan 31, 2026The zero-shot evaluation of time series foundation models (TSFMs) for classification typically uses a frozen encoder followed by a task-specific classifier. However, this practice violates the training-free premise of zero-shot deployment and introduces evaluation bias due to classifier-dependent training choices. To address this issue, we propose TIC-FM, an in-context learning framework that treats the labeled training set as context and predicts labels for all test instances in a single forward pass, without parameter updates. TIC-FM pairs a time series encoder and a lightweight projection adapter with a split-masked latent memory Transformer. We further provide theoretical justification that in-context inference can subsume trained classifiers and can emulate gradient-based classifier training within a single forward pass. Experiments on 128 UCR datasets show strong accuracy, with consistent gains in the extreme low-label situation, highlighting training-free transfer
MSAD: A Deep Dive into Model Selection for Time series Anomaly Detection
Oct 30, 2025Anomaly detection is a fundamental task for time series analytics with important implications for the downstream performance of many applications. Despite increasing academic interest and the large number of methods proposed in the literature, recent benchmarks and evaluation studies demonstrated that no overall best anomaly detection methods exist when applied to very heterogeneous time series datasets. Therefore, the only scalable and viable solution to solve anomaly detection over very different time series collected from diverse domains is to propose a model selection method that will select, based on time series characteristics, the best anomaly detection methods to run. Existing AutoML solutions are, unfortunately, not directly applicable to time series anomaly detection, and no evaluation of time series-based approaches for model selection exists. Towards that direction, this paper studies the performance of time series classification methods used as model selection for anomaly detection. In total, we evaluate 234 model configurations derived from 16 base classifiers across more than 1980 time series, and we propose the first extensive experimental evaluation of time series classification as model selection for anomaly detection. Our results demonstrate that model selection methods outperform every single anomaly detection method while being in the same order of magnitude regarding execution time. This evaluation is the first step to demonstrate the accuracy and efficiency of time series classification algorithms for anomaly detection, and represents a strong baseline that can then be used to guide the model selection step in general AutoML pipelines. Preprint version of an article accepted at the VLDB Journal.
* 25 pages, 13 figures, VLDB Journal
Few Labels are all you need: A Weakly Supervised Framework for Appliance Localization in Smart-Meter Series
Jun 06, 2025Improving smart grid system management is crucial in the fight against climate change, and enabling consumers to play an active role in this effort is a significant challenge for electricity suppliers. In this regard, millions of smart meters have been deployed worldwide in the last decade, recording the main electricity power consumed in individual households. This data produces valuable information that can help them reduce their electricity footprint; nevertheless, the collected signal aggregates the consumption of the different appliances running simultaneously in the house, making it difficult to apprehend. Non-Intrusive Load Monitoring (NILM) refers to the challenge of estimating the power consumption, pattern, or on/off state activation of individual appliances using the main smart meter signal. Recent methods proposed to tackle this task are based on a fully supervised deep-learning approach that requires both the aggregate signal and the ground truth of individual appliance power. However, such labels are expensive to collect and extremely scarce in practice, as they require conducting intrusive surveys in households to monitor each appliance. In this paper, we introduce CamAL, a weakly supervised approach for appliance pattern localization that only requires information on the presence of an appliance in a household to be trained. CamAL merges an ensemble of deep-learning classifiers combined with an explainable classification method to be able to localize appliance patterns. Our experimental evaluation, conducted on 4 real-world datasets, demonstrates that CamAL significantly outperforms existing weakly supervised baselines and that current SotA fully supervised NILM approaches require significantly more labels to reach CamAL performances. The source of our experiments is available at: https://github.com/adrienpetralia/CamAL. This paper appeared in ICDE 2025.
* 12 pages, 10 figures. This paper appeared in IEEE ICDE 2025
DeviceScope: An Interactive App to Detect and Localize Appliance Patterns in Electricity Consumption Time Series
Jun 06, 2025


In recent years, electricity suppliers have installed millions of smart meters worldwide to improve the management of the smart grid system. These meters collect a large amount of electrical consumption data to produce valuable information to help consumers reduce their electricity footprint. However, having non-expert users (e.g., consumers or sales advisors) understand these data and derive usage patterns for different appliances has become a significant challenge for electricity suppliers because these data record the aggregated behavior of all appliances. At the same time, ground-truth labels (which could train appliance detection and localization models) are expensive to collect and extremely scarce in practice. This paper introduces DeviceScope, an interactive tool designed to facilitate understanding smart meter data by detecting and localizing individual appliance patterns within a given time period. Our system is based on CamAL (Class Activation Map-based Appliance Localization), a novel weakly supervised approach for appliance localization that only requires the knowledge of the existence of an appliance in a household to be trained. This paper appeared in ICDE 2025.
* 4 pages, 5 figures. This paper appeared in ICDE 2025
NILMFormer: Non-Intrusive Load Monitoring that Accounts for Non-Stationarity
Jun 06, 2025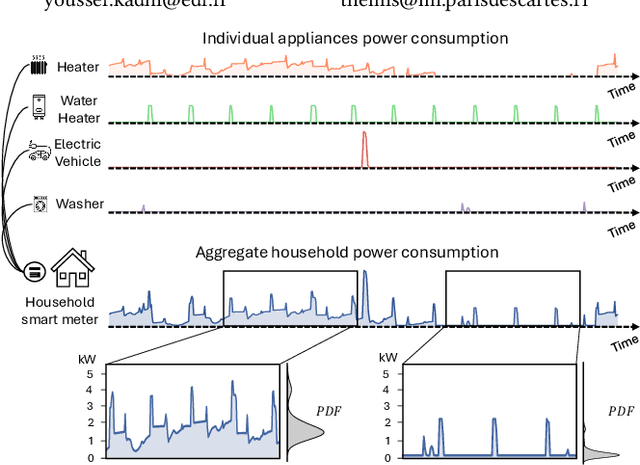
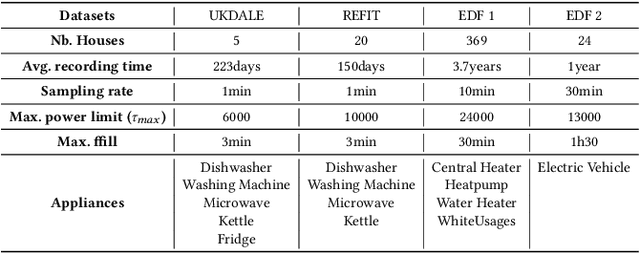
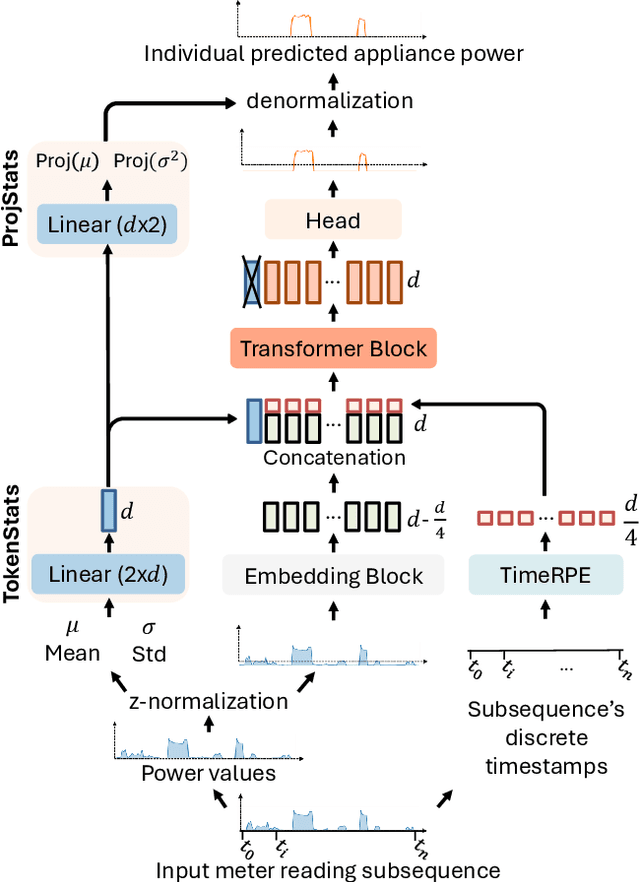
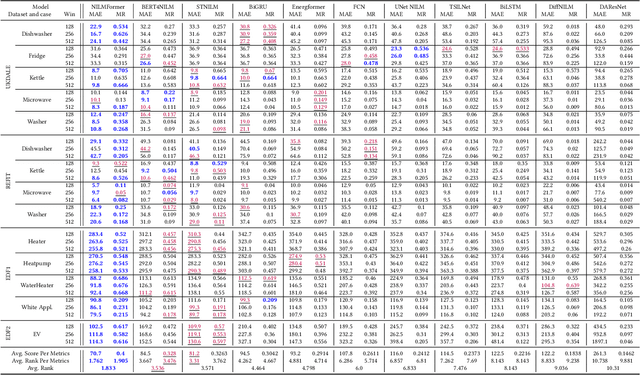
Millions of smart meters have been deployed worldwide, collecting the total power consumed by individual households. Based on these data, electricity suppliers offer their clients energy monitoring solutions to provide feedback on the consumption of their individual appliances. Historically, such estimates have relied on statistical methods that use coarse-grained total monthly consumption and static customer data, such as appliance ownership. Non-Intrusive Load Monitoring (NILM) is the problem of disaggregating a household's collected total power consumption to retrieve the consumed power for individual appliances. Current state-of-the-art (SotA) solutions for NILM are based on deep-learning (DL) and operate on subsequences of an entire household consumption reading. However, the non-stationary nature of real-world smart meter data leads to a drift in the data distribution within each segmented window, which significantly affects model performance. This paper introduces NILMFormer, a Transformer-based architecture that incorporates a new subsequence stationarization/de-stationarization scheme to mitigate the distribution drift and that uses a novel positional encoding that relies only on the subsequence's timestamp information. Experiments with 4 real-world datasets show that NILMFormer significantly outperforms the SotA approaches. Our solution has been deployed as the backbone algorithm for EDF's (Electricit\'e De France) consumption monitoring service, delivering detailed insights to millions of customers about their individual appliances' power consumption. This paper appeared in KDD 2025.
* 12 pages, 8 figures. This paper appeared in ACM SIGKDD 2025
LEAD: Iterative Data Selection for Efficient LLM Instruction Tuning
May 12, 2025Instruction tuning has emerged as a critical paradigm for improving the capabilities and alignment of large language models (LLMs). However, existing iterative model-aware data selection methods incur significant computational overhead, as they rely on repeatedly performing full-dataset model inference to estimate sample utility for subsequent training iterations, creating a fundamental efficiency bottleneck. In this paper, we propose LEAD, an efficient iterative data selection framework that accurately estimates sample utility entirely within the standard training loop, eliminating the need for costly additional model inference. At its core, LEAD introduces Instance-Level Dynamic Uncertainty (IDU), a theoretically grounded utility function combining instantaneous training loss, gradient-based approximation of loss changes, and exponential smoothing of historical loss signals. To further scale efficiently to large datasets, LEAD employs a two-stage, coarse-to-fine selection strategy, adaptively prioritizing informative clusters through a multi-armed bandit mechanism, followed by precise fine-grained selection of high-utility samples using IDU. Extensive experiments across four diverse benchmarks show that LEAD significantly outperforms state-of-the-art methods, improving average model performance by 6.1%-10.8% while using only 2.5% of the training data and reducing overall training time by 5-10x.